

Trading position (short-term, our opinion; levels for S&P 500 continuous futures contract): short positions with entry at 4,540 price level, with 4,630 as a stop-loss and 4,400 as a price target.
Stocks extended their rally yesterday, as the S&P 500 reached the new record high. Will the uptrend continue? Or is a reversal coming?
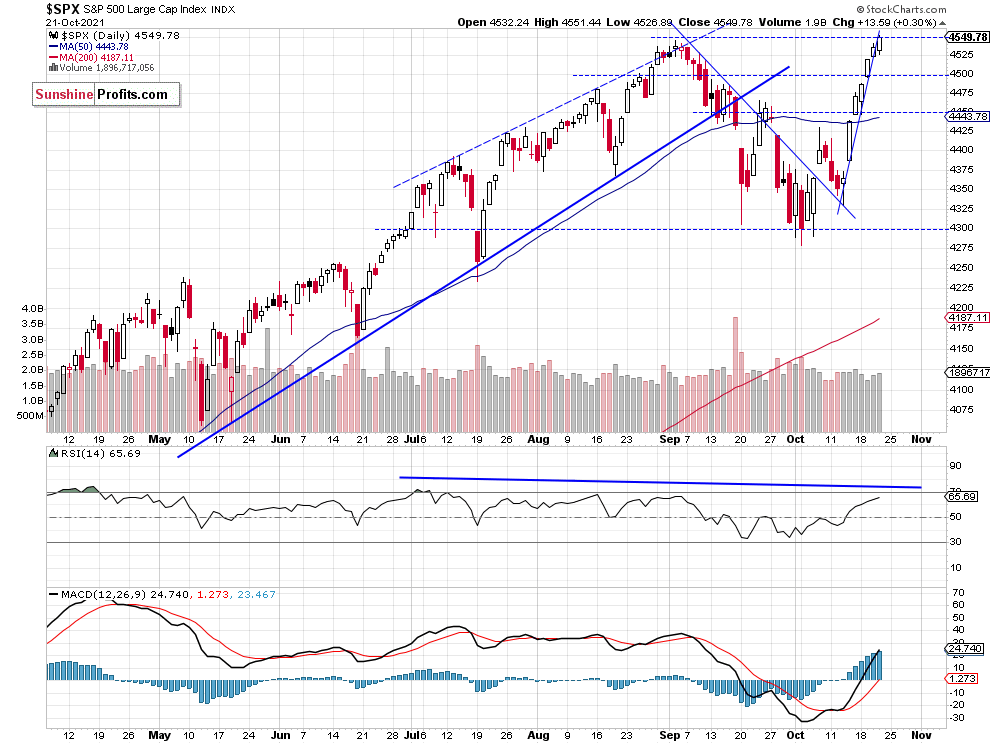
The S&P 500 index gained 0.30% on Thursday, Oct. 21. and it broke slightly above its early September record high. Yesterday’s daily high was at 4,551.44. So, the downward correction is officially over now. The stock market is reacting to quarterly corporate earnings releases and they’ve only started to gain traction this week. The market seems overbought in the short-term. And we may see a consolidation or a downward correction in the near term.
The nearest important support level is at 4,520-4,525, marked by the Wednesday’s daily gap up of 4,520.40-4,524.40. The support level is also at 4,485-4,500, marked by Tuesday’s daily gap up of 4,488.75-4,496.41 and the previous resistance level. On the other hand, the resistance level is at around 4,550. The S&P 500 extends its rally along a very steep week-long upward trend line, as we can see on the daily chart (chart by courtesy of http://stockcharts.com):
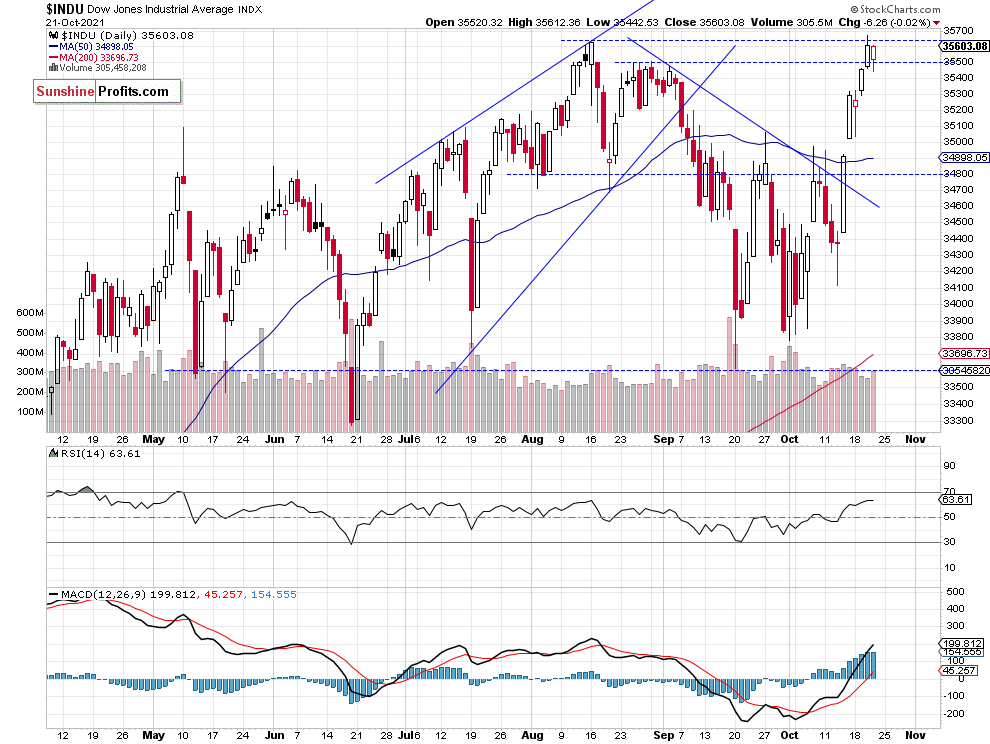
Dow Jones Trades Along the New Record High
Let’s take a look at the Dow Jones Industrial Average chart. The blue-chip index broke above its over month-long downward trend line and then it accelerated up above the 35,000 mark, as it reached the new record high on Wednesday. The nearest important support level is now at 35,400-35,500, marked by the recent resistance level, as we can see on the daily chart:
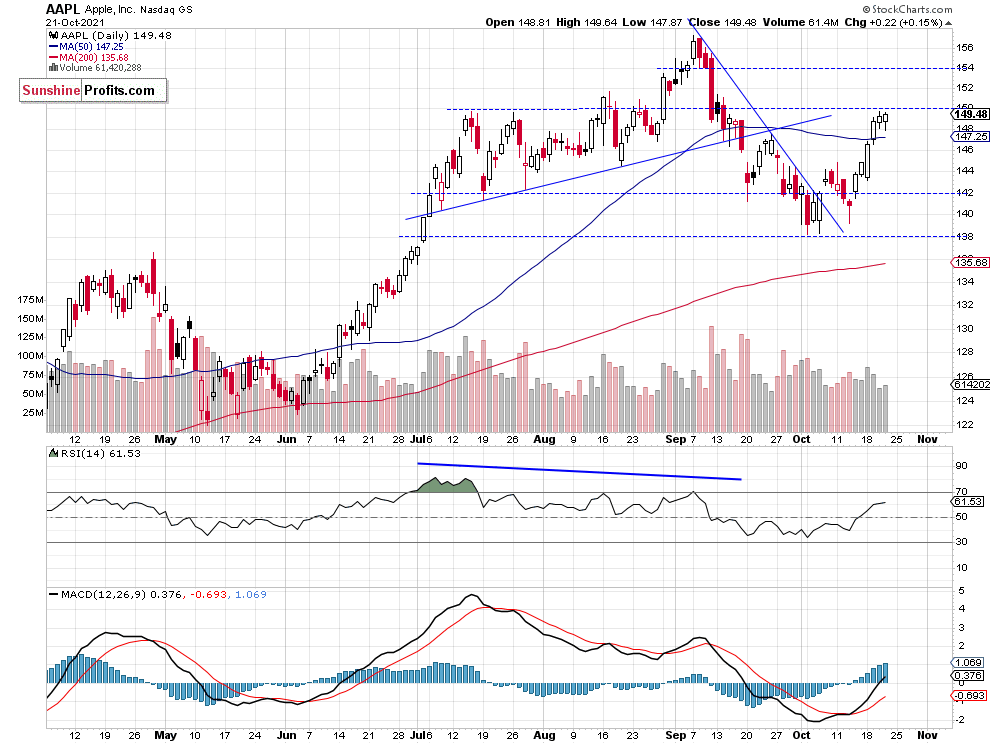
Apple Is Still At the Previous Local Highs
Apple stock weighs around 6.2% in the S&P 500 index, so it is important for the whole broad stock market picture. The stock broke above its short-term resistance level of around $144-145 recently. The nearest important resistance level is at $148-150. The stock is still relatively weaker than the broad stock market, as it is trading below the July-August local highs.
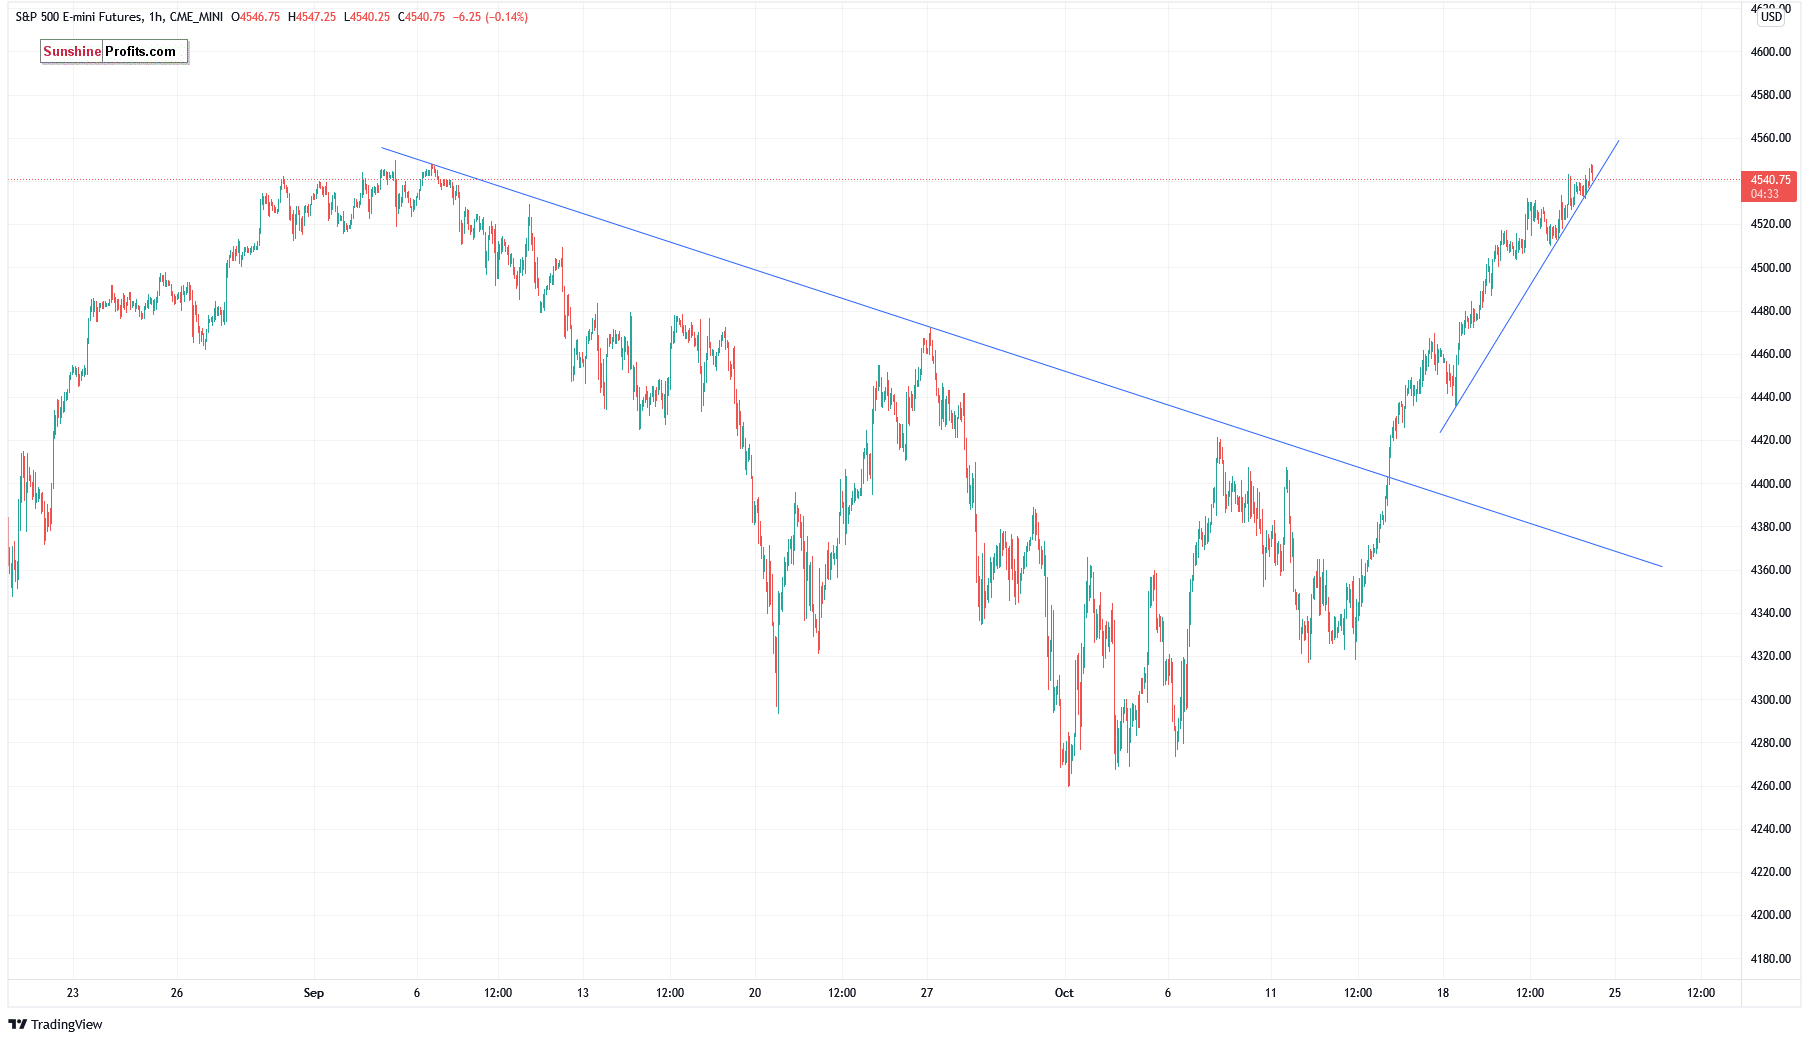
Futures Contract – Opening a Short Position
Let’s take a look at the hourly chart of the S&P 500 futures contract. Last week, the market broke above its downward trend line and it broke above its previous local high of around 4,470. The nearest important resistance level remains at around 4,550, marked by the early September topping pattern.
The market seems overbought and poised for a correction. Therefore, we decided to open a speculative short position this morning, just before the opening of the cash market (4,540 price level). (chart by courtesy of http://tradingview.com):
Conclusion
The S&P 500 index reached the new record high of 4,551.44, as it broke slightly above its early September local high. So the month-long downward correction is officially over now. But will the market extend its uptrend and accelerate towards the 4,600 level? The market seems overbought in the short term. However, the ongoing quarterly corporate earnings releases are still supporting buyers. Today the market is expected to slightly lower and we may see a consolidation or an intraday downward correction.
We decided to open a speculative short position this morning (4,540 price level). We are expecting a 3% correction from the current levels.
Here’s the breakdown:
- The S&P 500 has retraced all of its downward correction from the Sep. 2 local high yesterday, as it reached the new record high.
- Opening a speculative short position (4,540 price level) is justified from the risk/reward perspective.
- We are expecting a 3% correction from the current levels.
As always, we’ll keep you, our subscribers, well-informed.
Trading position (short-term, our opinion; levels for S&P 500 continuous futures contract): short positions with entry at 4,540 price level, with 4,630 as a stop-loss and 4,400 as a price target.
Thank you.
Paul Rejczak,
Stock Trading Strategist
Sunshine Profits: Effective Investments through Diligence and Care

