

Briefly:
Intraday trade: The S&P 500 index gained 1.1% on Monday, after opening 1.1% higher. The broad stock market will probably open lower today. We may see some short-term fluctuations along the resistance level of around 2,800.
Trading position (short-term; our opinion): no positions are justified from the risk/reward perspective.
Our short-term outlook is neutral, and our medium-term outlook is neutral:
Short-term outlook (next 1-2 weeks): neutral
Medium-term outlook (next 1-3 months): neutral
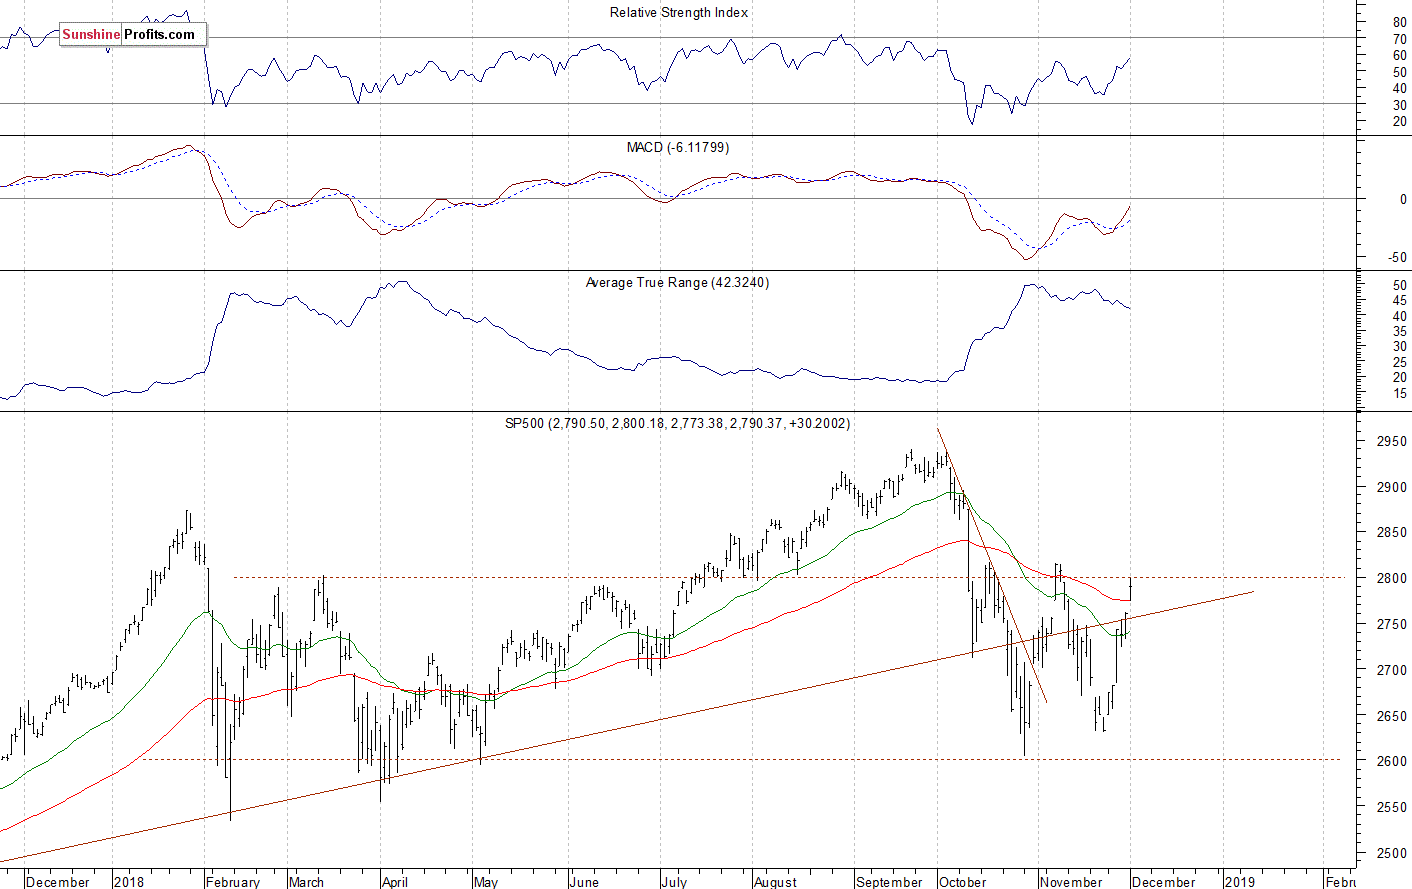
The U.S. stock market indexes gained 1.1-1.5% on Monday, as investors reacted to Sunday's U.S. - China trade tariffs talks. The S&P 500 index has reached 2,800 mark again. It currently trades 5.0% below September the 21st record high of 2,940.91. The Dow Jones Industrial Average gained 1.1% and the Nasdaq Composite gained 1.5% on Monday.
The nearest important level of resistance of the S&P 500 index is now at 2,800-2,815, marked by the early November local highs. The next resistance level is at 2,860-2,900, marked by some previous fluctuations. On the other hand, the support level is at 2,760-2,765, marked by yesterday's daily gap up of 2,760.88-2,773.38. The support level is also at 2,750, marked by the previous level of resistance.
The broad stock market got closer to its late October low recently. The S&P 500 index traded more than 10% below the record high. But it was a bottoming pattern before an upward reversal. The market is above the long-term upward trend line again and it may get back above 2,800 mark. So will the uptrend continue? For now, it still looks like a two-month-long consolidation following the October rout:
Uncertainty Following Yesterday's Advance
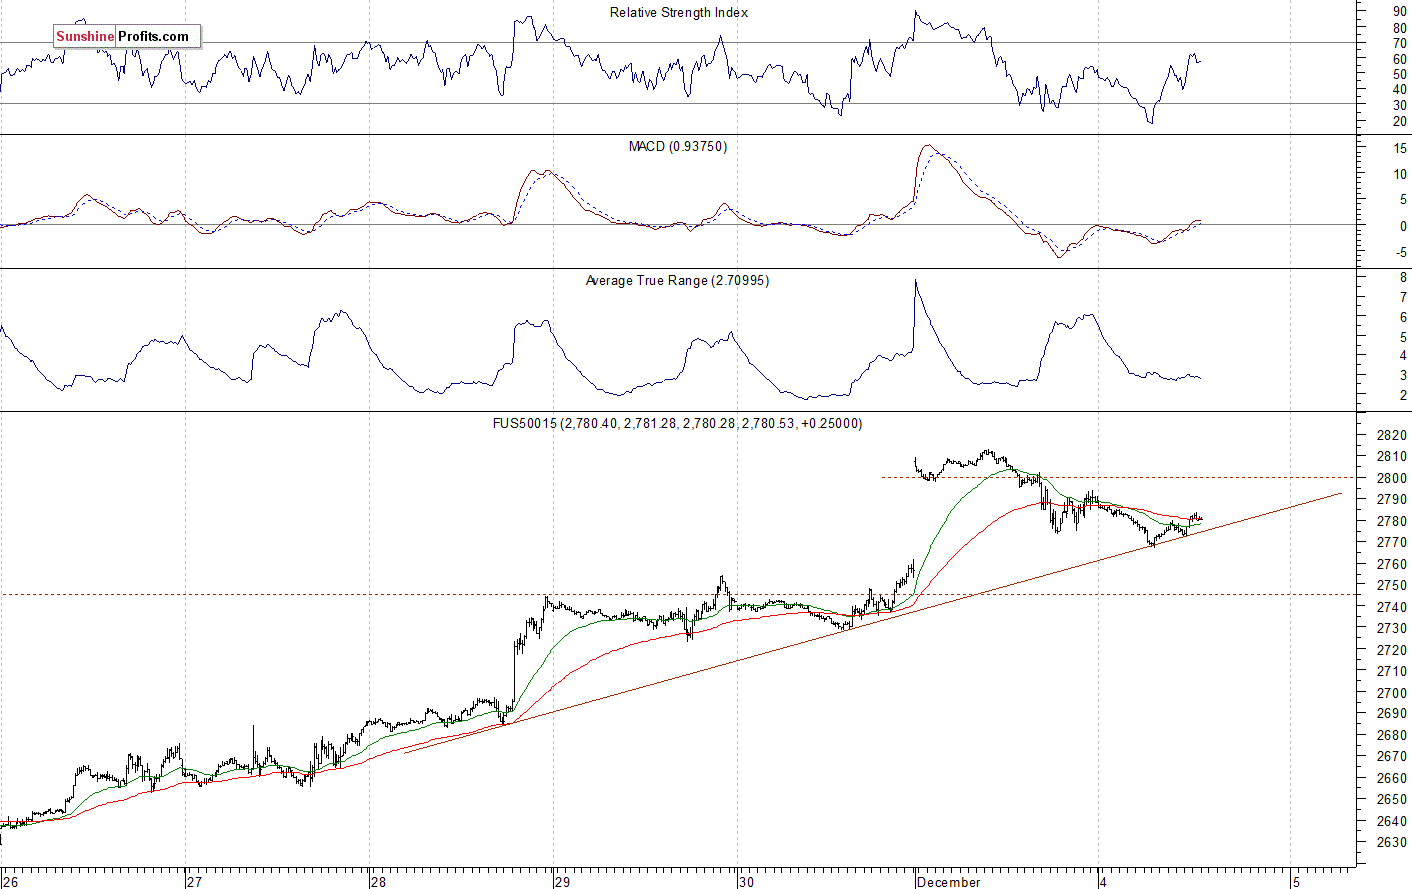
Expectations before the opening of today's trading session are negative, because the index futures contracts trade 0.4-0.5% lower vs. their Monday's closing prices. The European stock market indexes have lost 0.7% so far. There will be no new important economic data announcements today. The broad stock market will likely retrace some of its yesterday's advance. However, there have been no confirmed negative signals so far. Therefore, we could see another attempt at breaking above 2,800 mark.
The S&P 500 futures contract trades within an intraday consolidation following yesterday's intraday decline. The nearest important level of resistance is at around 2,790-2,800. On the other hand, the support level remains at 2,750-2,760, among others. The futures contract continues to trade slightly below 2,800 mark, as we can see on the 15-minute chart:
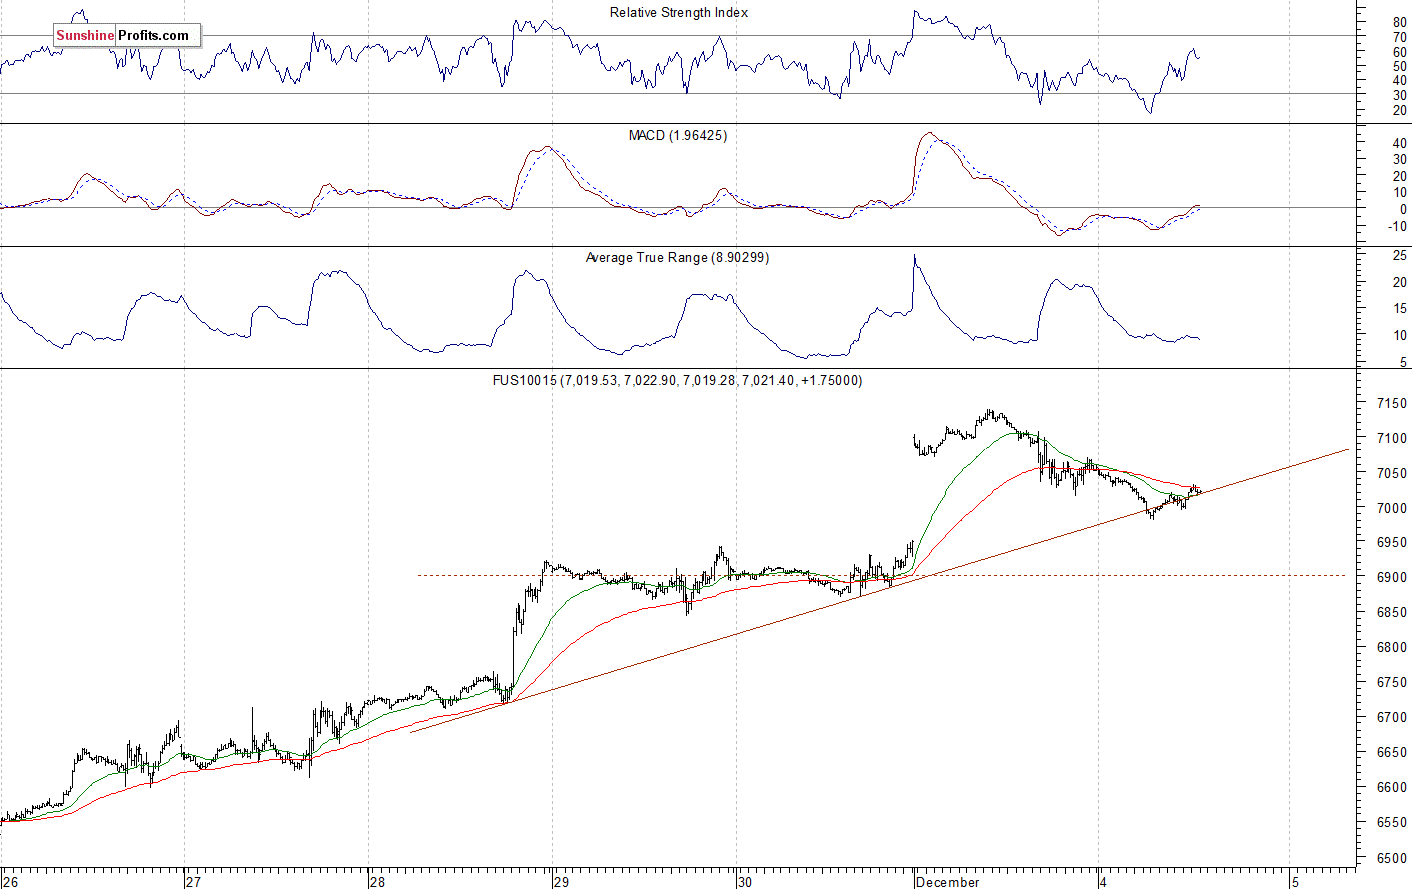
Nasdaq Remains Close to 7,000 Mark
The technology Nasdaq 100 futures contract follows a similar path, as it fluctuates following its yesterday's intraday decline. The market broke above the level of 7,000 and it was the highest since the early November on Monday. The nearest important level of resistance is now at around 7,100-7,150. The next resistance level is at 7,230, marked by the previous local high. On the other hand, the level of support is at 6,950-7,000, among others. The Nasdaq futures contract trades along the short-term upward trend line, as the 15-minute chart shows:
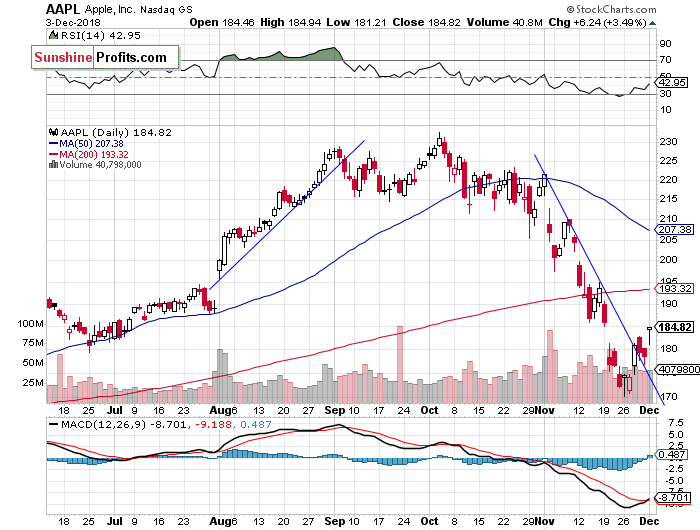
Big Cap Tech Stocks Rallying
Let's take a look at Apple, Inc. stock (AAPL) daily chart (chart courtesy of http://stockcharts.com). The stock accelerated its sell-off in the late November following the earlier breakdown below the support level of $185-190. The market has reached a short-term bottom of around $170-175. It rallied last week, as it closed slightly above the month-long downward trend line. The market confirmed its upward reversal yesterday:
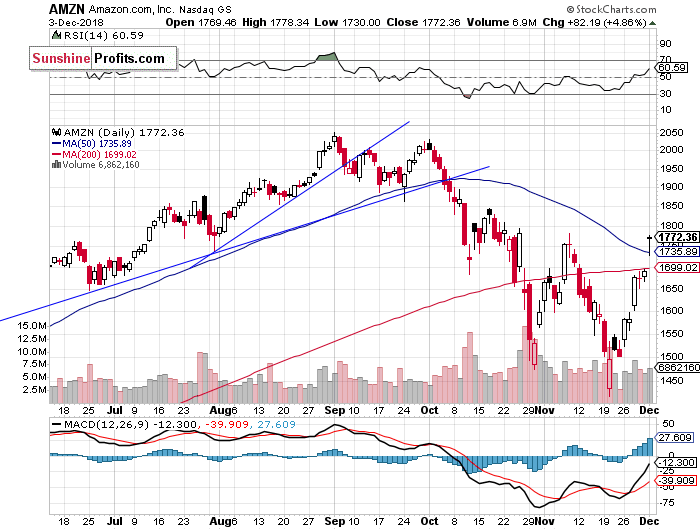
Now let's take a look at Amazon.com, Inc. stock (AMZN) daily chart. It was relatively stronger recently, as it retraced some more of the recent sell-off. Earlier, the stock fell closer to the price of $1,400, before rebounding off the support level. Then the market got back above the resistance level of $1,500, and it accelerated higher last week. The nearest important resistance level remains at $1,800, marked by some previous local highs. The stock reached its early November local high yesterday, as we can see on the daily chart:
Dow Jones Also Higher
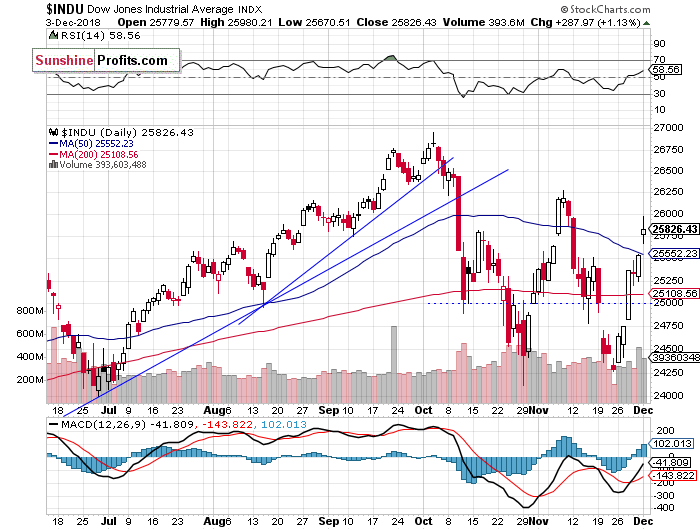
The Dow Jones Industrial Average broke above 25,000 mark last week, as it accelerated its short-term uptrend. The market got back to the resistance level of around 25,500, marked by the mid-November local highs. Now it may continue towards the early November highs of 26,000-26,250. However, it still looks like a volatile consolidation following the October sell-off:
The S&P 500 index continued its short-term uptrend on Monday, as it reached the resistance level of 2,800. For now it looks like an upward correction or an advance within almost two-month long consolidation. However, there have been no confirmed negative signals so far.
Concluding, the S&P 500 index will likely open lower today. We may see another attempts at breaking above 2,800 mark. There may be some more short-term volatility.
Trading position (short-term; our opinion): no positions are justified from the risk/reward perspective.
Thank you.
Paul Rejczak
Stock Trading Strategist
Stock Trading Alerts

