

Briefly:
Intraday trade: The S&P 500 index lost 0.6% on Tuesday, after opening 0.3% lower. The broad stock market will probably open higher today. Then we may see some short-term fluctuations.
Trading position (short-term; our opinion): no positions are justified from the risk/reward perspective.
Our short-term outlook is neutral, and our medium-term outlook is neutral:
Short-term outlook (next 1-2 weeks): neutral
Medium-term outlook (next 1-3 months): neutral
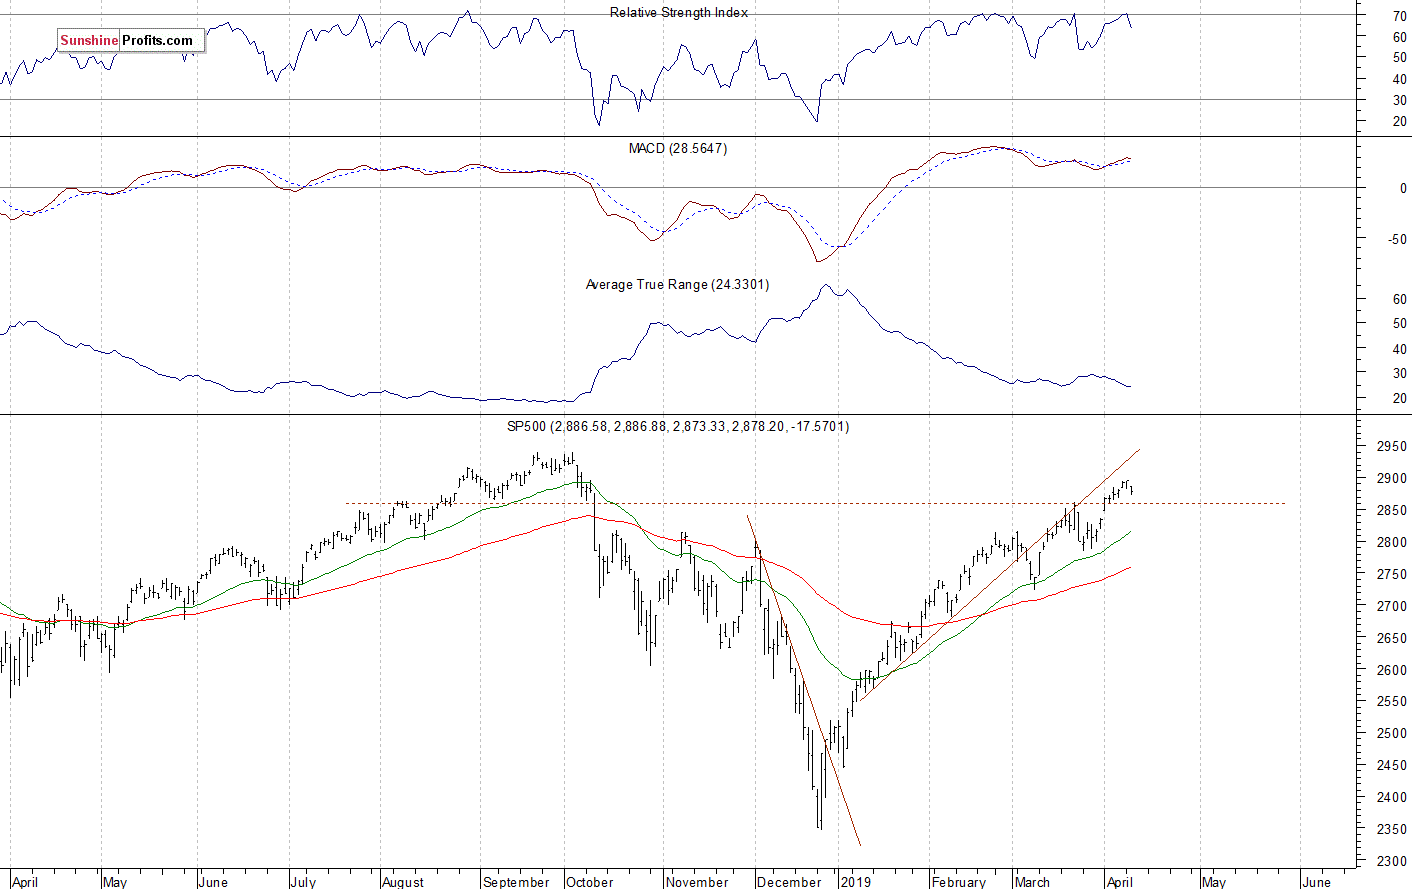
The U.S. stock market indexes lost 0.6-0.7% on Tuesday, as investors took short-term profits off the table following the recent rally. The S&P 500 index retraced more of its October-December downward correction of 20.2% on Monday. The broad stock market's gauge is now 2.1% below September the 21st record high of 2,940.91. The Dow Jones Industrial Average lost 0.7% and the Nasdaq Composite lost 0.6% on Tuesday.
The nearest important resistance level of the S&P 500 index remains at 2,890-2,900, marked by some early October local highs. The next resistance level is at 2,920-2,940, marked by the mentioned record high, among others. On the other hand, the support level is at 2,860-2,865, marked by the recent local lows. The support level is also at 2,835-2,850, marked by the previous Monday’s daily gap up of 2,836.03-2,848.63.
The broad stock market retraced all of its December sell-off and it broke above the medium-term resistance level of around 2,800-2,820, marked by the October-November local highs recently. So is it still just a correction or a new medium-term uptrend? We may see an attempt at getting back to the record high. There have been no confirmed negative medium-term signals so far. The index got closer to its last October all-time high, as we can see on the daily chart:
Positive Expectations This Morning
Expectations before the opening of today's trading session are positive, because the index futures contracts trade 0.2-0.3% above their Tuesday’s closing prices. The European stock market indexes have gained 0.1-0.4% so far. Investors will wait for some economic data announcements: Consumer Price Index at 8:30 a.m., Crude Oil Inventories at 10:30 a.m., the FOMC Meeting Minutes release at 2:00 p.m. The broad stock market will likely fluctuate following the recent rally. There have been no confirmed negative signals so far. However, if the index breaks below the support level of around 2,860, we could see more selling pressure.
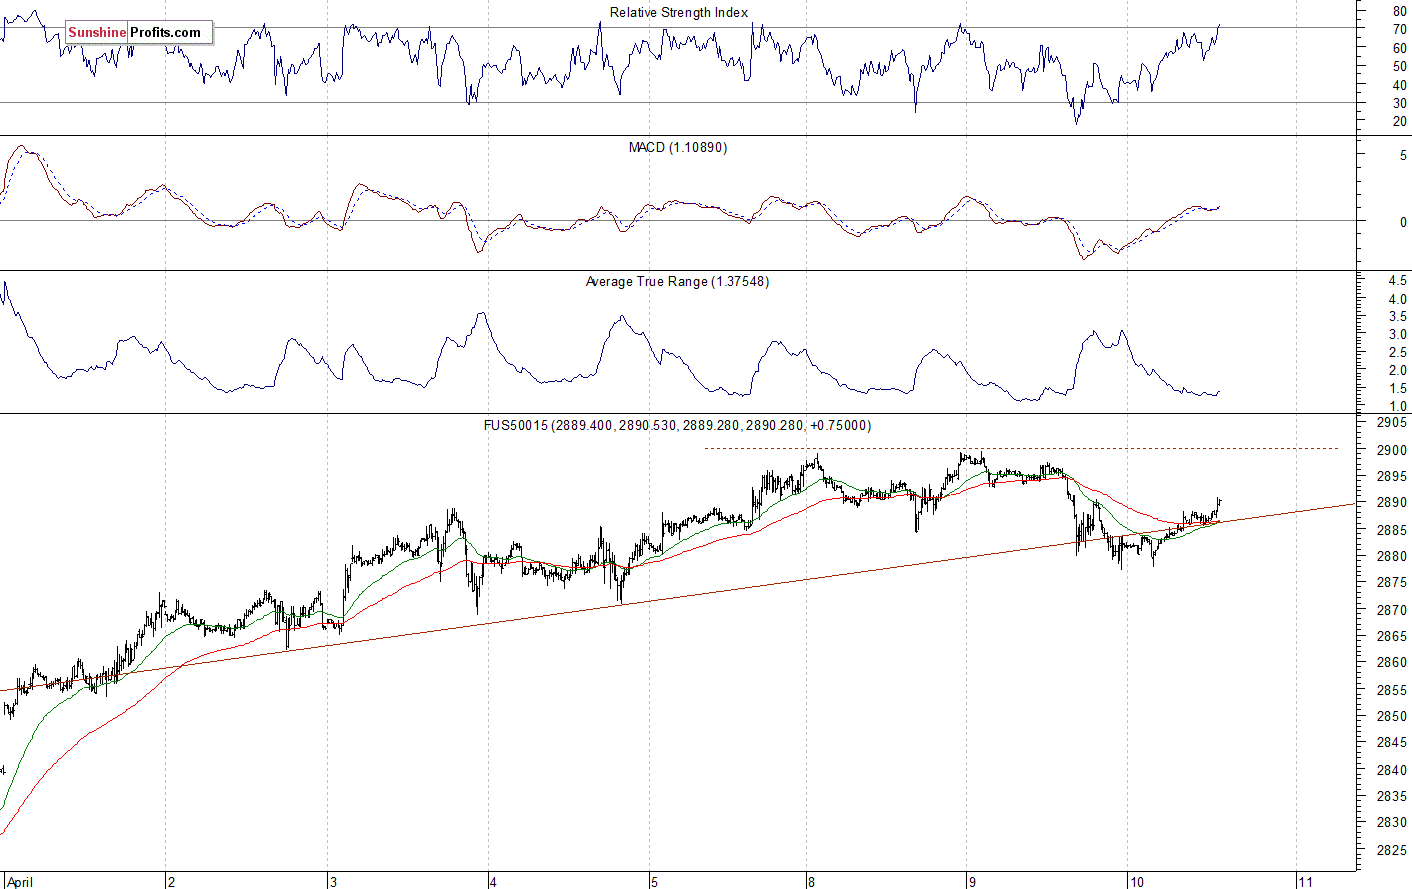
The S&P 500 futures contract trades within an intraday uptrend, as it retraces some of its yesterday’s decline. The nearest important resistance level is at 2,890-2,900. On the other hand, the support level is at 2,875-2,880, among others. The futures contract remains close to the short-term upward trend line, as the 15-minute chart shows:
Nasdaq Also Higher
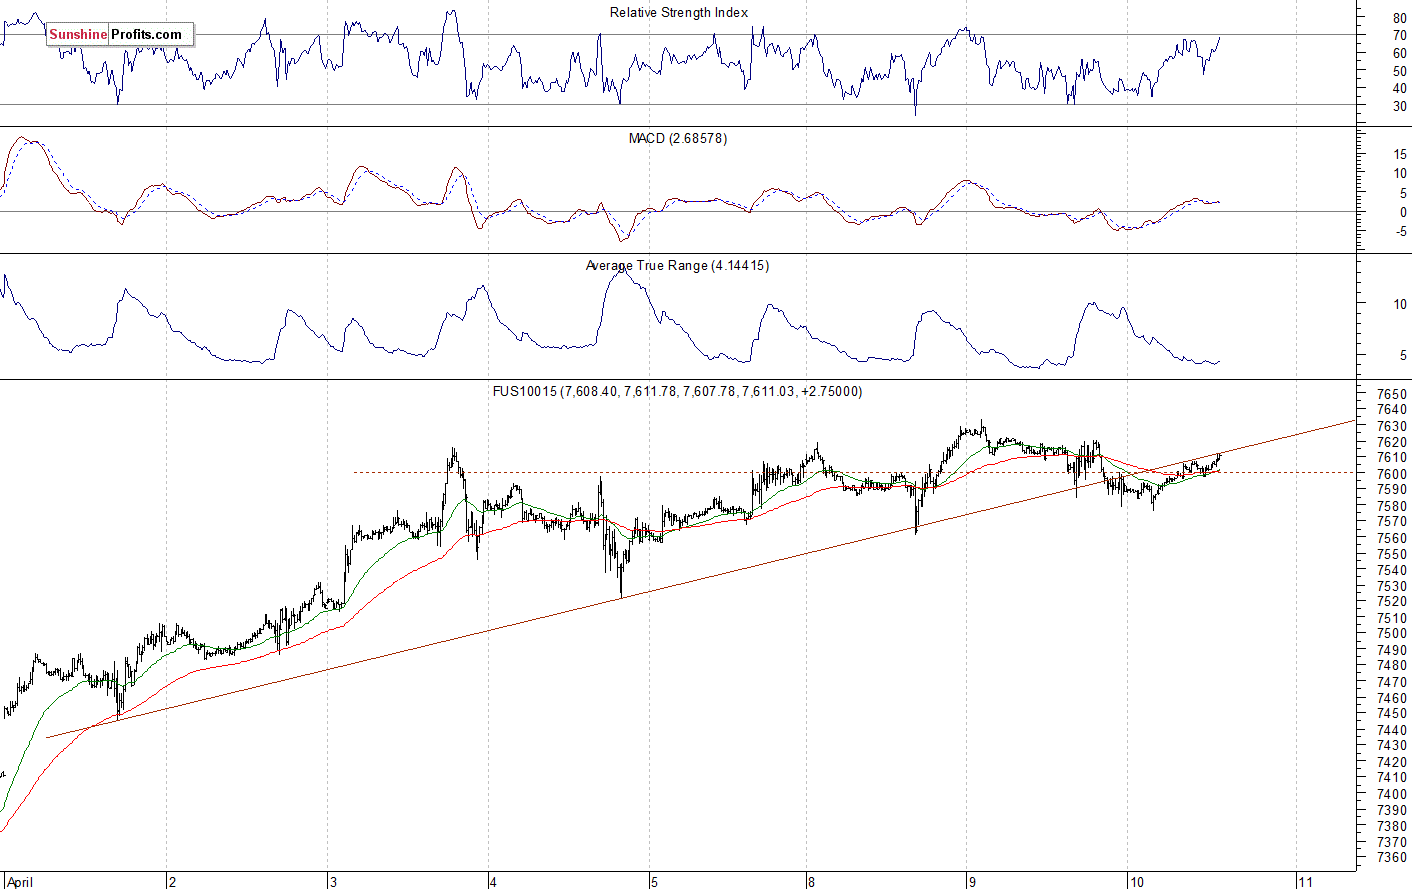
The technology Nasdaq 100 futures contract follows a similar path, as it trades within an intraday uptrend. The market slightly extended its medium-term uptrend on Monday. It has retraced most of the late last year’s sell-off. The nearest important resistance level is now at around 7,600-7,650. On the other hand, the support level is at 7,550. The Nasdaq futures contract extends its short-term consolidation along the local highs, as we can see on the 15-minute chart:
Big Cap Tech Stocks – More Short-Term Uncertainty
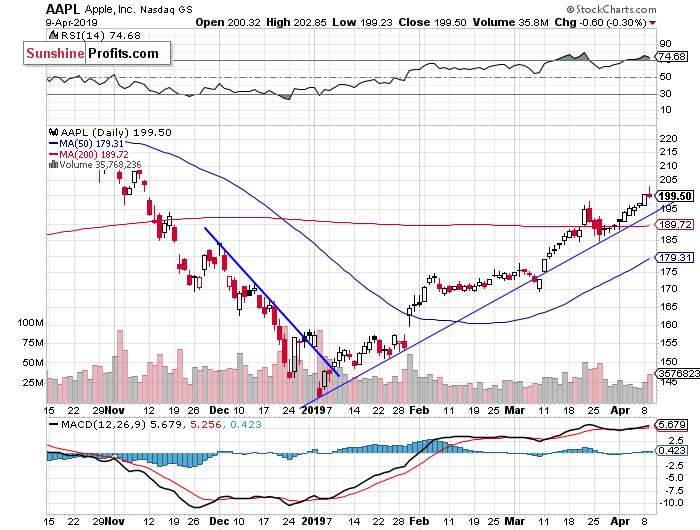
Let's take a look at the Apple, Inc. stock (AAPL) daily chart (chart courtesy of http://stockcharts.com). The stock accelerated its uptrend recently and it broke above the resistance level of $200 yesterday. However, it came back lower before the session’s close. The market continues to trade above the medium-term upward trend line:
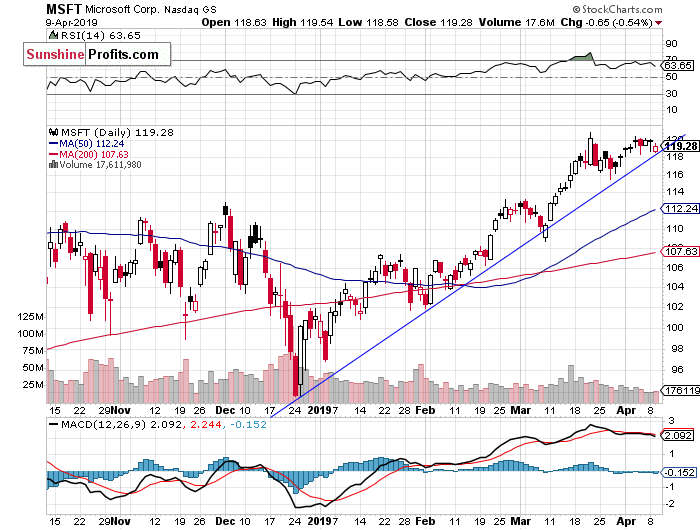
Now let's take a look at the daily chart of Microsoft Corp. (MSFT). The price remains close to the new record high. The resistance level is at around $120. The market continues to trade along its three-month-long upward trend line:
Dow Jones Closer to 26,000 Again
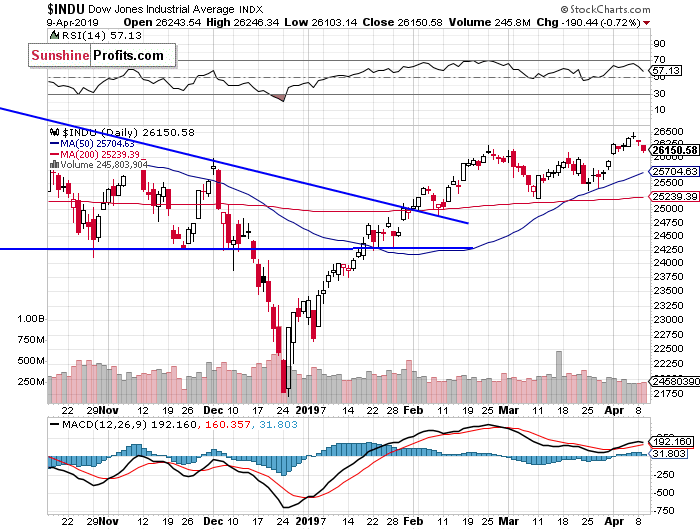
The Dow Jones Industrial Average broke above its February local high last week and it extended the medium-term uptrend. The next resistance level is at around 26,800-27,000, marked by the last year’s topping pattern and the record high of 26,951.8. Yesterday, it retraced its recent advance. For now, it looks like a downward correction:
The S&P 500 index slightly extended its short-term uptrend on Monday, as it got the highest since the early October. But yesterday it retraced some of the advance, after bouncing off a potential 2,900 resistance level. For now, it looks like a short-term downward correction.
Concluding, the S&P 500 index will likely open higher today. Then we may see some more short-term uncertainty following the recent rally.
Trading position (short-term; our opinion): no positions are justified from the risk/reward perspective.
Thank you.
Paul Rejczak
Stock Trading Strategist
Sunshine Profits - Effective Investments through Diligence and Care

