

Trading position (short-term, our opinion; levels for S&P 500 continuous futures contract): No positions are currently justified from the risk/reward point of view.
The S&P 500 index fell very close to its recent local low yesterday. Will the market break below the 4,300 level? It may fluctuate for some time.
The S&P 500 index retraced almost all of its recent advance yesterday, as it extended its short-term downtrend. The index fell 1.2% vs. its Wednesday’s closing price and it got back closer to the 4,300 price level. In the previous week, the market fell the lowest since July 20, as it reached the local low of 4,305.91. The S&P 500 was 239.9 points or 5.28% below the September 2 record high of 4,545.85. And yesterday’s daily low was at 4,306.24. This morning the market is expected to open 0.3-0.4% higher and we may see a short-term consolidation.
The nearest important support level of the broad stock market index is now at 4,300, marked by the mentioned local low. The next support level is at around 4,250. On the other hand, the resistance level is at 4,445-4,455, marked by the recent local lows. The S&P 500 continues to trade below its month-long downward trend line, as we can see on the daily chart (chart by courtesy of http://stockcharts.com):
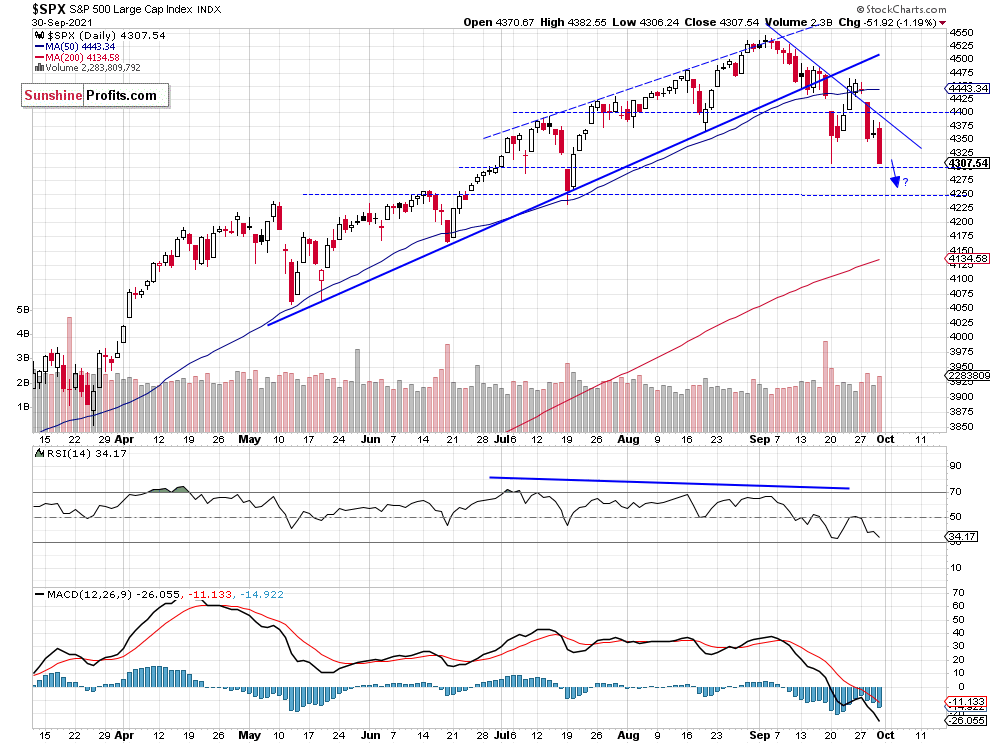
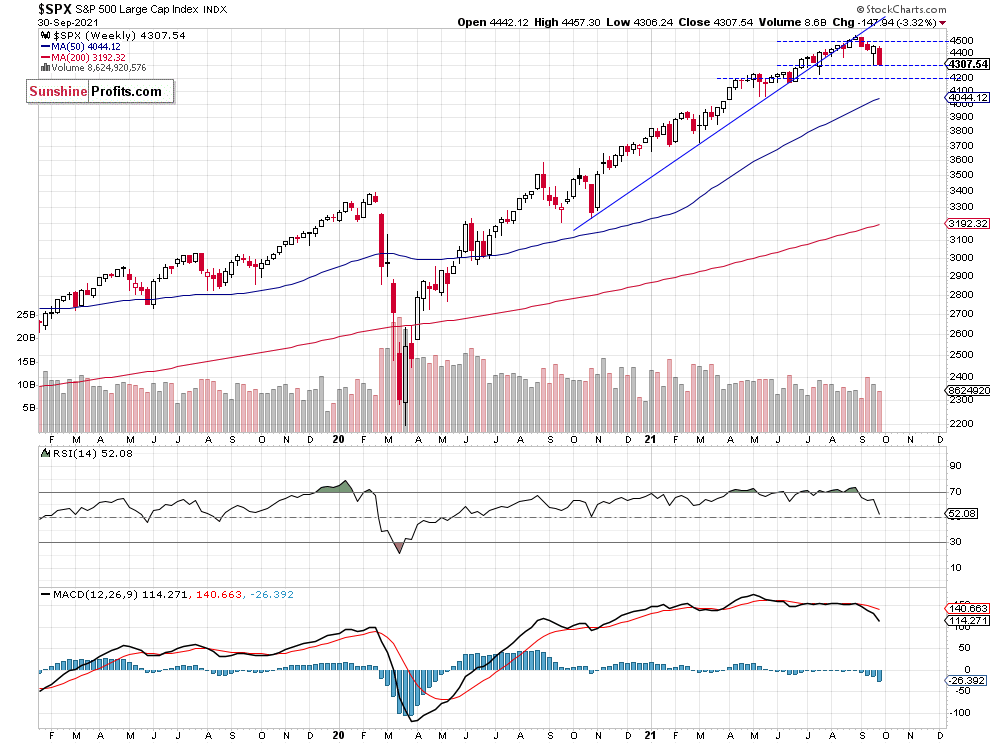
S&P 500 Below Medium-Term Upward Trend Line
The S&P 500 index is trading below its almost year-long upward trend line. The nearest important medium-term support level is at 4,200-4,300, as we can see on the weekly chart:
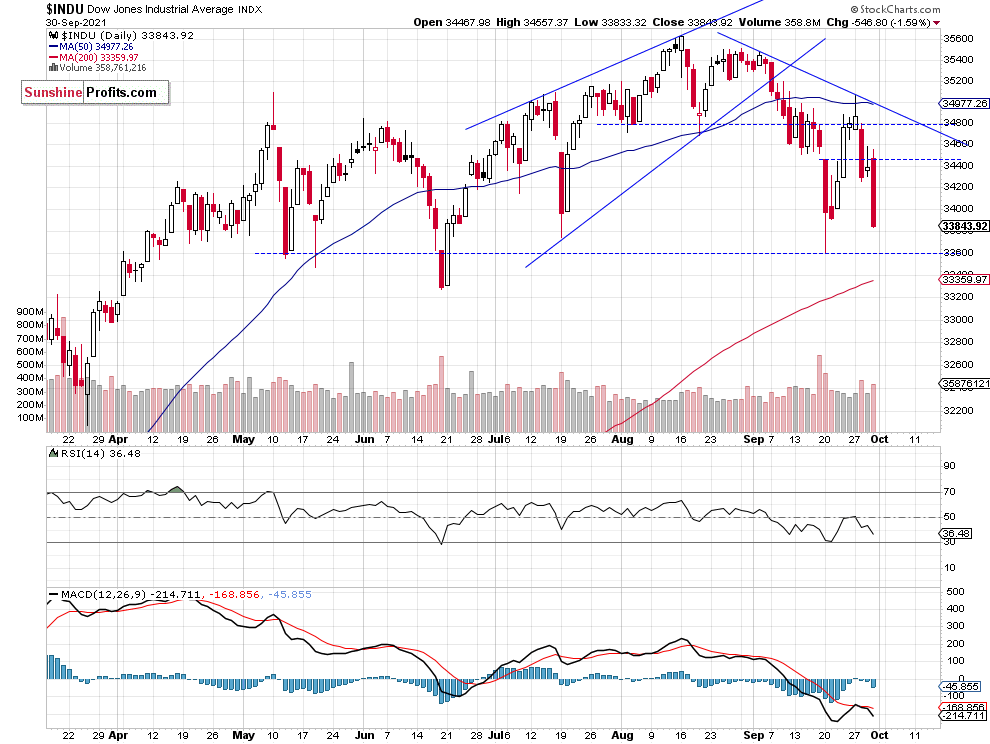
Dow Jones Is Also Closer to the Previous Local lows
Let’s take a look at the Dow Jones Industrial Average chart. In early September the blue-chip index broke below a two-month-long rising wedge downward reversal pattern. Last week it has bounced from the 33,600 price level up to around 35,000. But since Monday it has been declining towards the local low again, as we can see on the daily chart:
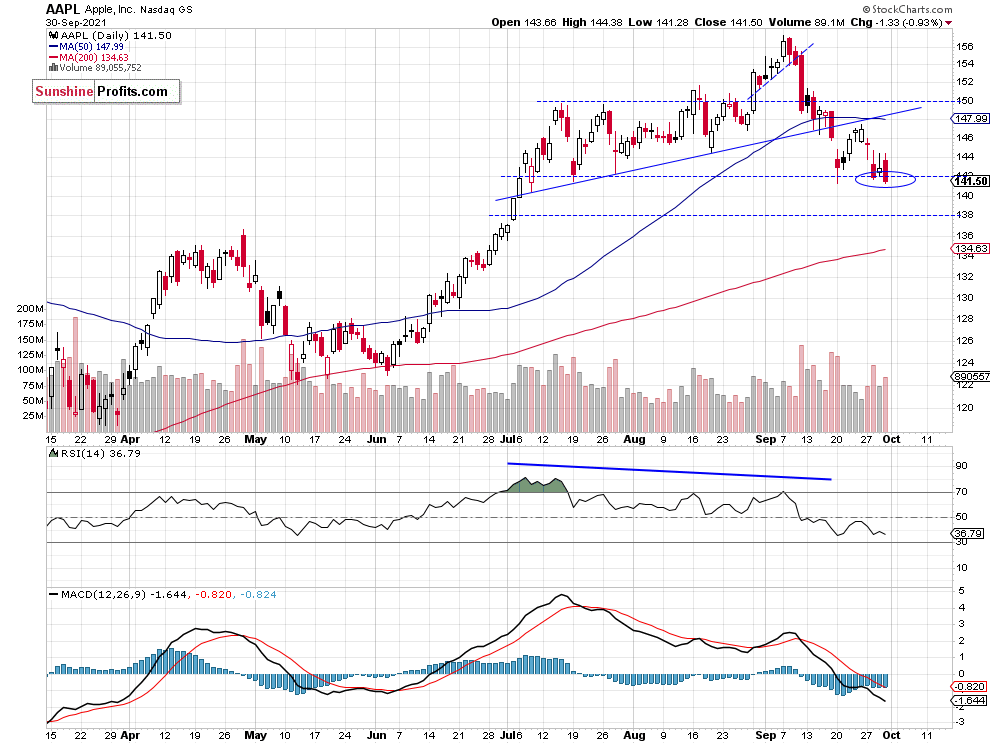
Apple Remains at Support Level
Apple stock weighs around 6.1% in the S&P 500 index, so it is important for the whole broad stock market picture. Since early September it has been declining from the record high. Recently the stock sold off to the previous local lows along $142 price level. It is acting as a support level, so it is still a “make or break” situation.
We Are Closing Our Profitable Short Position!
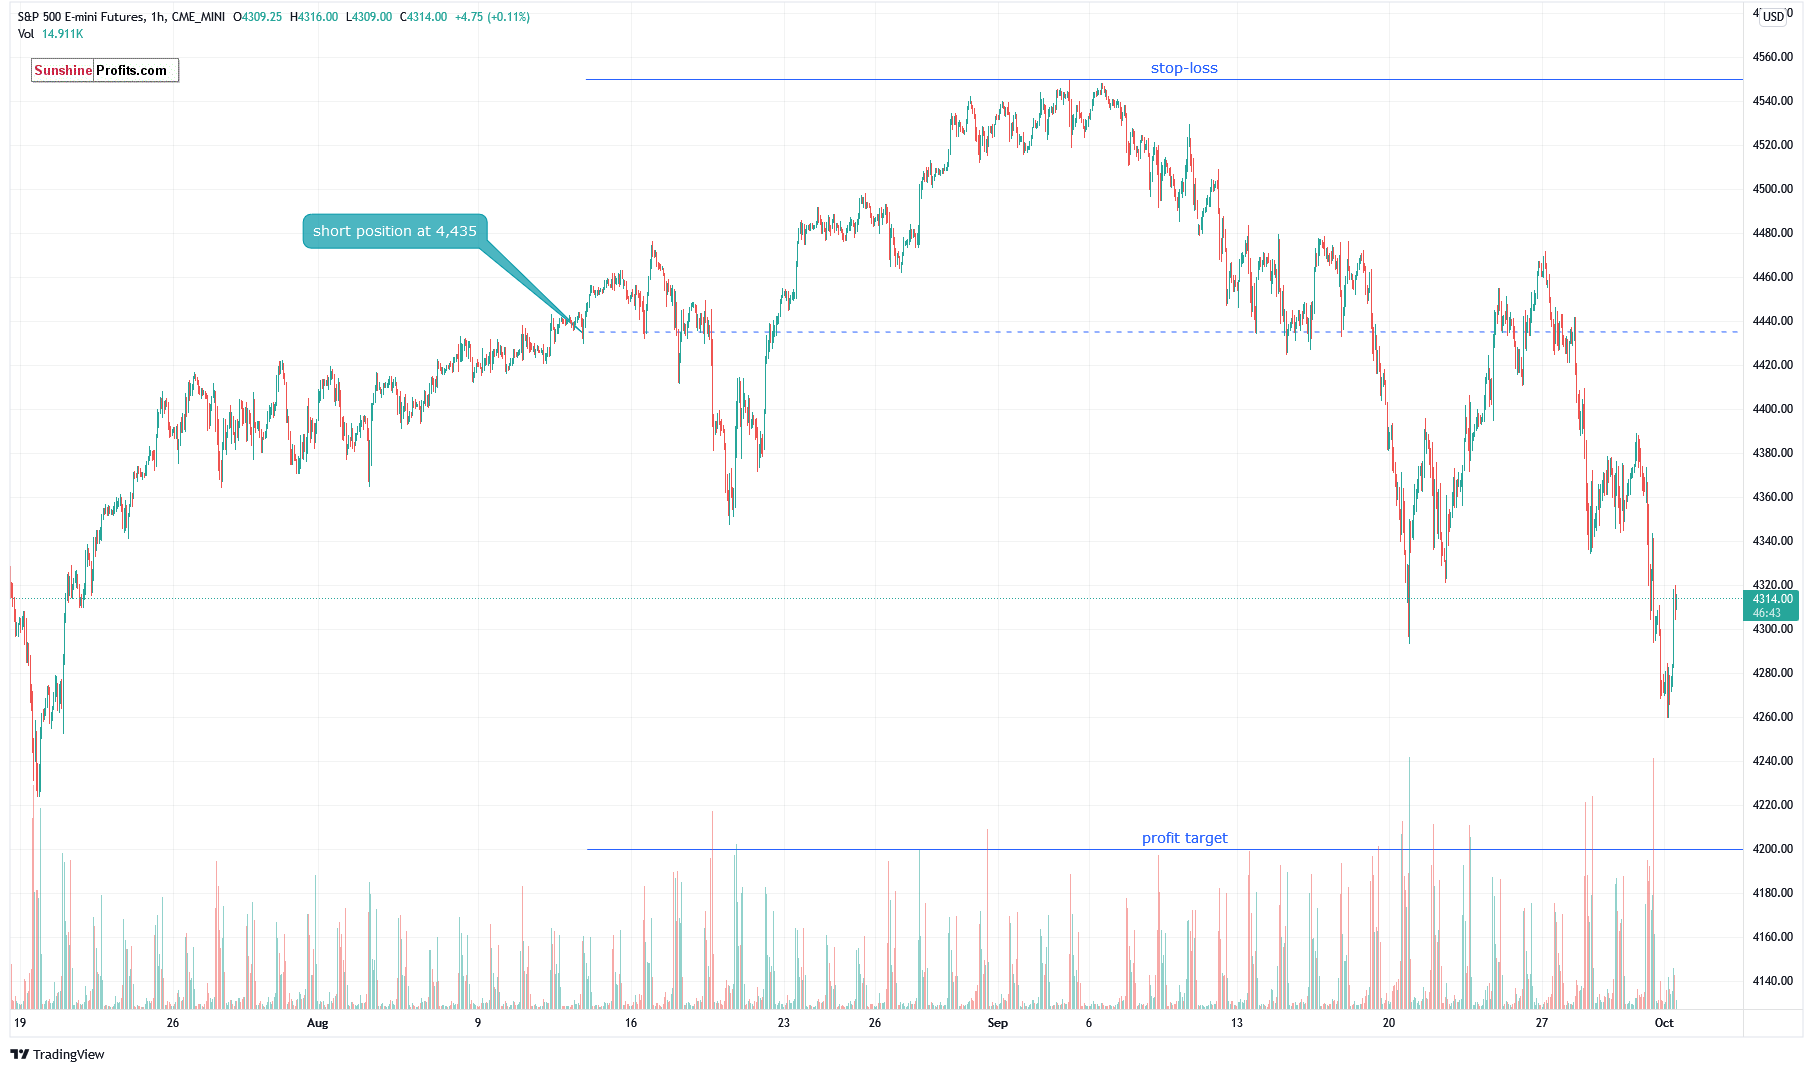
Let’s take a look at the hourly chart of the S&P 500 futures contract. We opened a short position on August 12 at the level of 4,435. It is in profit now and the market is still within a short-term downtrend. However, the risk/reward perspective seems less favorable right now so we decided to close the position at the current market price of 4,315, cashing the gain of 120 points. (chart by courtesy of http://tradingview.com):
Conclusion
Since last Tuesday we’ve witnessed a short-covering rally fueled by the Wednesday’s FOMC Monetary Policy release. But it was just an upward correction within a downtrend and the S&P 500 index’ mid-September short-term consolidation acted as a short-term resistance level. The market fell close to its recent local low. We may see a short-term consolidation at that support level.
There have been no confirmed positive signals so far. However, the risk/reward perspective seems less favorable right now and no positions are currently justified.
Here’s the breakdown:
- The S&P 500 got back to its previous low yesterday and it may act as a short-term support level.
- Our speculative short position has been closed right before the opening of today’s cash market’s trading session.
- However, we are still expecting more downward pressure and a correction to 4,200-4,250 level.
As always, we’ll keep you, our subscribers, well-informed.
Trading position (short-term, our opinion; levels for S&P 500 continuous futures contract): No positions are currently justified from the risk/reward point of view.
Thank you.
Paul Rejczak,
Stock Trading Strategist
Sunshine Profits: Effective Investments through Diligence and Care

