

Briefly:
Intraday trade: The S&P 500 index gained 0.1% on Monday, after opening 0.1% lower. The broad stock market will probably open virtually flat again today. Then we may see some short-term profit-taking action.
Trading position (short-term; our opinion): no positions are justified from the risk/reward perspective.
Our short-term outlook is neutral, and our medium-term outlook is neutral:
Short-term outlook (next 1-2 weeks): neutral
Medium-term outlook (next 1-3 months): neutral
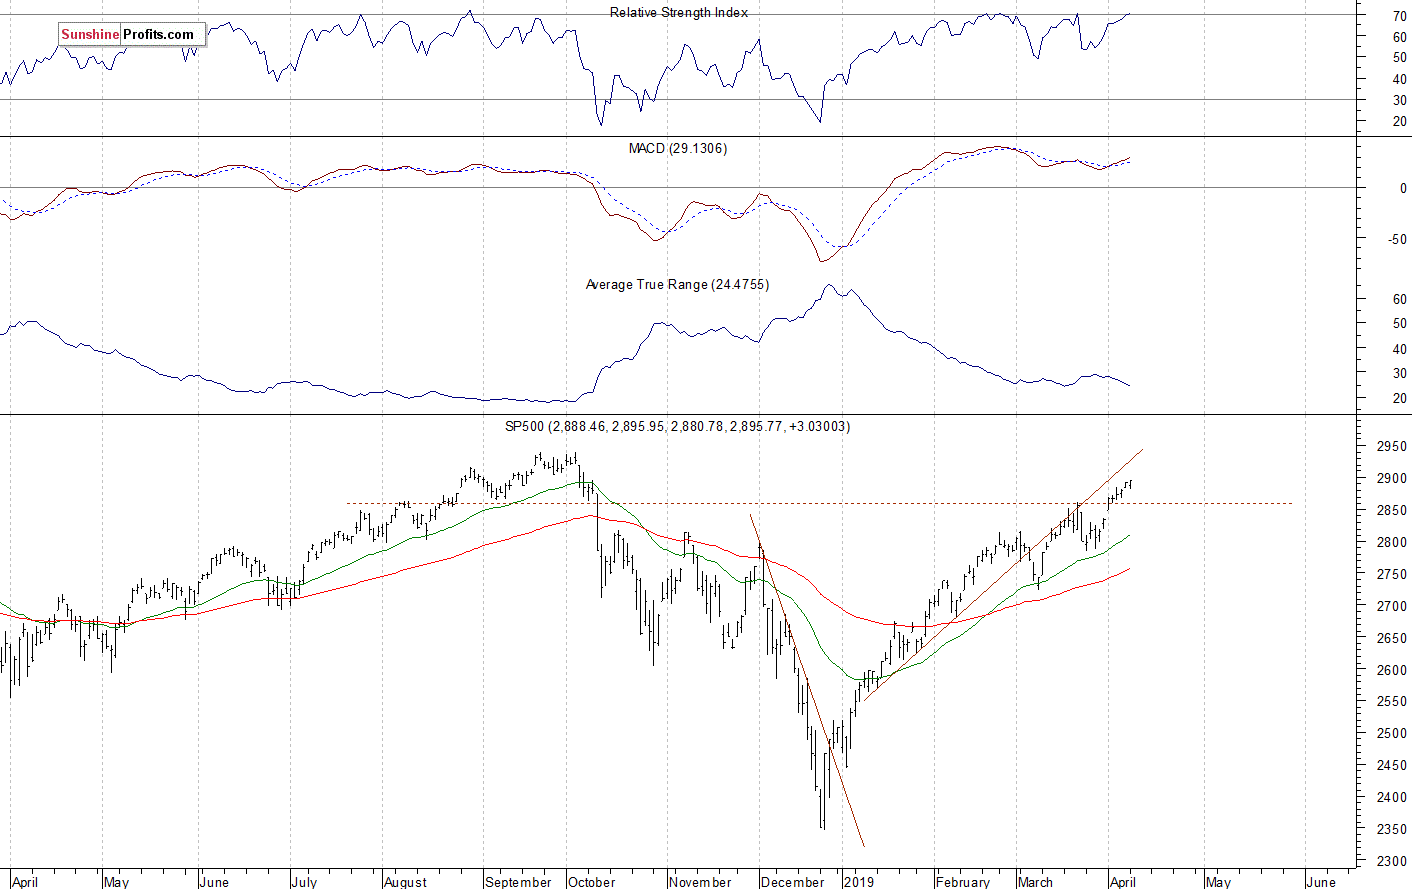
The U.S. stock market indexes were mixed between -0.3% and +0.2% on Monday, as investors hesitated following last week’s advance. The S&P 500 index retraced more of its October-December downward correction of 20.2% yesterday. The broad stock market's gauge is now just 1.5% below September the 21st record high of 2,940.91. The Dow Jones Industrial Average lost 0.3% and the Nasdaq Composite gained 0.2% on Monday.
The nearest important resistance level of the S&P 500 index remains at 2,890-2,900, marked by some early October local highs. The next resistance level is at 2,920-2,940, marked by the mentioned record high, among others. On the other hand, the support level is now at 2,880-2,885, marked by the Friday’s daily gap up of 2,881.28-2,882.99. The support level is also at 2,860-2,865, marked by the recent local lows.
The broad stock market retraced all of its December sell-off and it broke above the medium-term resistance level of around 2,800-2,820, marked by the October-November local highs recently. So is it still just a correction or a new medium-term uptrend? We may see an attempt at getting back to the record high. There have been no confirmed negative medium-term signals so far. The index gets closer to its last October all-time high, as we can see on the daily chart:
Short-Term Consolidation
Expectations before the opening of today's trading session are slightly negative to virtually flat, because the index futures contracts trade between -0.1% and 0.0% vs. their Monday’s closing prices. The European stock market indexes have been mixed so far. Investors will wait for the JOLTS Job Openings number release at 10:00 a.m. The broad stock market will likely continue to fluctuate following the recent rally. We may see a profit-taking action at some point. However, there have been no confirmed negative signals so far.
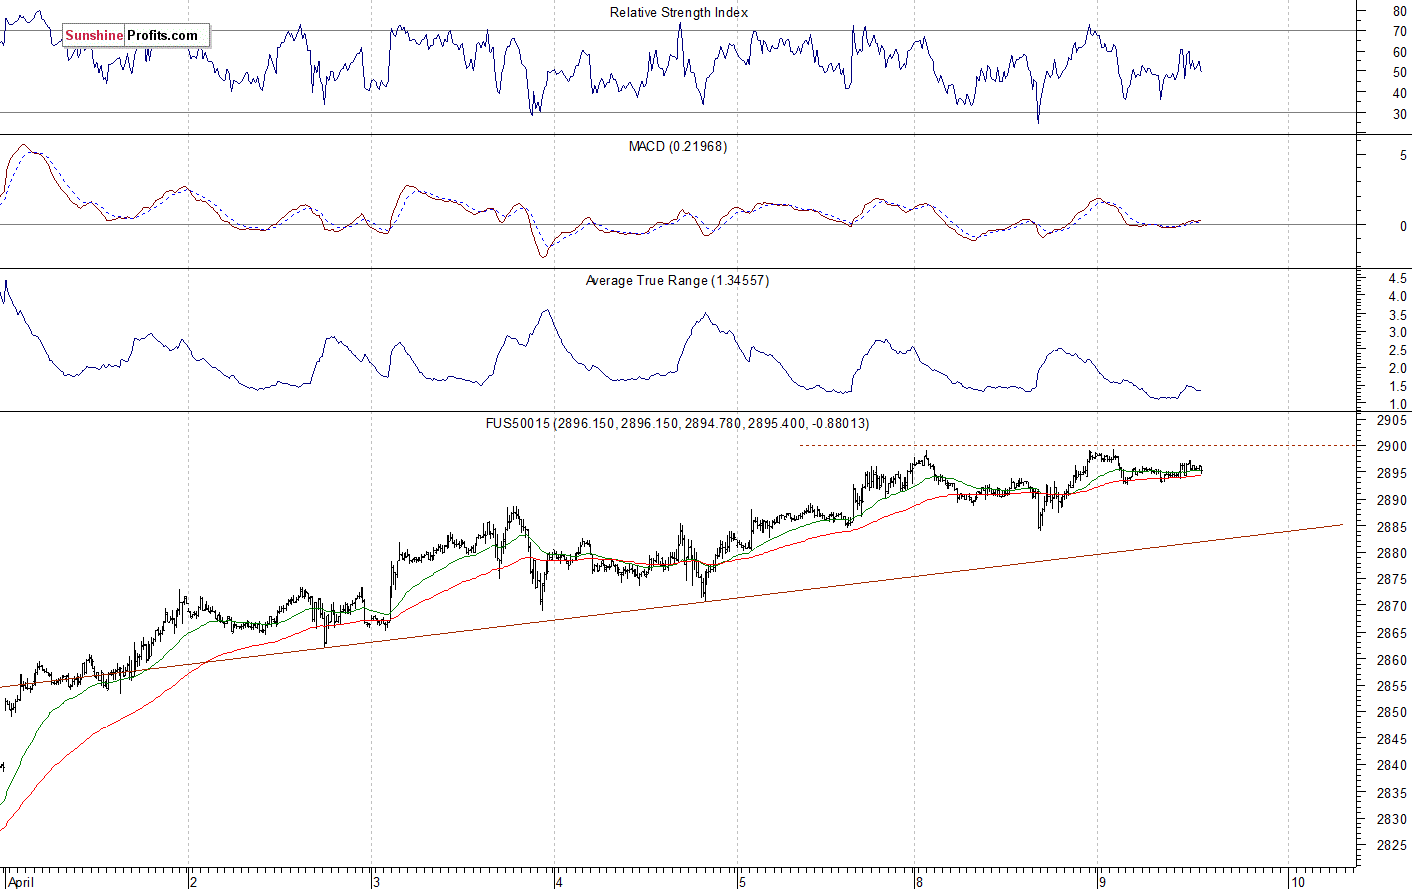
The S&P 500 futures contract trades within an intraday consolidation. The nearest important resistance level is at around 2,895-2,900. On the other hand, the support level is at 2,880-2,885, marked by the recent resistance level. The futures contract is slightly below the 2,900 mark, as the 15-minute chart shows:
Nasdaq Slightly Above 7,600
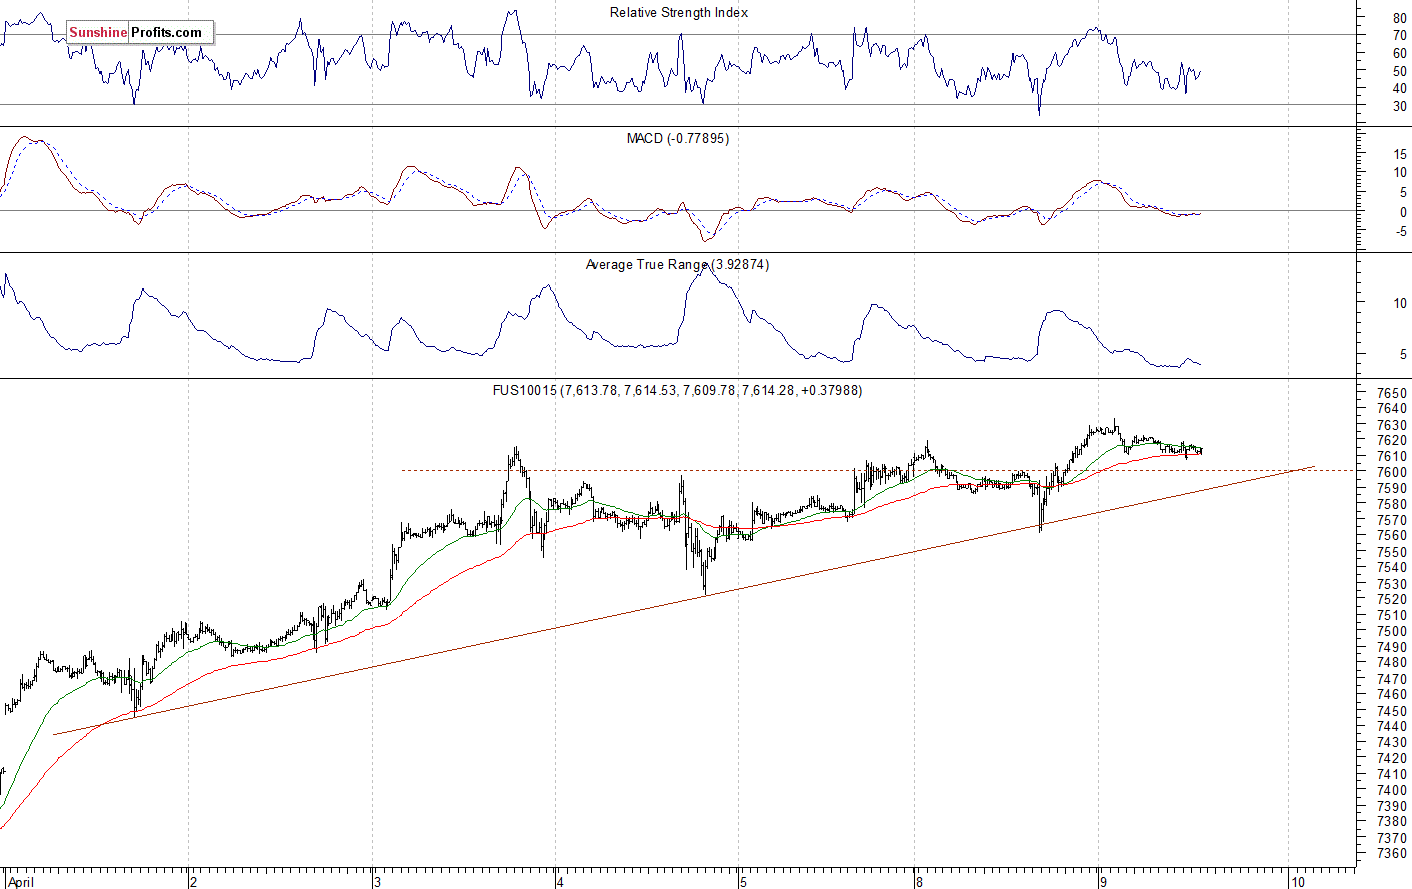
The technology Nasdaq 100 futures contract follows a similar path, as it trades within an intraday consolidation. The market slightly extended its medium-term uptrend yesterday. It has retraced most of the late last year’s sell-off. The nearest important resistance level is at around 7,650. On the other hand, the support level is now at 7,500-7,550. The Nasdaq futures contract remains close to the last Wednesday’s local high, as we can see on the 15-minute chart:
Apple at New Medium-Term High
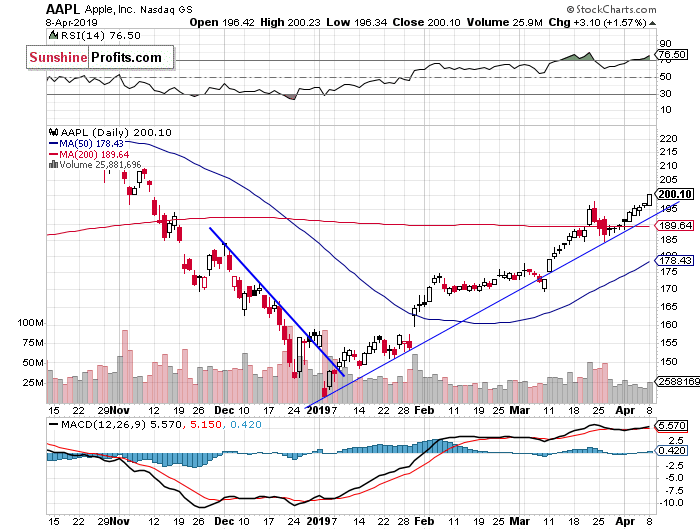
Let's take a look at the Apple, Inc. stock (AAPL) daily chart (chart courtesy of http://stockcharts.com). The stock accelerated the uptrend yesterday and it got close to the resistance level of $200. The market continues to trade above the medium-term upward trend line:
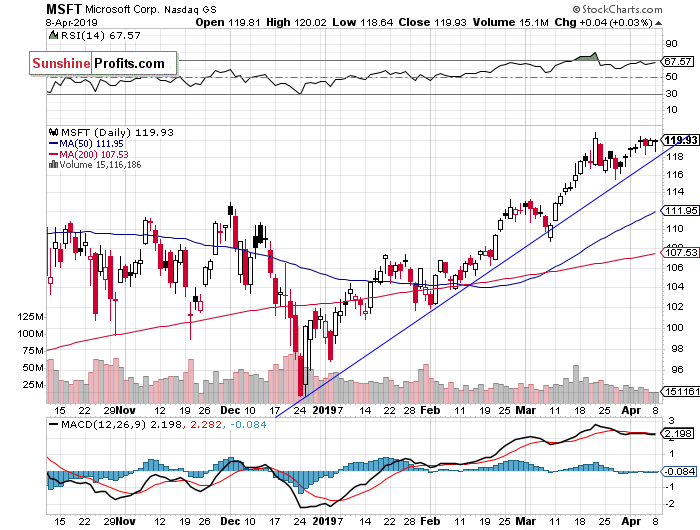
Now let's take a look at the daily chart of Microsoft Corp. (MSFT). The price continues to trade along the new record high. The resistance level is at around $120. The market remains above its three-month-long upward trend line:
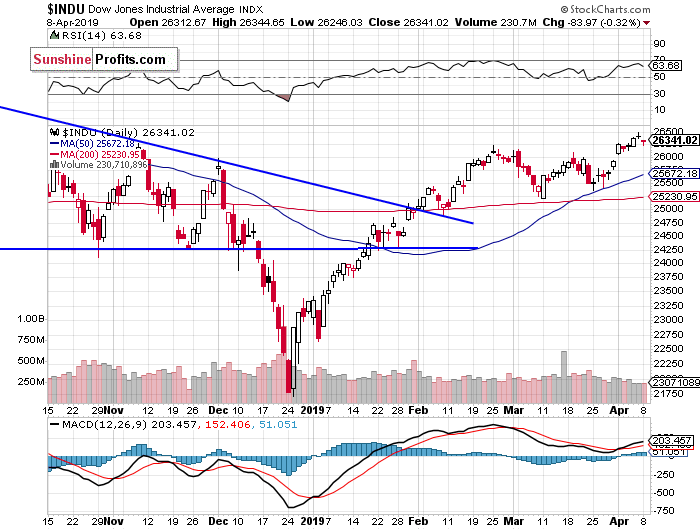
Dow Jones – Uncertainty Following Recent Advance
The Dow Jones Industrial Average broke above its February local high last week and it resumed the medium-term uptrend. The next resistance level is at around 26,800-27,000, marked by the last year’s topping pattern and the record high of 26,951.8:
The S&P 500 index slightly extended its short-term uptrend yesterday, as it got the highest since the early October. We wrote that the recent consolidation looked like a relatively flat correction within a three-month-long uptrend. And we were right. But will the market reach its last year’s record high? There may be some uncertainty, as the S&P 500 gets closer to the 2,900 resistance level.
Concluding, the S&P 500 index will likely open slightly lower today. We may see some profit-taking action following the recent rally. But there have been no confirmed negative signals so far.
Trading position (short-term; our opinion): no positions are justified from the risk/reward perspective.
Thank you.
Paul Rejczak
Stock Trading Strategist
Sunshine Profits - Effective Investments through Diligence and Care

