

Briefly:
Intraday trade: The S&P 500 lost 0.3% on Thursday, after opening 0.3% lower. The market will probably open virtually flat to slightly higher today. Then we may see some more short-term fluctuations following the recent rally.
Trading position (short-term; our opinion): no positions are justified from the risk/reward perspective.
Our short-term outlook is neutral, and our medium-term outlook is neutral:
Short-term outlook (next 1-2 weeks): neutral
Medium-term outlook (next 1-3 months): neutral
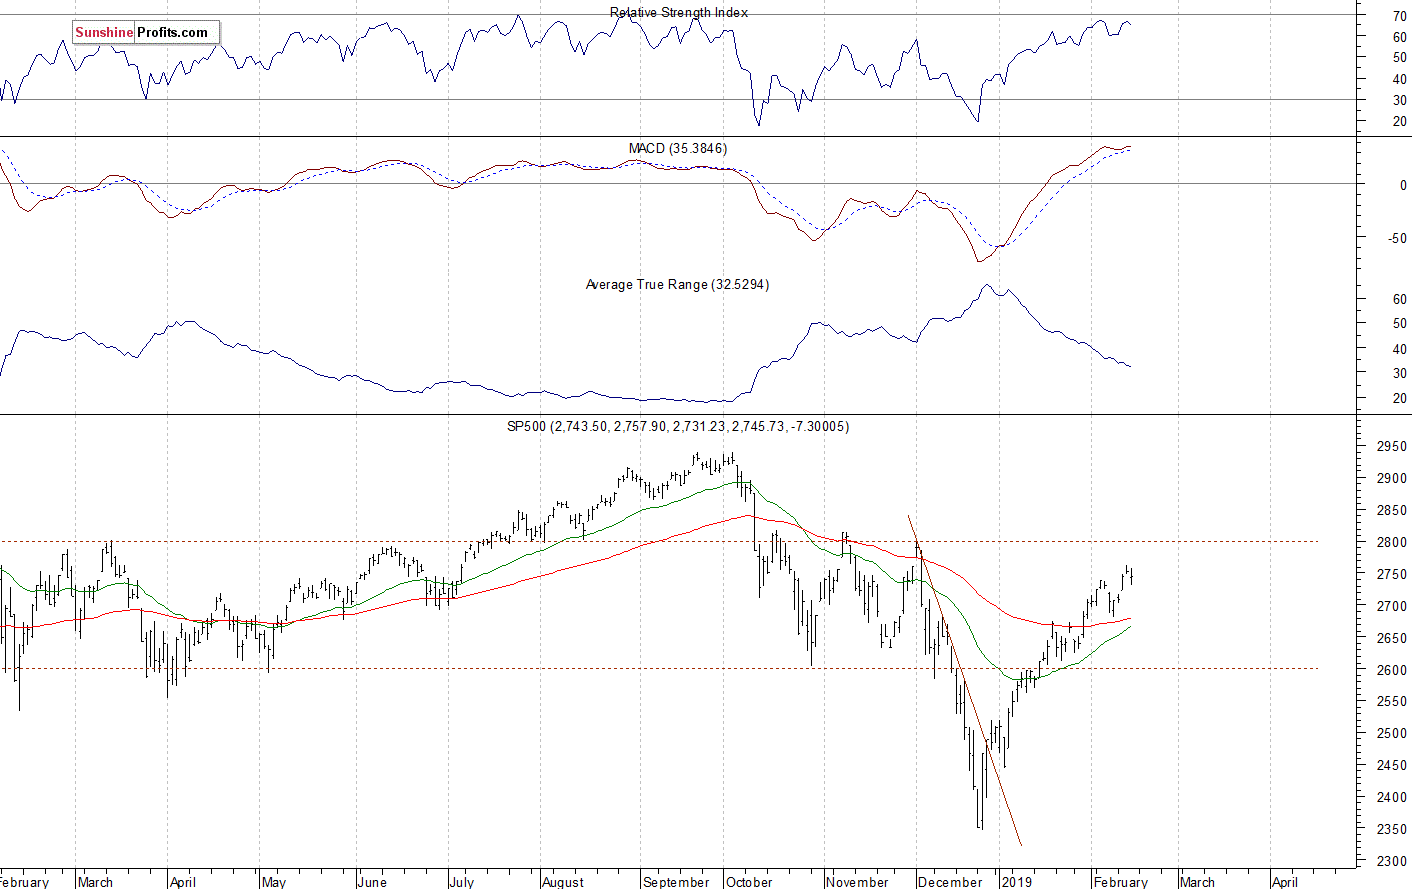
The U.S. stock market indexes were mixed between -0.4% and +0.1% on Thursday, as investors took some short-term profits off the table following the recent rally. The S&P 500 index retraced more of its October-December downward correction of 20.2% (2,713.88) recently. It got closer to the previous local highs along the 2,800 level. The Dow Jones Industrial Average lost 0.4% and the Nasdaq Composite gained 0.1% yesterday.
The nearest important resistance level of the S&P 500 index remains at around 2,785-2,800, marked by the previous medium-term local highs. On the other hand, the support level is at 2,720, marked by the Tuesday's daily gap up of 2,718.05-2,722.61. The support level is also at 2,680-2,700.
The broad stock market broke below its two-month-long trading range in the mid-December, as the S&P 500 index fell below the level of 2,600. Then the market accelerated lower and it broke below the 2,400 mark. Since then, it has retraced more than 61.8% of the whole decline off the September high. The index got closer to its October-November local highs and the resistance level of 2,800 recently, as we can see on the daily chart:
Short-Term Consolidation
Expectations before the opening of today's trading session are virtually flat to slightly higher, because the index futures contracts trade 0.1% above their yesterday's closing prices. The European stock market indexes have gained 0.4-1.2% so far. Investors will wait for some economic data announcements today: Empire State Manufacturing Index at 8:30 a.m., Industrial Production, Capacity Utilization Rate at 9:15 a.m., Michigan Sentiment number at 10:00 a.m. The broad stock market will likely continue to fluctuate following the recent advance. We may see some uncertainty, as the market remains close to the medium-term resistance level.
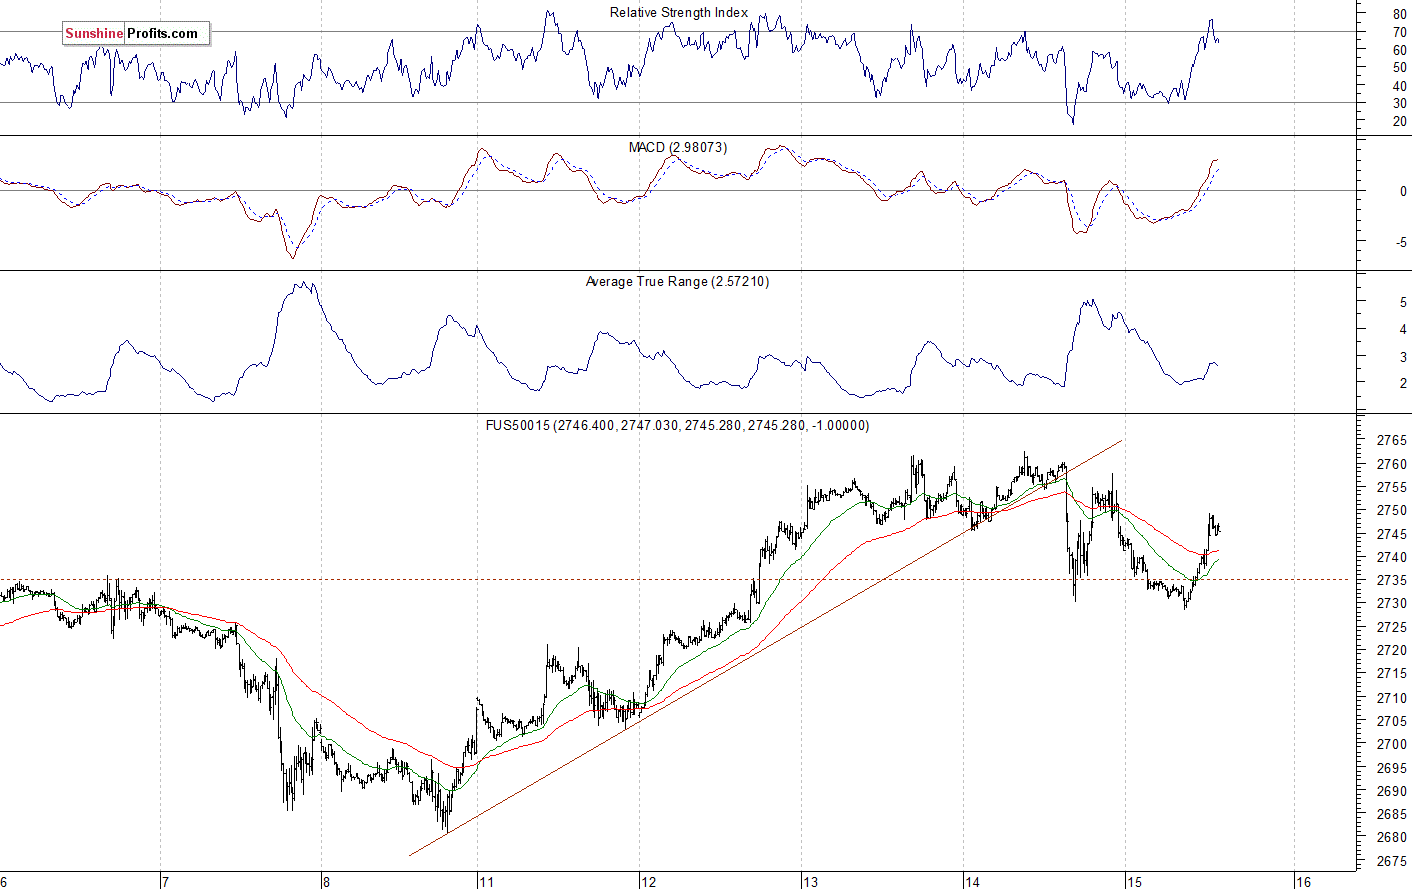
The S&P 500 futures contract trades within an intraday uptrend, as it retraces some of its yesterday's decline. The nearest important level of resistance is at around 2,760-2,765, marked by the short-term local highs. On the other hand, the support level is at 2,725--2,735, among others. The futures contract gets closer to the short-term local highs again, as the 15-minute chart shows:
Nasdaq Fluctuates Along 7,000
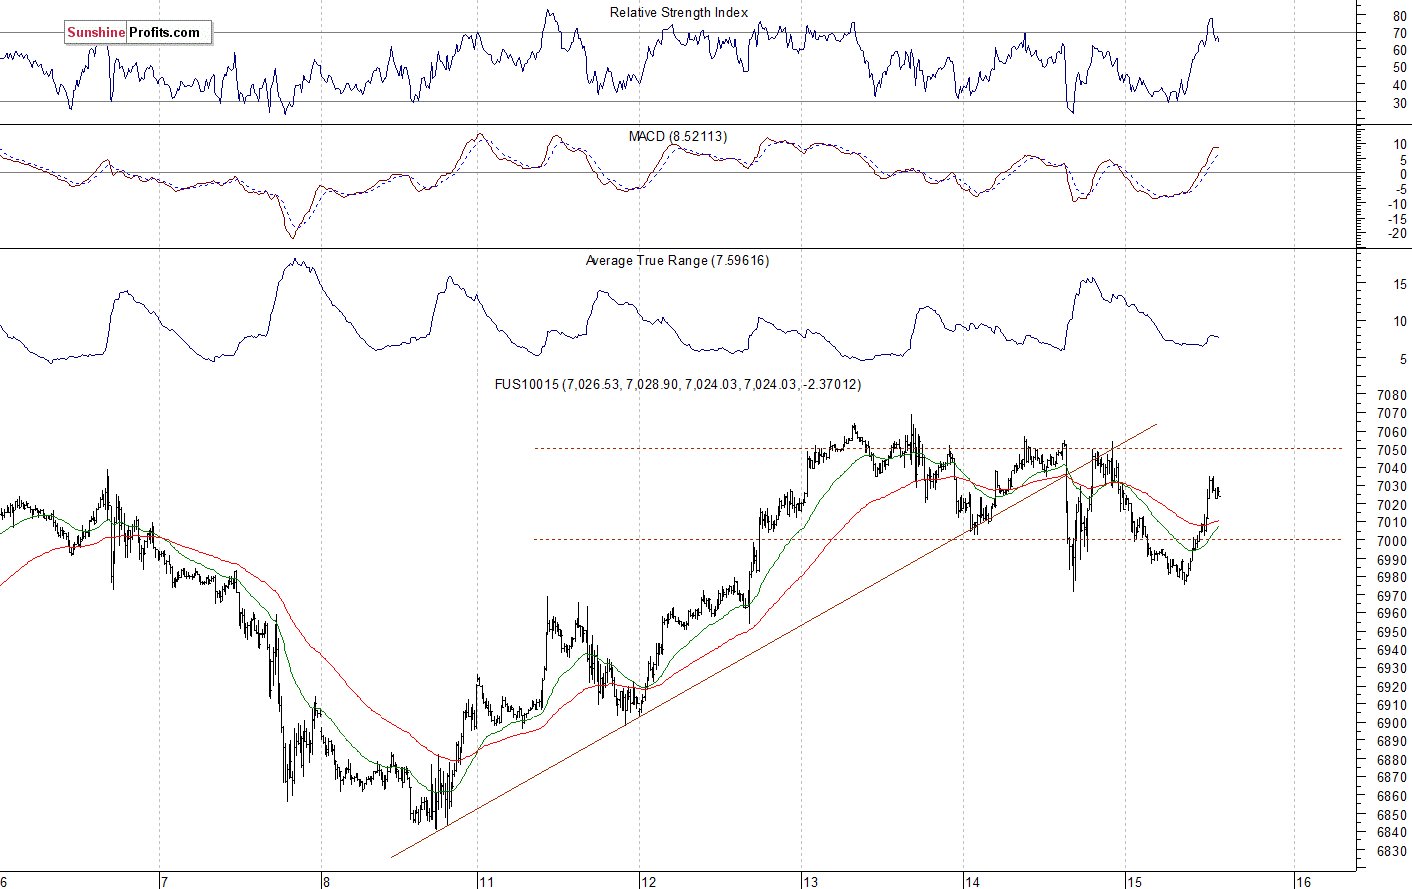
The technology Nasdaq 100 futures contract follows a similar path, as it retraces its yesterday's decline. The market gained almost 1,250 points from December the 26th local low of around 5,820. The nearest important resistance level is now at 7,050-7,150. The support level is at 6,950-7,000, among others. The Nasdaq futures contract continues to trade within a three-day-long consolidation, as we can see on the 15-minute chart:
Apple, Amazon Still Going Sideways
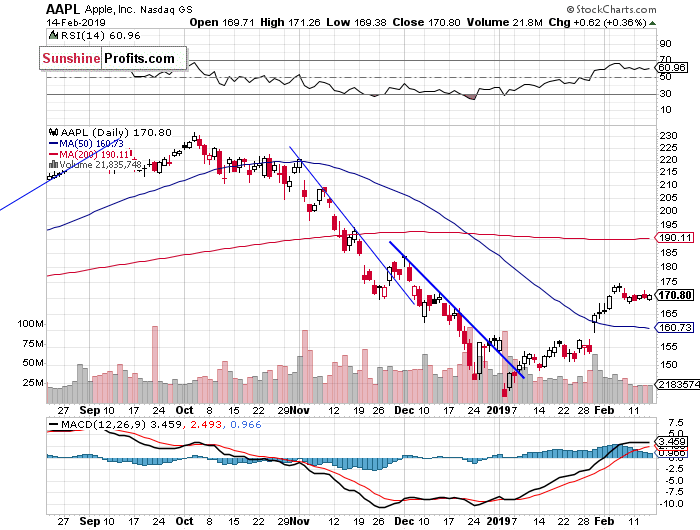
Let's take a look at the Apple, Inc. stock (AAPL) daily chart (chart courtesy of http://stockcharts.com). Apple released its quarterly earnings recently. Then the stock broke above the recent trading range and the resistance level of $155-160. It retraced some more of its November-December sell-off. But on Thursday a week ago it bounced off $175, retracing some of the recent advance. For now, it still looks like a short-term downward correction:
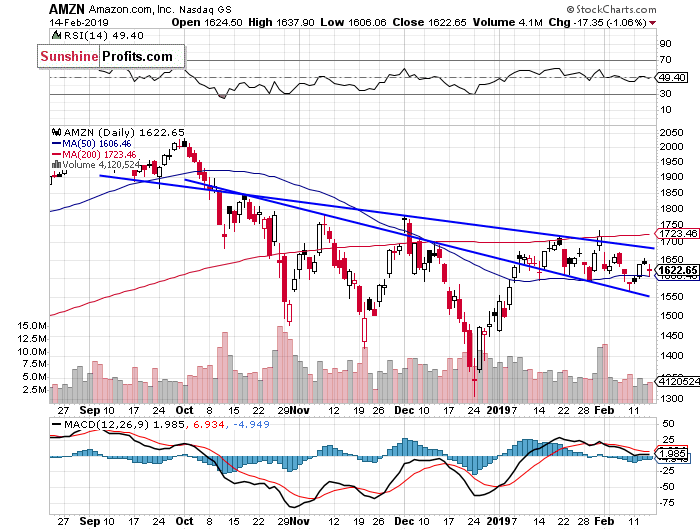
Now let's take a look at the daily chart of Amazon.com, Inc. (AMZN). The market broke above one of its three-month-long downward trend lines a month ago. Since then it has been going sideways. There is a resistance level at around $1,700-1,750. Recently it bounced off that resistance level following quarterly earnings release. This week the stock got closer to the downward trend line again, but then it came back slightly lower yesterday:
Dow Jones Remains Close to Local High
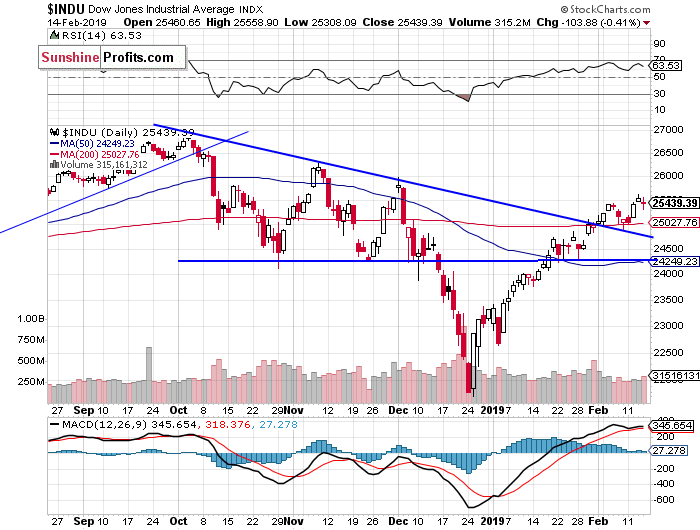
The Dow Jones Industrial Average remained close the new short-term local high and the resistance level of 25,500-26,000 yesterday. Will the blue-chip stocks' gauge continue higher and reach its record high? Or reverse lower in the near term? There have been no confirmed negative signals so far:
The S&P 500 index broke above its recent local high this week, as it got close to the 2,750 mark. Is this a new medium-term uptrend or still just upward correction before another medium-term leg lower? The market trades above the 61.8% Fibonacci retracement of the whole medium-term decline. There have been no confirmed negative signals so far.
Concluding, the S&P 500 index will likely open virtually flat to slightly higher today. We may see another attempt at extending the uptrend. However, there are some short-term technical overbought conditions.
Trading position (short-term; our opinion): no positions are justified from the risk/reward perspective.
Thank you.
Paul Rejczak
Stock Trading Strategist
Sunshine Profits - Effective Investments through Diligence and Care

