

Trading position (short-term, our opinion; levels for S&P 500 continuous futures contract): short positions with entry at 4,540 price level, with 4,630 as a stop-loss and 4,400 as a price target.
The S&P 500 index reached yet another new record high on Friday, but it was virtually flat on the close. Is this a short-term topping pattern?
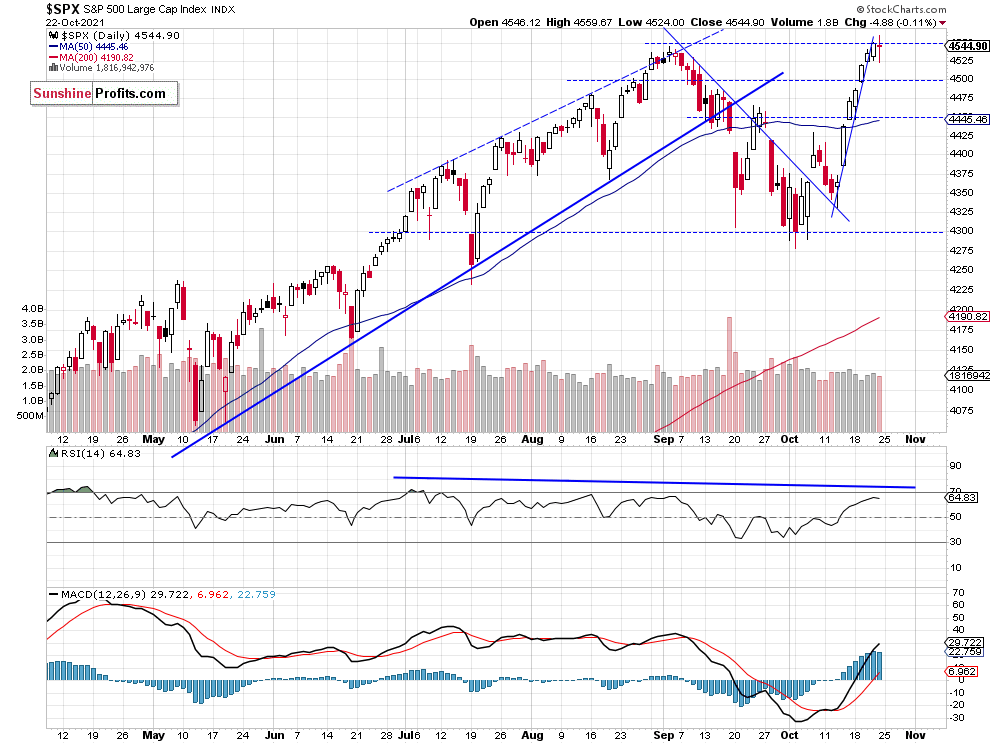
The S&P 500 index lost 0.11% on Friday, Oct. 22 after reaching the new record high level of 4,559.67. The stock market is reacting to quarterly corporate earnings releases and they’ve only started to gain traction last week. Today we will get the release from FB, tomorrow from AMD, GOOG, MSFT, on Wednesday from BA, KO, EBAY and on Thursday from AMZN, among others. However, the market seems overbought in the short-term and we may see a consolidation or a downward correction in the near term.
The nearest important support level is at 4,520-4,525, marked by the last Wednesday’s daily gap up of 4,520.40-4,524.40. The support level is also at 4,485-4,500, marked by the last Tuesday’s daily gap up of 4,488.75-4,496.41 and the previous resistance level. On the other hand, the resistance level is at around 4,550-4,560. The S&P 500 broke below a very steep week-long upward trend line, as we can see on the daily chart (chart by courtesy of http://stockcharts.com):
Nasdaq Is Relatively Weaker, a Warning Sign
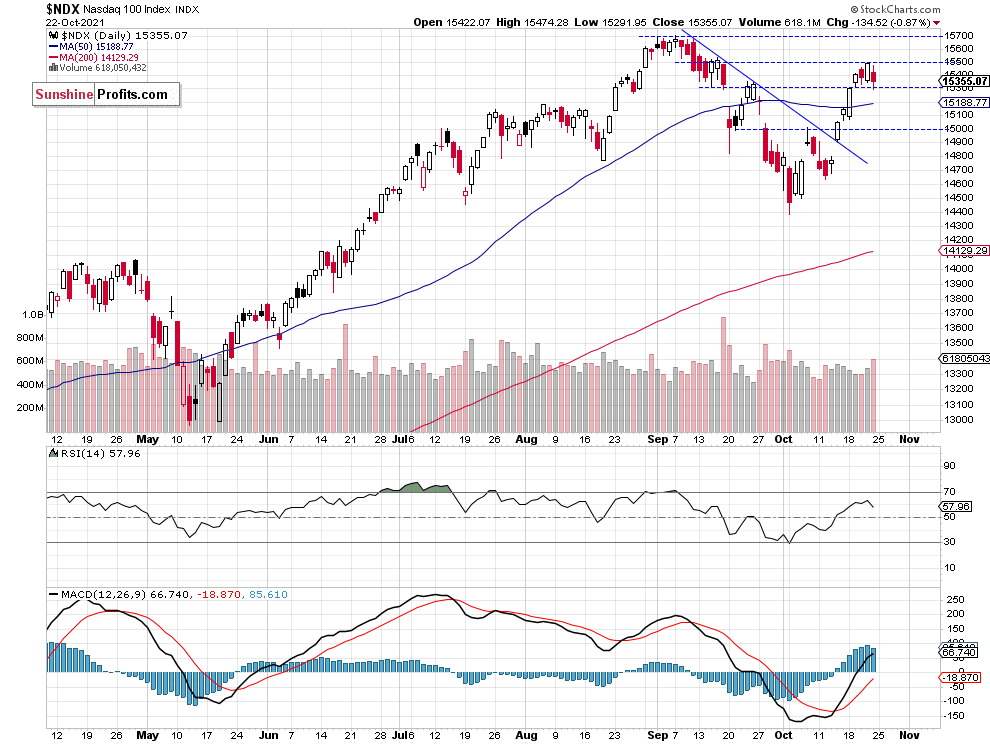
Let’s take a look at the Nasdaq 100 chart. The technology index remains relatively weaker than the broad stock market, as it is still trading well below the early September record high of 15,701.40. On Friday it lost 0.9%. The nearest important resistance level is at 15,500, and the support level is at 15,300, as we can see on the daily chart:
Is a Short Position Justified?
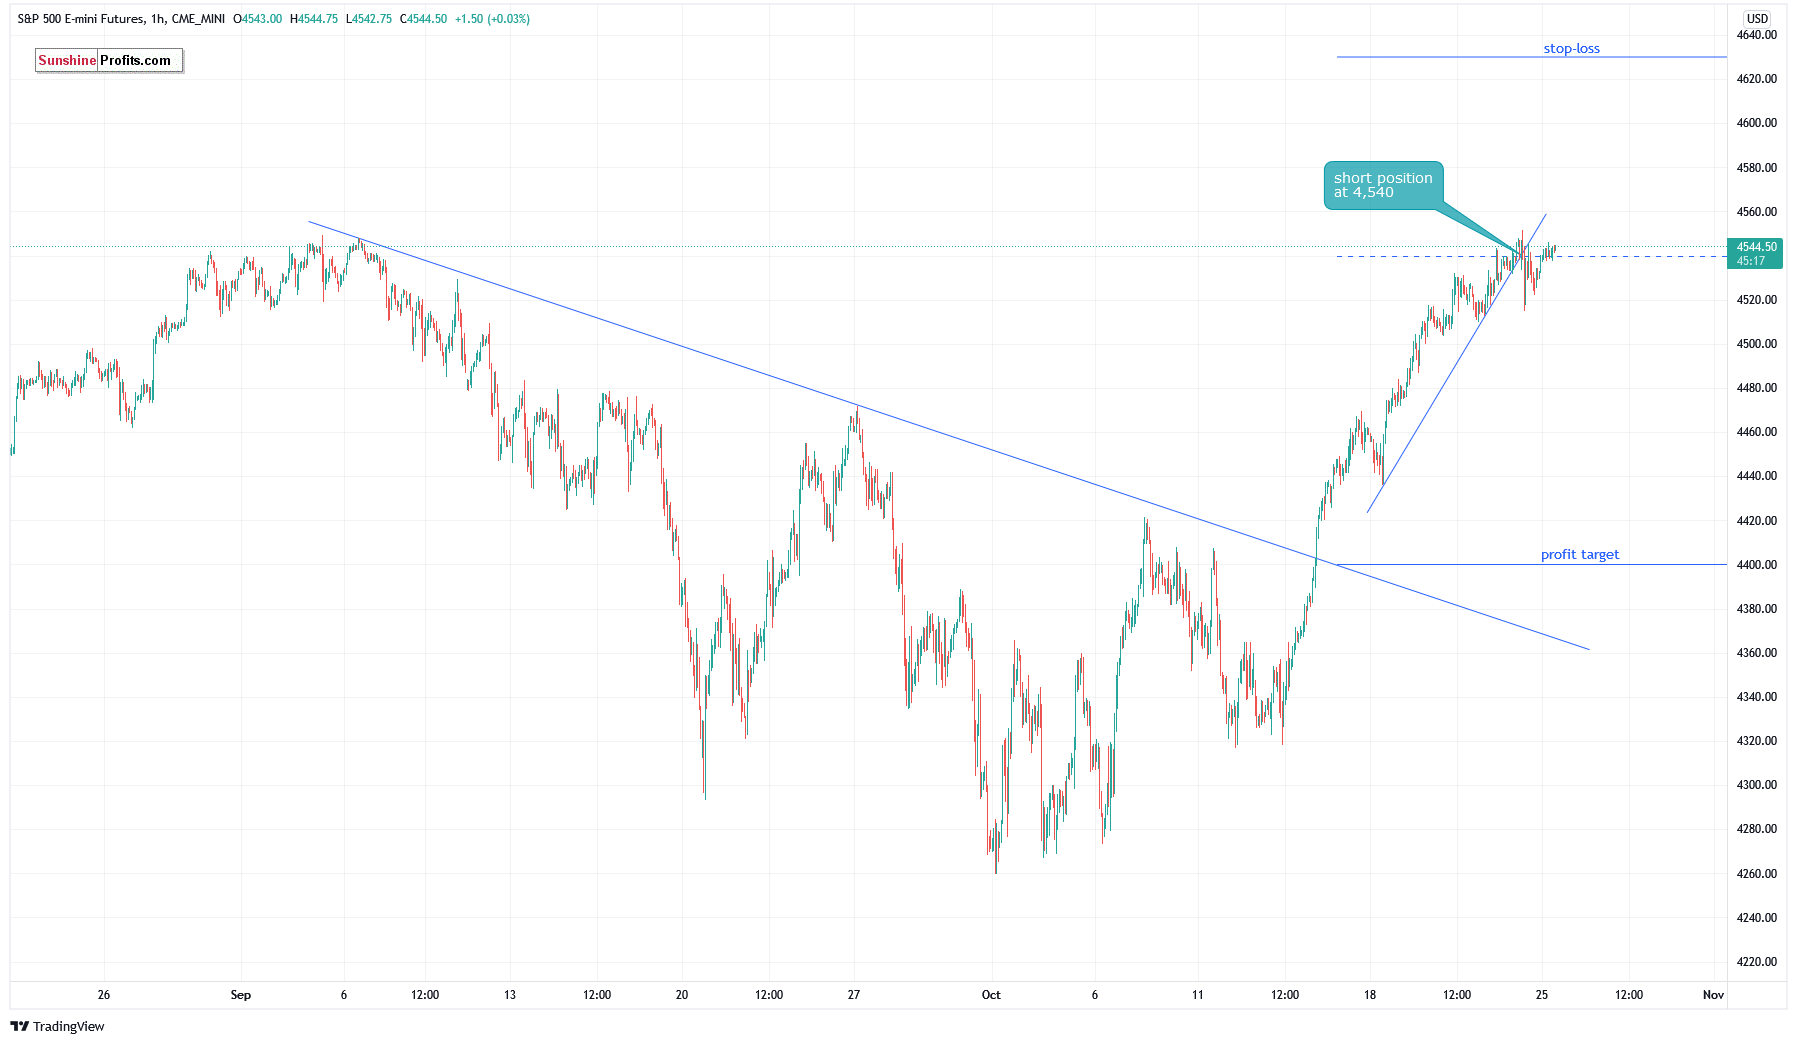
Let’s take a look at the hourly chart of the S&P 500 futures contract. Last week, the market broke above its downward trend line and it broke above its previous local high of around 4,470. The nearest important resistance level remains at around 4,550, marked by the early September topping pattern. The next resistance level is at 4,600.
The market seems overbought and poised for a correction. Therefore, we decided to open a speculative short position on Friday at the 4,540 level. (chart by courtesy of http://tradingview.com):
Conclusion
The S&P 500 index reached the new record high of 4,559.67 on Friday, but it closed 0.1%. lower. Today the market is expected to open 0.1-0.3% higher and we may see an attempt at another record-breaking rally ahead of series of quarterly corporate earnings releases. The market seems overbought in the short term and we may see a consolidation or another intraday downward correction.
We decided to open a speculative short position on Friday morning at the 4,540 price level. We are expecting a 3% correction from the current levels.
Here’s the breakdown:
- The S&P 500 has retraced all of its downward correction from the Sep. 2 local high last week, as it reached the new record high.
- A speculative short position (4,540 price level) is justified from the risk/reward perspective.
- We are expecting a 3% correction from the current levels.
As always, we’ll keep you, our subscribers, well-informed.
Trading position (short-term, our opinion; levels for S&P 500 continuous futures contract): short positions with entry at 4,540 price level, with 4,630 as a stop-loss and 4,400 as a price target.
Thank you.
Paul Rejczak,
Stock Trading Strategist
Sunshine Profits: Effective Investments through Diligence and Care

