

Trading position (short-term, our opinion; levels for S&P 500 continuous futures contract): No positions are currently justified from the risk/reward point of view.
Stocks’ short-term rally came to an end this week and the S&P 500 index entered a consolidation along the 4,700 level. Is this a topping pattern?
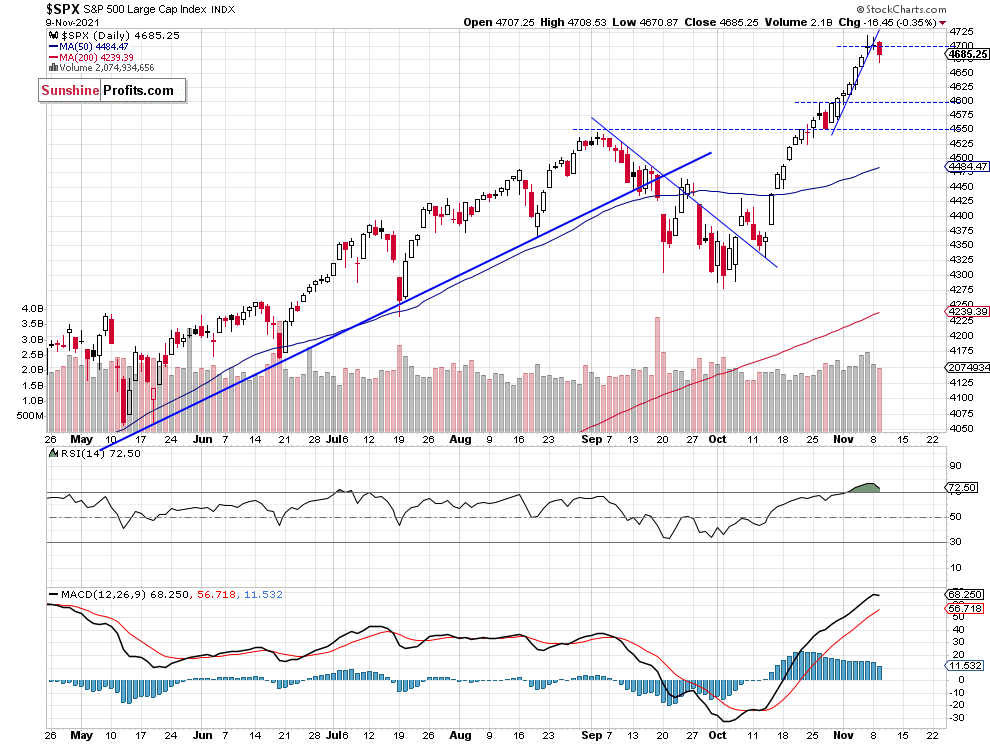
The S&P 500 index lost 0.35% yesterday, as it fell below the 4,700 price mark following two-day-long consolidation along the Friday’s record high of 4,718.50. The recent rally was not broad-based and it was driven by a handful of tech stocks like MSFT, NVDA, TSLA. The market seems overbought in the short-term and most likely it’s trading within a topping pattern. Today we may see another consolidation or a profit taking action following worse than expected inflation data release (the CPI monthly number came at +0.9% vs. the expected +0.6%).
The nearest important support level is at 4,650-4,675 and the next support level is at 4,600. On the other hand, the resistance level is at 4,700-4,720. The S&P 500 broke below its steep short-term upward trend line, as we can see on the daily chart (chart by courtesy of http://stockcharts.com):
Nasdaq Lost 0.7% on Tuesday
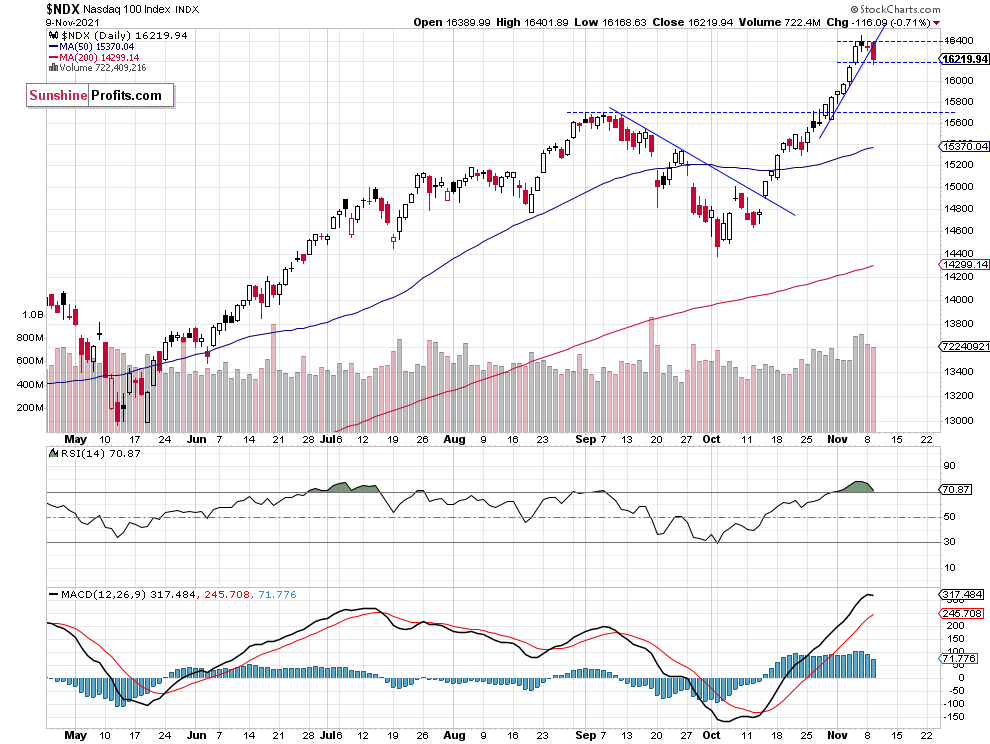
Let’s take a look at the Nasdaq 100 chart. The technology index broke above the 16,000 level recently and it was trading at the new record high. The market accelerated parabolically above its short-term upward trend line. But yesterday it lost 0.7% and closed below that trend line. The resistance level remains at 16,400, and the short-term support level is at 16,000, among others, as we can see on the daily chart:
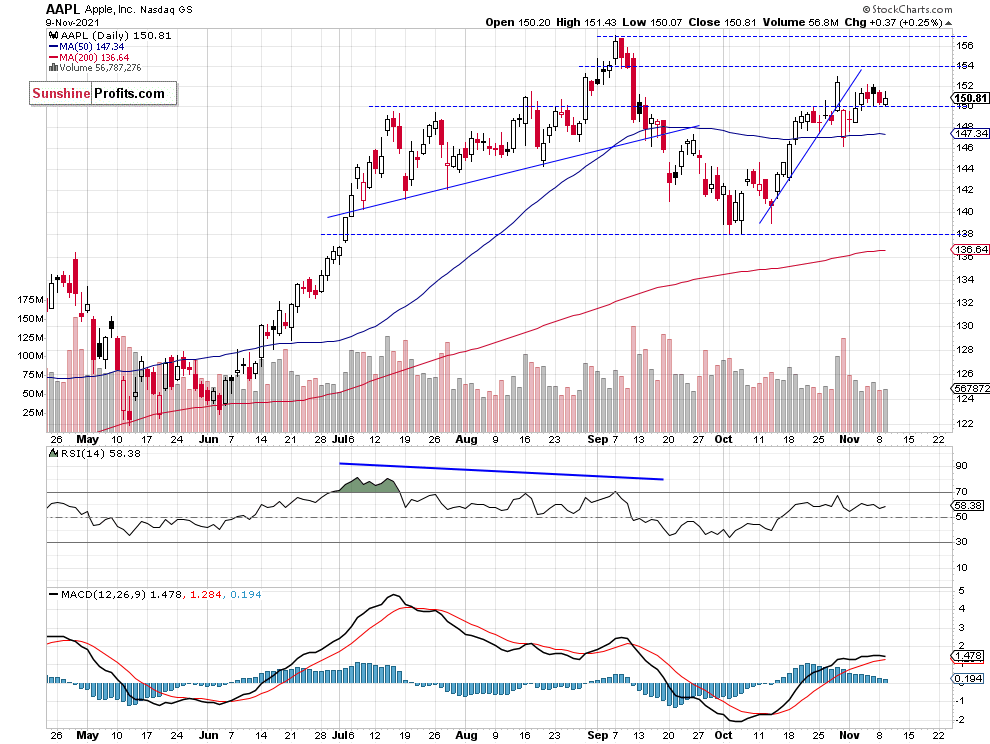
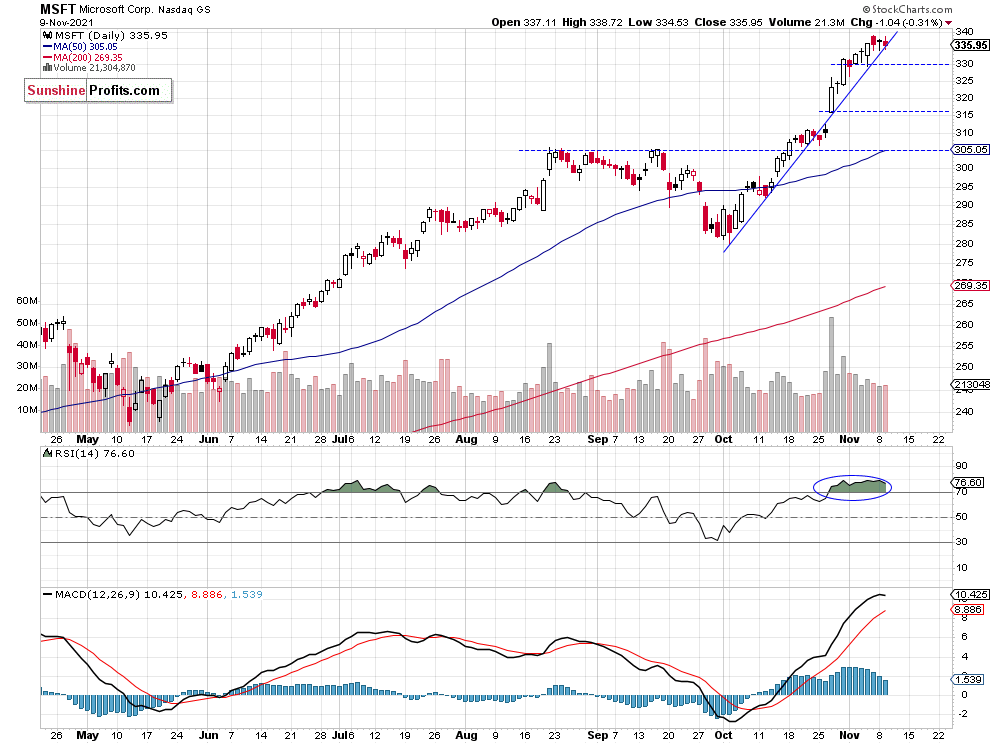
Apple’s Further Consolidation and Microsoft’s Potential Topping Pattern
Let’s take a look at the two biggest stocks in the S&P 500 index, AAPL and MSFT. Apple continues to trade within a consolidation along the $150 level and it is still well below the record highs, and the Microsoft is close to breaking below its over month-long upward trend line. So the tech “megacaps” may be turning lower, as we can see on their daily charts:
Futures Contract Broke Below the Trend Line
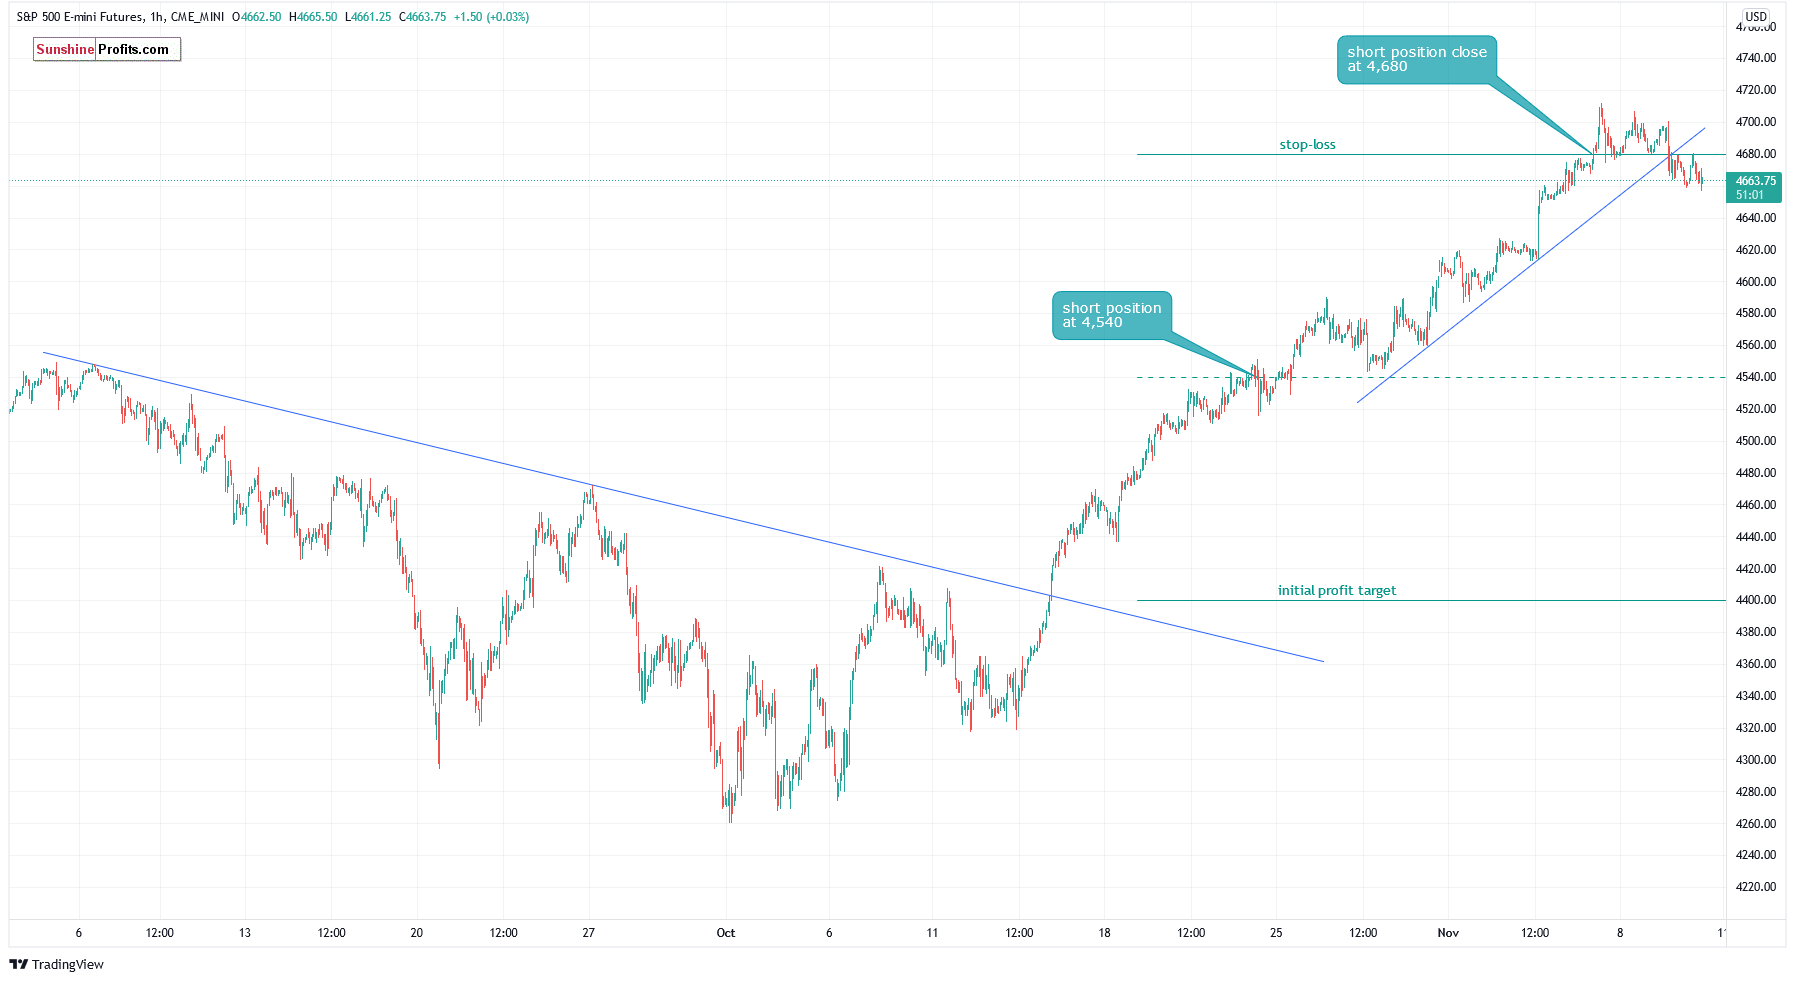
Let’s take a look at the hourly chart of the S&P 500 futures contract. The market broke below a week-long upward trend line. The resistance level remains at 4,680-4,700.
Our short position was closed at the stop-loss level of 4,680 on Friday. In our opinion no positions are currently justified from the risk/reward point of view. (chart by courtesy of http://tradingview.com):
Conclusion
The broad stock market went slightly lower on Tuesday and we may see a downward continuation this morning. The main indices are expected to open 0.2-0.5% lower following worse (higher) than expected consumer inflation number release.
It looks like a topping pattern and we may see a downward correction at some point. There may be a profit-taking action following quarterly earnings releases.
Here’s the breakdown:
- The S&P 500 extended its uptrend last week, but since Friday it is trading within a short-term downtrend.
- But still no positions are justified from the risk/reward point of view.
As always, we’ll keep you, our subscribers, well-informed.
Trading position (short-term, our opinion; levels for S&P 500 continuous futures contract): No positions are currently justified from the risk/reward point of view.
Thank you.
Paul Rejczak,
Stock Trading Strategist
Sunshine Profits: Effective Investments through Diligence and Care

