

Trading position (short-term, our opinion; levels for S&P 500 continuous futures contract): No positions are currently justified from the risk/reward point of view.
Stocks rallied again on Friday, as the S&P 500 index got the highest since mid-September. Is the downward correction over?
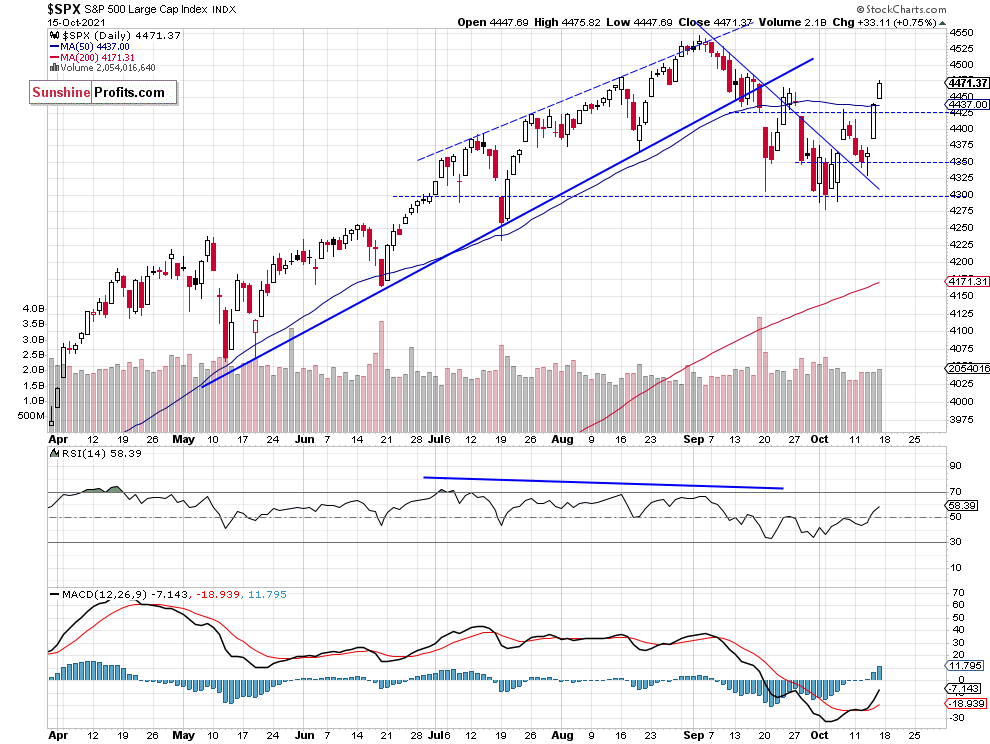
The S&P 500 index closed 0.75% higher on Friday, Oct. 15 following better-than-expected Retail Sales number release, among other factors. It rallied back above the late September local highs of around 4,465. The market retraced more than 50% of its decline from the Sep. 2 record high of 4,545.85. So is this a new uptrend or still just an upward correction within an over month-long downtrend? The market seems short-term overbought here.
The support level is now at 4,440-4,450, marked by the Friday’s daily gap up of 4,439.73-4,447.69. The next support level is at 4,400-4,420. On the other hand, the resistance level is at 4,485-4,500, marked by the previous local highs. The S&P 500 extends its advance after breaking above a month-long downward trend line, as we can see on the daily chart (chart by courtesy of http://stockcharts.com):
Dow Jones Is Relatively Stronger Now
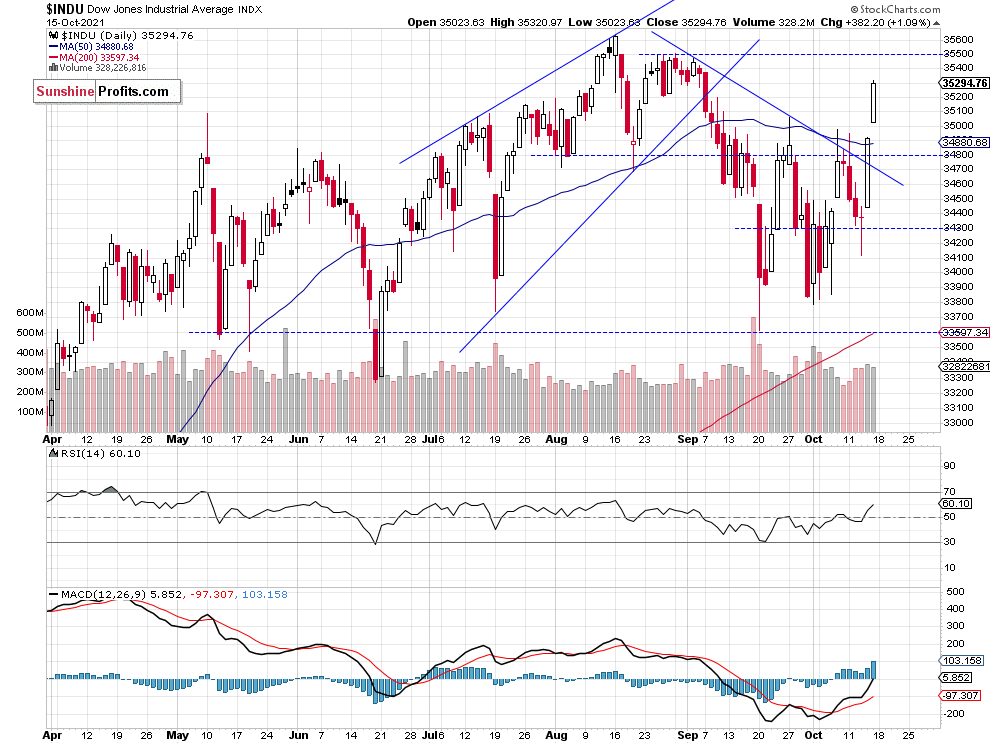
Let’s take a look at the Dow Jones Industrial Average chart. The blue-chip index broke above its over month-long downward trend line on Thursday, and on Friday it accelerated up above the 35,000 mark. The nearest important resistance level is now at 35,500, marked by some previous local highs, as we can see on the daily chart:
Apple Is Still At the Resistance Level
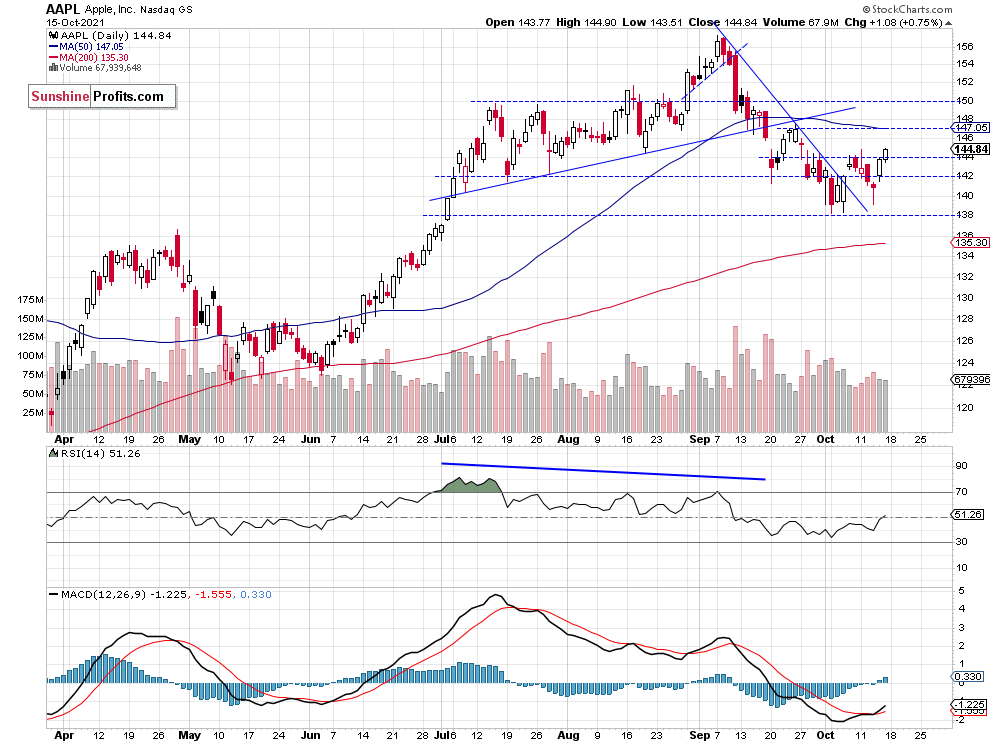
Apple stock weighs around 6.1% in the S&P 500 index, so it is important for the whole broad stock market picture. The stock is trading at the short-term resistance level of around $144-145. The next resistance level is at $148-150. For now, it looks like a consolidation following a month-long decline.
Futures Contract Is at Its Late September Local High
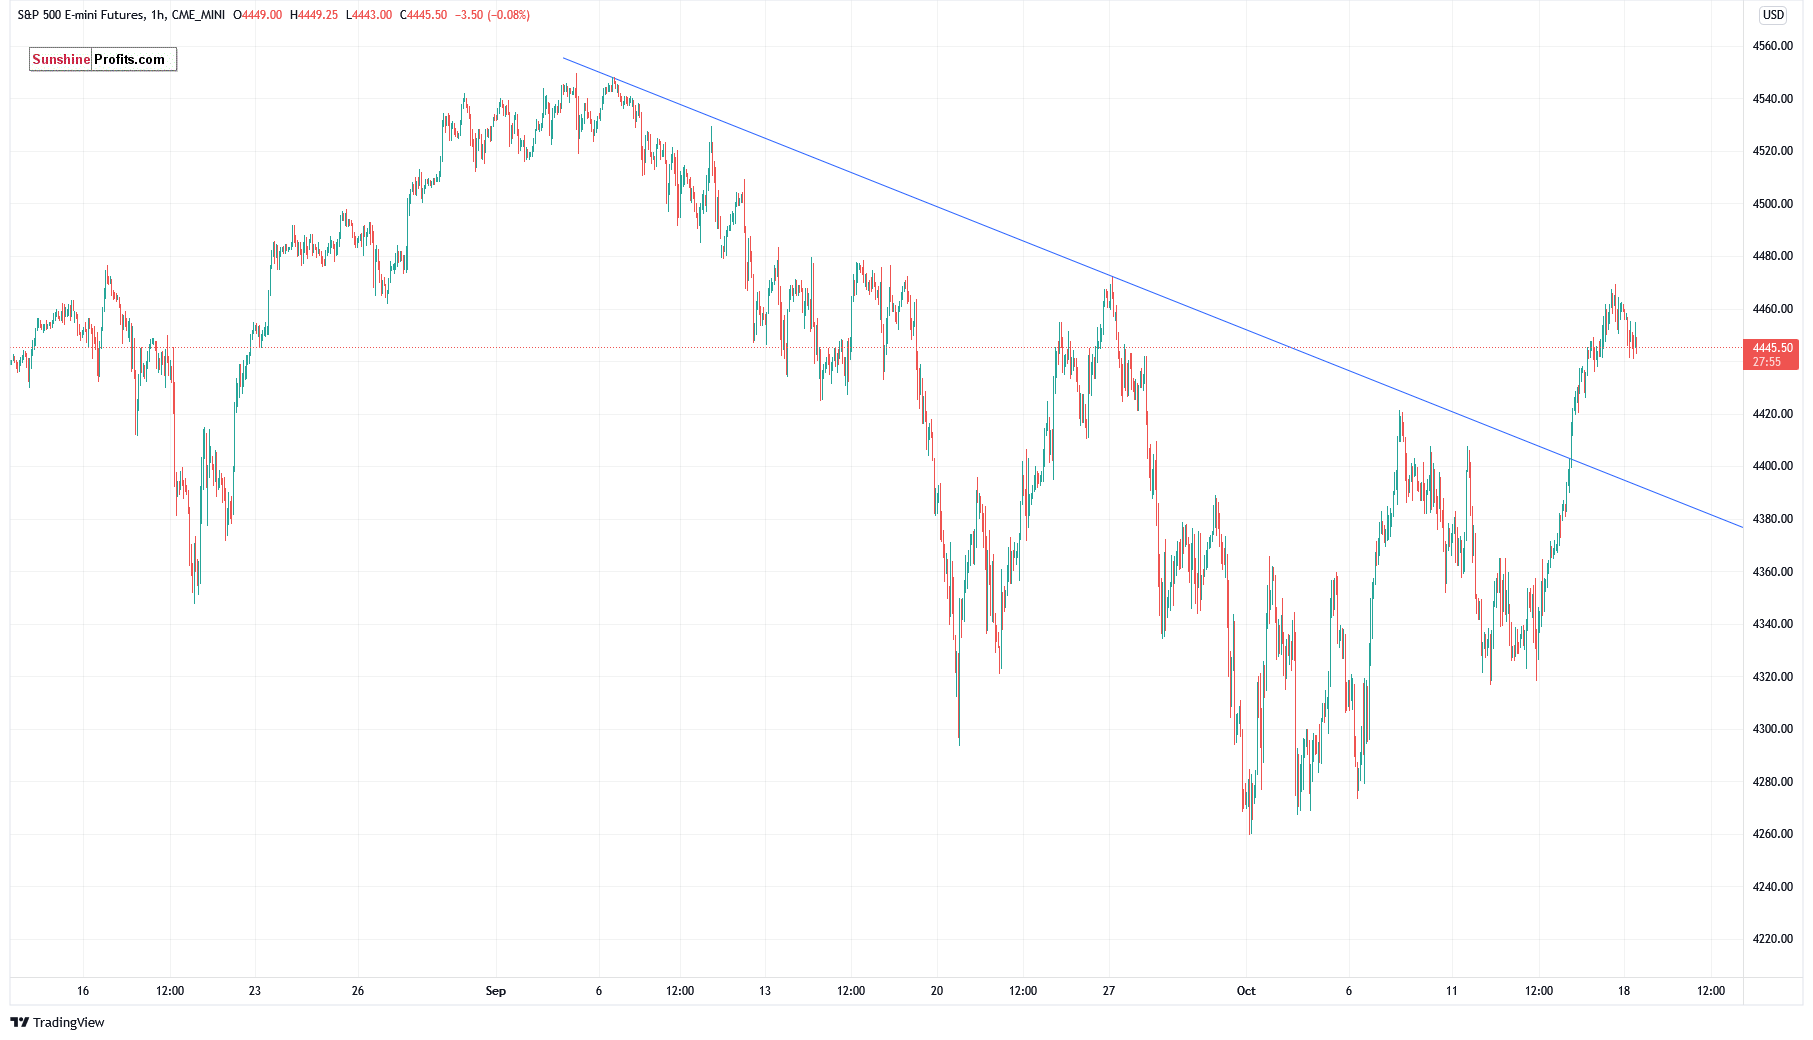
Let’s take a look at the hourly chart of the S&P 500 futures contract. The market broke above its downward trend line and it got closer to the previous local high of around 4,470. It’s the nearest important resistance level. In our opinion no positions are currently justified from the risk/reward point of view. (chart by courtesy of http://tradingview.com):
Conclusion
The S&P 500 index extended its short-term uptrend on Friday and it was the highest since mid-September. The market seems overbought in the short term. However, the coming quarterly corporate earnings releases (tomorrow it’s Netflix, Tesla on Wednesday, and Intel on Thursday) may support buyers here. Today the market is expected to open 0.4% lower and we may see some intraday uncertainty or a quick downward correction.
The risk/reward perspective seems less favorable right now and no positions are currently justified.
Here’s the breakdown:
- The S&P 500 extended its short-term uptrend on Friday, as it broke above the late September local highs. However it still looks like an upward correction within a downtrend.
- We are waiting for more favorable risk/reward situation and will probably enter a new speculative short position in the near term.
As always, we’ll keep you, our subscribers, well-informed.
Trading position (short-term, our opinion; levels for S&P 500 continuous futures contract): No positions are currently justified from the risk/reward point of view.
Thank you.
Paul Rejczak,
Stock Trading Strategist
Sunshine Profits: Effective Investments through Diligence and Care

