

It was a thunderous day for equity indices yesterday, with the S&P 500 approaching all-time highs. Our analysis has worked well. What comes next for the benchmark US index?
Greetings! What a move in the $SPX from its 50-day moving average touched on Friday and Monday. In fact, the S&P 500 had its best two days since May 14th!
We heard from Chair Powell yesterday during his testimony at the House of Representatives. It was a politically fueled discussion, with Republicans highlighting the lack of desire of many workers to return to work in some states. The market moved higher off the testimony, with Chair Powell reiterating that inflation was indeed transitory and very sector-specific. Is this correct? I suppose time will tell. What matters for us is that the broader markets moved higher during and after the testimony; while beginning to retreat in the final 30 minutes of the NY session.
If you have been following along or are a Premium subscriber, you know that we had been waiting for an entry into the S&P 500 at or near the 50-day simple moving average for quite some time. After waiting with patience and discipline, we got our signal on Friday and Monday with the $SPX briefly trading below this key level and ultimately reversing to the upside on Monday.
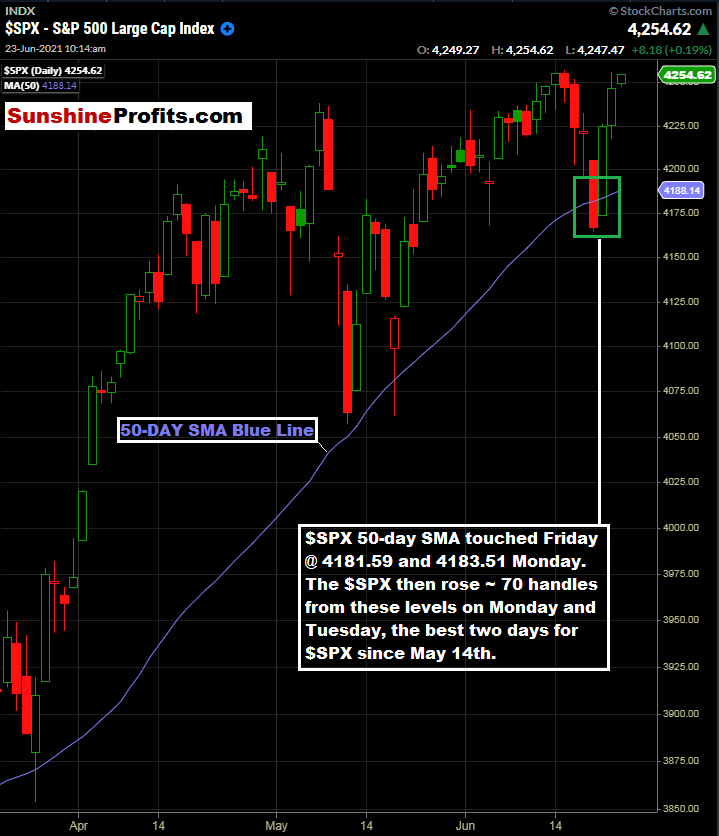
Figure 1 - S&P 500 Index March 19, 2021 - June 23, 2021, Daily Candles Source stockcharts.com
What a wonderful move for us. It takes patience and discipline to wait and execute. Now, if you are a Premium subscriber, you received an email alert at approximately 3:38 ET yesterday, suggesting to consider exiting long S&P 500 positions. There were several reasons for this:
- I realized this was the best two-day period in five weeks .
- Hourly RSI(14) was approaching the 70 level - indicating short-term overbought conditions.
- Being greedy is never a good thing.
- S&P 500 was within 10 handles of all-time highs.
So, around 3:30 PM ET yesterday, all of this came together in my mind and indicated that it may be a good time to sell. What if it keeps going up? Who cares. Nobody catches exact tops and bottoms in trading. The idea is to catch the meat of the move before the market takes it away. And with everything going on including inflation, higher rate environment digestion, and numerous other factors, it was a good time to take chips off the table.
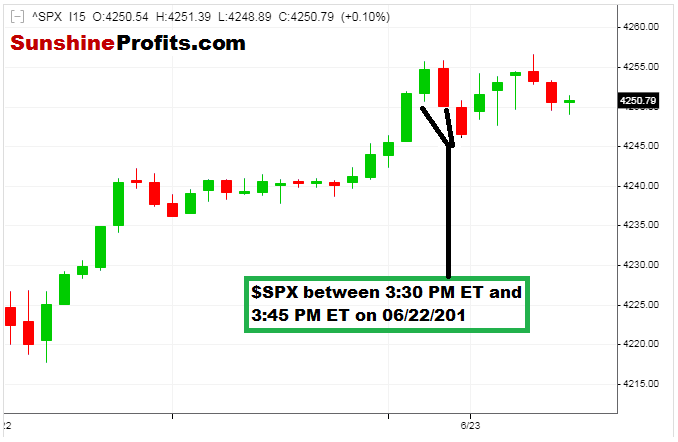
Figure 2 - S&P 500 Index June 22, 2021 - June 23, 2021, 10:58 AM, 15 Minute Candles Source stooq.com
I have been in and around the S&P 500 long enough to know when the index throws you a bone; you take it.
In addition, trading the $SPX around and near all-time highs can be tricky business. What would be the catalyst to break out above the old high? This morning, we got a mixed bag of mostly bearish economic data including New Home Sales, and PMI metrics. Courtesy of our friends at FX Empire:
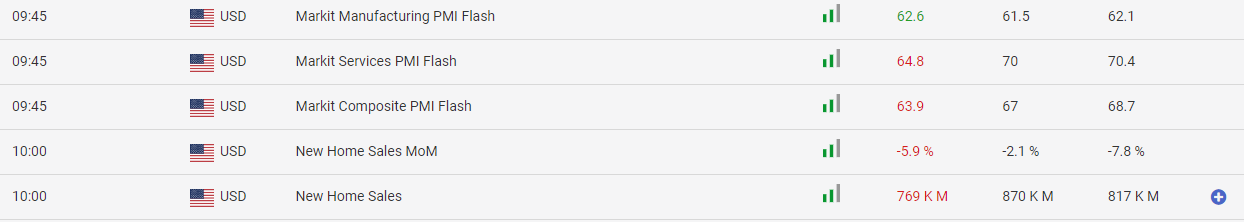
Figure 3 - Certain US Economic Data Releases for June 23, 2021 Source fxempire.com
As we can see from the above table, this morning's economic data was nothing to write home about. However, markets can remain illogical for extended periods. For the moment, my attention turns away from the indices and goes back to select names and themes until more time passes. You have to know when to stay away, too.
Hopefully, you have been able to take advantage of some of the gems we have found lately on the pullbacks. Right now, I am staying focused on the current names that we are following. In addition, I am updating the latest calls/levels. There is an ebb and flow to everything, and new opportunities are always right around the corner. Stay tuned!
To sum up the current viewpoint and opinion:
I have BUY opinions for:
- Defiance Quantum ETF (QTUM) between $44.00 - $49.50. Update 06/23: This one is still in the upper area of our buy idea zone. Look for pullbacks for entries near the 50-day SMA (currently $47.75). Always use a stop loss level that caters to your individual risk tolerance.
- Amplify Transformational Data Sharing ETF (BLOK) between the 200-day moving average and $40.00 200-Day Moving Average is currently $40.21 Update 06/23: Bitcoin and crypto have gotten slammed, but I am in no rush. There could be another shoe to drop. Patience. Always use a stop loss level that caters to your individual risk tolerance.
- Invesco MSCI Sustainable Future ETF (ERTH) between $65 and $66. Update 06/22: Important note on ERTH: This one had me scratching my head on the open yesterday and then I quickly discovered that there had been a $9.95 dividend issued. You can read about the dividend on Invesco’s website here. Call your broker if you have any questions about how the dividend was applied to your account. This dividend was abnormally high for ERTH based on the past. Since $9.95 came out of the stock price in the form of a dividend, we must adjust our pricing outlook by $9.95. I like this name for the longer-term around $65-$65.80 (dividend adjust price) at this time. Update 06/23: I like the theme of this ETF. Look to enter on pullbacks between $65 and $66.00. Always use a stop loss level that caters to your individual risk tolerance.
- Invesco Exchange-Traded Fund Trust - S&P SmallCap 600 Pure Value ETF (RZV) on pullbacks. Update 06/22: This one touched the 50-day MA on Friday (we were waiting for that!) and tacked on 2.51% in yesterday’s session. If you didn’t catch the big pullback, look to enter on any pullback from $93 - $94.90. Update 06/23: I think this has legs. If not on board yet, look for intraday pullbacks in the low to mid $95’s. Always use a stop loss level that caters to your individual risk tolerance.
- iShares Global Timber & Forestry ETF (WOOD) Initial buy idea zone between $79.07 and the 200-day moving average ($79.82 as of 06/16 close). Update 06/16: Given the price action in the lumber futures described in today’s alert, consider an entry into ½ of a normal position size between $86.50 - $87.50. Should it pull back further, we can look to add another ½ position size. Update 06/17: WOOD provided the entry opportunity levels that we were looking for on Wednesday and even finished higher on the day. What a great sign. Look to be long on this underappreciated ETF. Update 06/21: WOOD traded through our first tranche level between $86.50 and $87.50. It closed Friday @ $84.15. I am looking at the above-mentioned price levels between $79.16 and $79.82 - $80.00 for the second tranche. See Above. Update 06/22: Wood tacked on 2.33% yesterday. Hold longs and look to add between $79.16 - $80.00. Update 06/23: Hold existing longs and look to add between $79.16 - $80.00. Always use a stop loss level that caters to your individual risk tolerance.
- Invesco Solar ETF (TAN) between the 50-day moving average ($80.32 as of June 14th) and $81.50. Look for an intraday pullback for entry. Update 06/16: We wanted a pullback, and we got a big one on Tuesday, with the range being $78.00 - $80.69. Ideally, this was taken advantage of on this pre-Fed meeting day. There could have been some “sell the news” price action with the SEIA report being released yesterday. Although we are below the 50-day MA, I like the previous consolidation and would look to be long at these levels. Update 06/17: TAN tacked on 1.51% in Wednesday’s overall down session. Great sign. I like this one and I think there is still time to get on board. Always use a stop loss level that caters to your individual risk tolerance. Update 06/21: We really nailed this entry and I am looking for continued upside. I think there is still time to get on board - look for pullbacks near the $81.00 level. I like this for a longer-term holding with price appreciation potential north of $100.00. Update 06/22: I think there is still time to get on board: look for pullbacks approaching the 50-day SMA of $79.75 - $81.00 for long entries. I like this one for a longer-term move above $100.00. Update 06/23: I love TAN. This one has been up and up. If you are still not on board, look for pullbacks and do not chase. The current 60-day SMA is $79.67. Always use a stop loss level that caters to your individual risk tolerance.
- First Trust NASDAQ Clean Edge Smart Grid Infrastructure Index Fund (GRID). GRID has traded through our idea range of between $86.91 and $88.17. Update 06/17: GRID closed at $91.50 yesterday, moving lower on the overall down day. I see no major technical damage and like this one over the longer run. Opinion: hold existing longs and/or look for entries on pullbacks. Update 06/22: Another one that briefly touched the 50-day SMA. Did you get it? If not I like it anywhere below $91 - look to enter on pullbacks. I am looking for $100 level or maybe higher in the longer term. Update 06/23: I love GRID too. It has been a steady Eddie. Do not chase though, perhaps we get a pullback to the $90 level if you are not long yet. Always use a stop loss level that caters to your individual risk tolerance.
I have SELL opinions for:
NONE
I have a HOLD opinion for:
- Update 06/23: This is approaching the sale date on June 28th, regardless of price. iShares Trust Russell 2000 ETF (IWM) for an index reconstitution trade. At this time, I would be looking to be long and then exiting upon the actual reconstituted index going into place on June 28, 2021. Buy the rumor, sell the fact type of trade. Buy Pullbacks. For equity-bearish folks, see the IWM/SPY spread idea in the May 27th publication. Always use a stop loss level that caters to your individual risk tolerance. Update 06/22: this one is approaching our exit date of June 28th.
Thanks for reading today’s Stock Trading Alert. Let’s continue with our theme of patience, discipline, and execution. Have a great day!
Thank you,
Rafael Zorabedian
Stock Trading Strategist

