

Trading position (short-term; our opinion): Short position with the downside target of 2,840 (S&P 500 index) remains justified from the risk/reward perspective. However, the outlook may change if the index breaks above the resistance level of 2,980-3,000.
Intraday outlook: The broad stock market will likely open higher today. Then we may see some short-term profit-taking action.
The U.S. stock market indexes gained between 0.3% and 0.6% on Friday, extending their short-term consolidation, as investors' sentiment improved once again. The S&P 500 index reached the record high of 2,964.15 on the previous Friday, but then it came back below the 2,950 mark again. The index gained more than 230 points from its early June local low of around 2,729. The Dow Jones Industrial Average gained 0.3% and the Nasdaq Composite gained 0.5% on Friday.
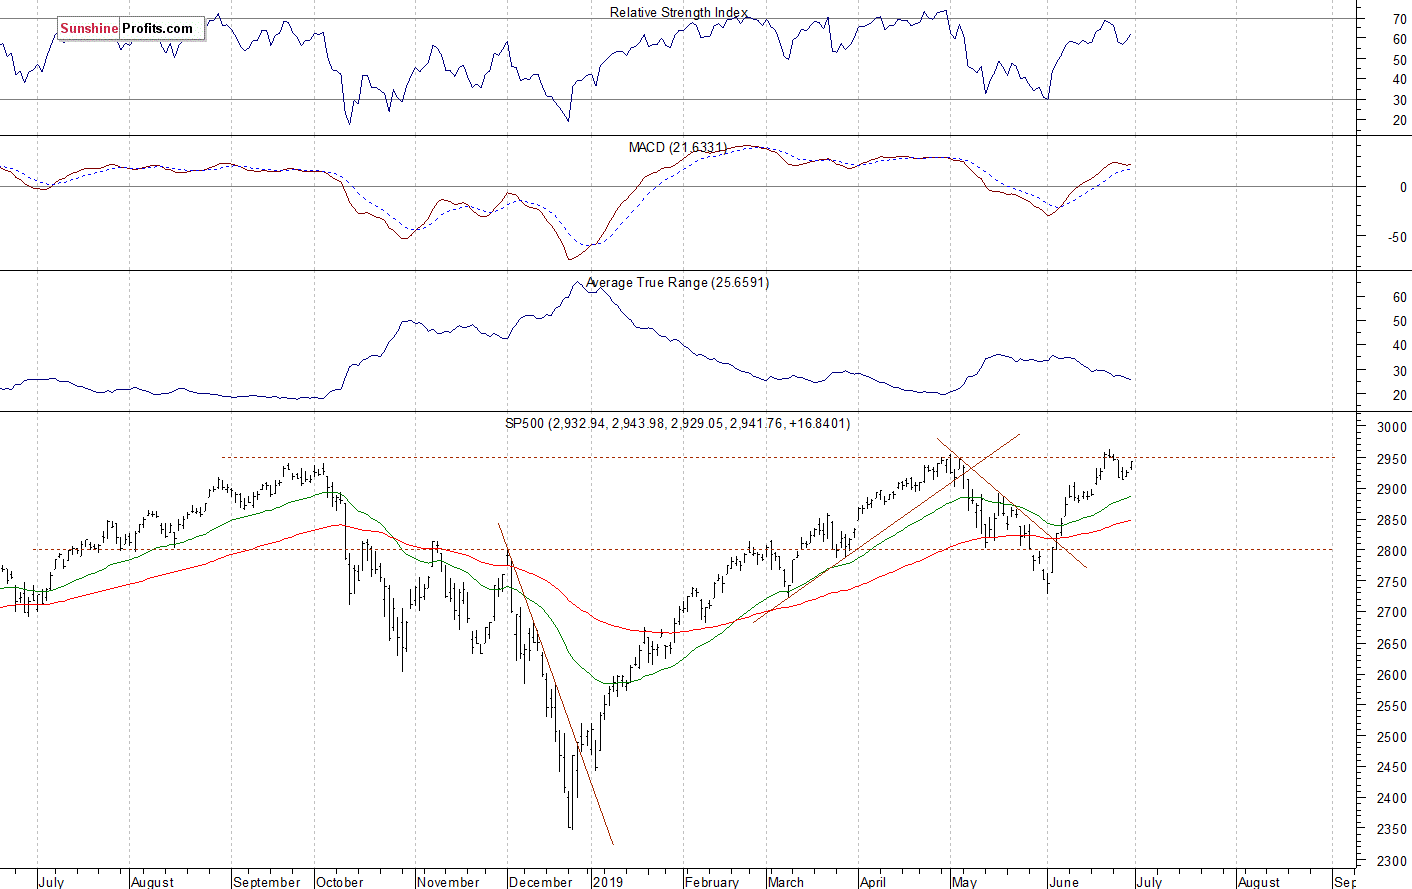
The nearest important resistance level of the S&P 500 index remains at 2,945-2,950, marked by the recent short-term local lows. The next resistance level is at 2,980-3,000. On the other hand, the support level is around 2,930. The next support level is at 2,895-2,905, marked by June the 18th daily gap up of 2,897.27-2,905.44.
The broad stock market broke above the last year's high in the early May. But then the S&P 500 index retraced all of the April's advance. It got back higher following breaking above the month-long downward trend line. Then it reached the new record high on Friday, but we saw some selling pressure along the previous medium-term local highs:
Very Positive Expectations
The index futures contracts trade 0.8-1.4% above their Friday's closing prices, so expectations before the opening of today's trading session are very positive. The European stock market indexes have gained 0.8-1.2% so far. Investors will wait for some economic data announcements this morning: ISM Manufacturing PMI, Construction Spending at 10:00 a.m.
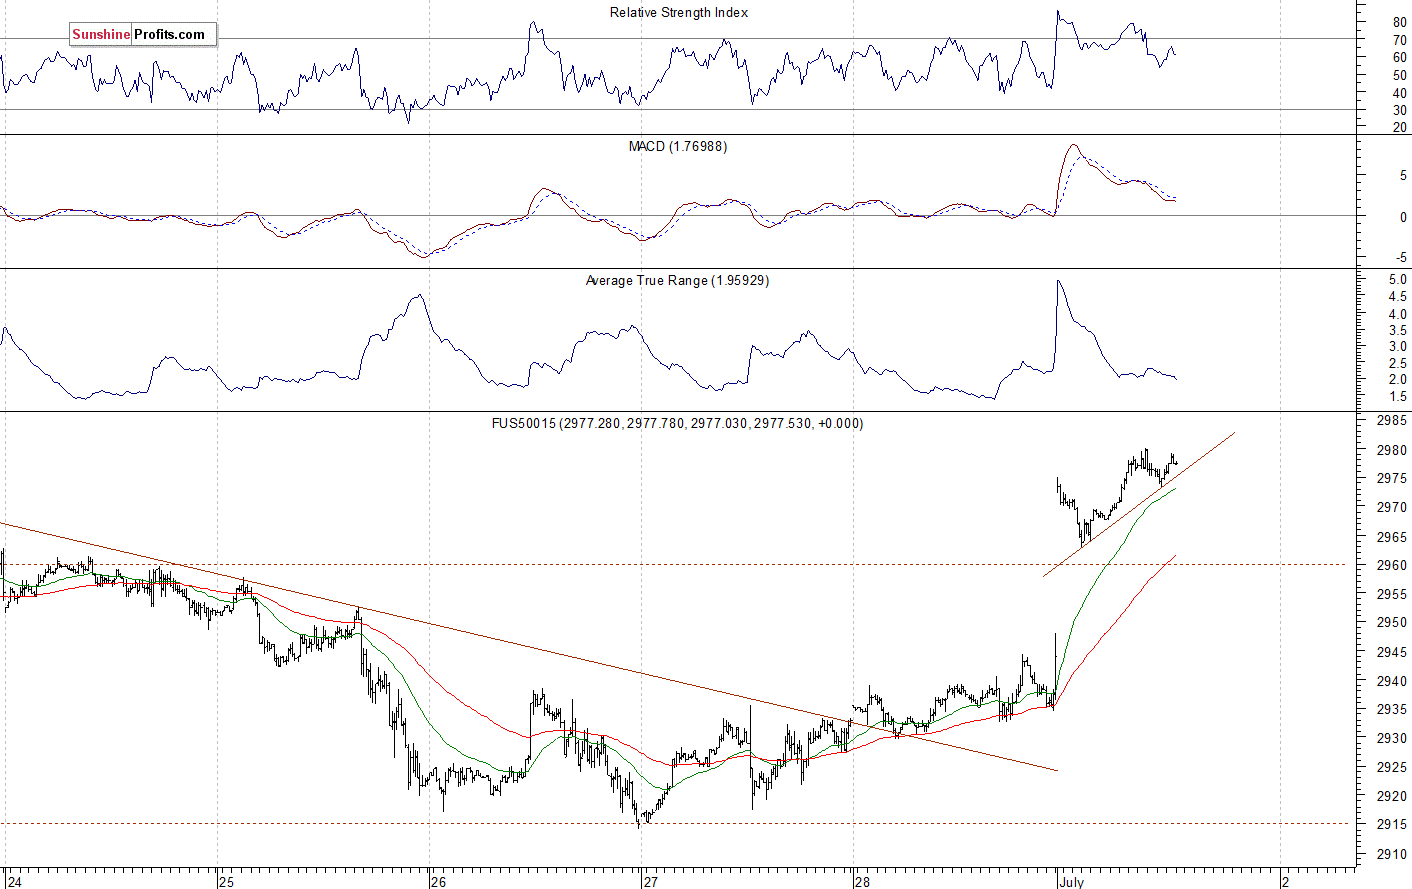
The S&P 500 futures contract trades within an intraday consolidation following an overnight rally. The nearest important resistance level is now at around 2,980-3,000. On the other hand, the support level is at 2,950-2,960, marked by the previous resistance level. The futures contract is at the new all-time high this morning, as the 15-minute chart shows:
Nasdaq Also Much Higher
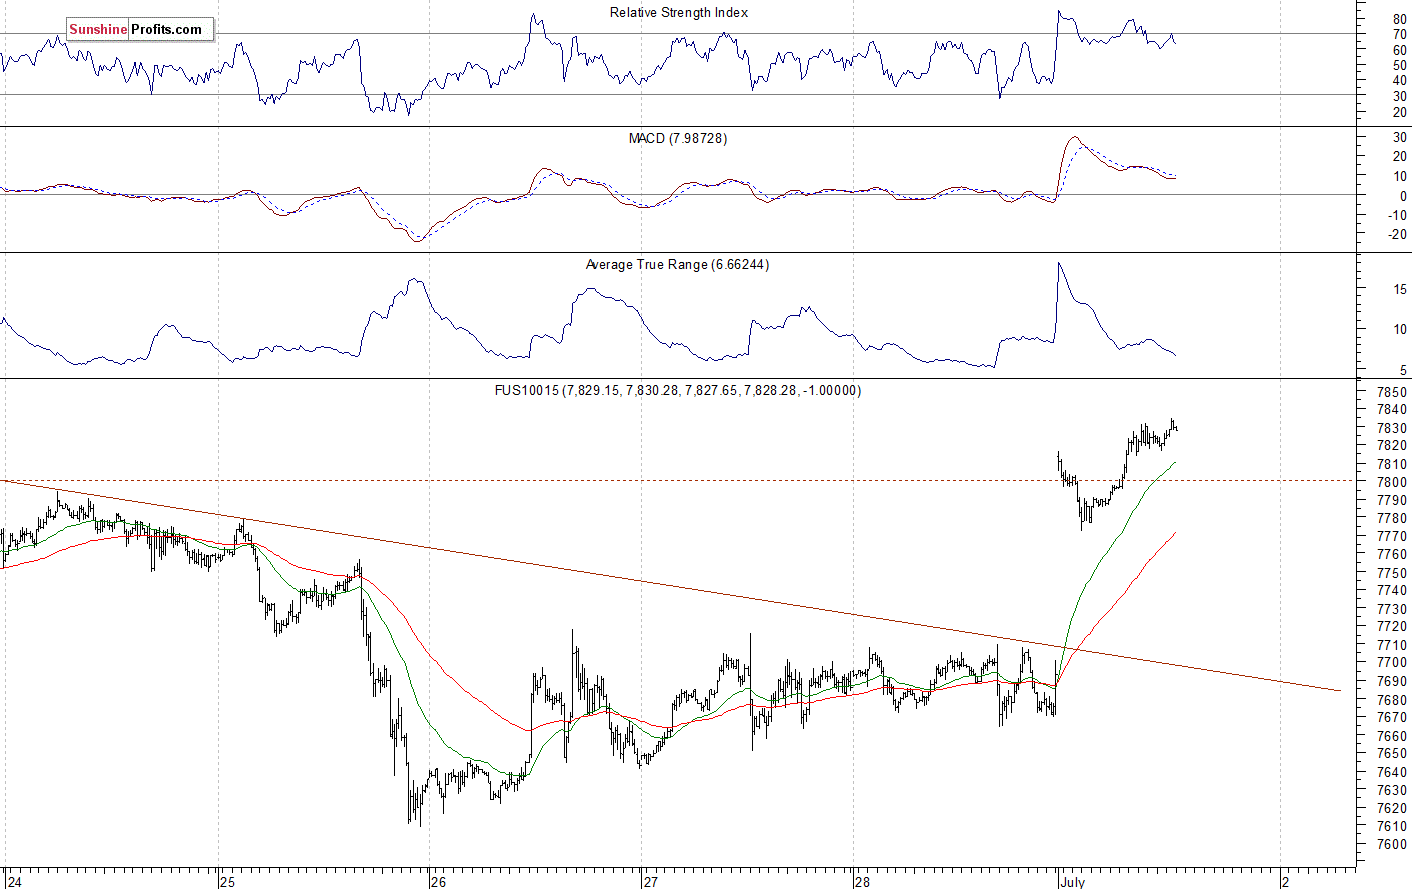
The technology Nasdaq 100 futures contract follows a similar path, as it trades within an intraday consolidation after opening much higher overnight. The nearest important resistance level is at 7,850-7,900, marked by the late April record high. On the other hand, the support level is at 7,750-7,800. The Nasdaq futures contract is now above its previous local highs, as we can see on the 15-minute chart:
Big Cap Tech Stocks Relatively Weaker
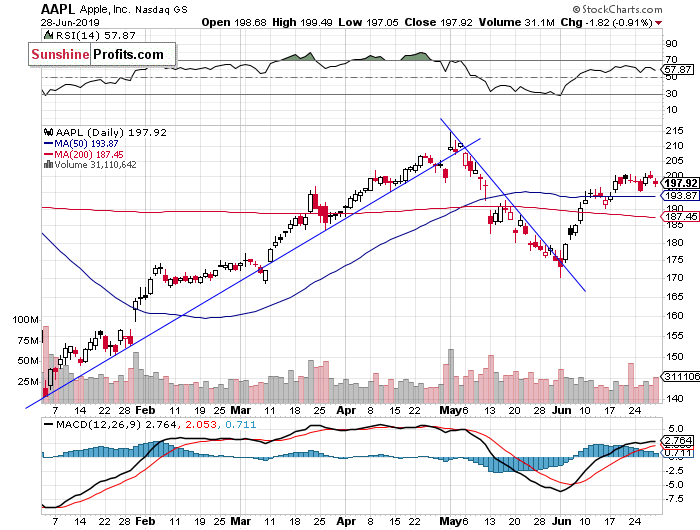
Let's take a look at the Apple, Inc. stock (AAPL) daily chart (chart courtesy of http://stockcharts.com). The stock is bouncing off the resistance level of $200 recently. The market remains within a short-term consolidation following the early June rally:
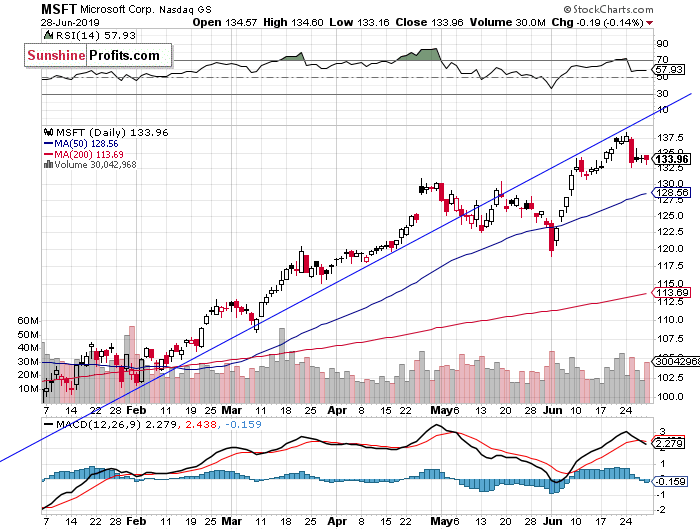
Now let's take a look at the daily chart of Microsoft Corp. (MSFT). The stock reached the new record high of $138.40 on Monday, following breaking above the short-term consolidation last week. But Tuesday's trading session was bearish, as the price fell to the previous short-term consolidation. For now, it looks like a downward correction:
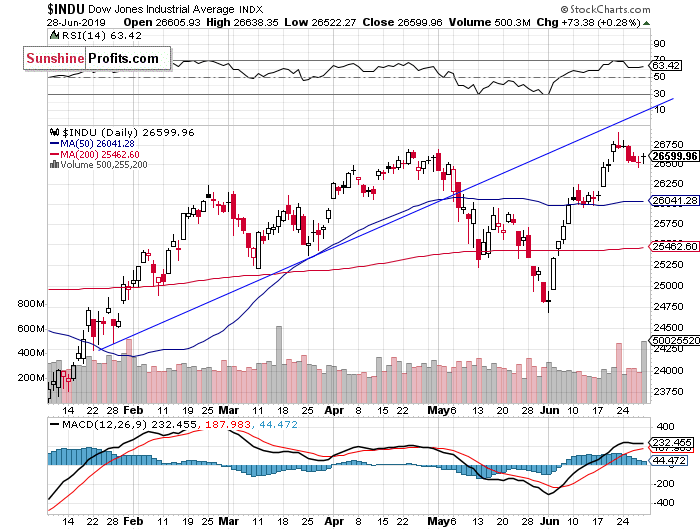
Dow Jones Ready to Break Higher?
The Dow Jones Industrial Average has been relatively weaker than the broad stock market since February. The resistance level remained at around 26,800-27,000, marked by the last year's topping pattern and the record high of 26,951.8. On the previous Friday the index reached the new medium-term high, following breaking above its late April consolidation. However, then it retraced the recent advance:
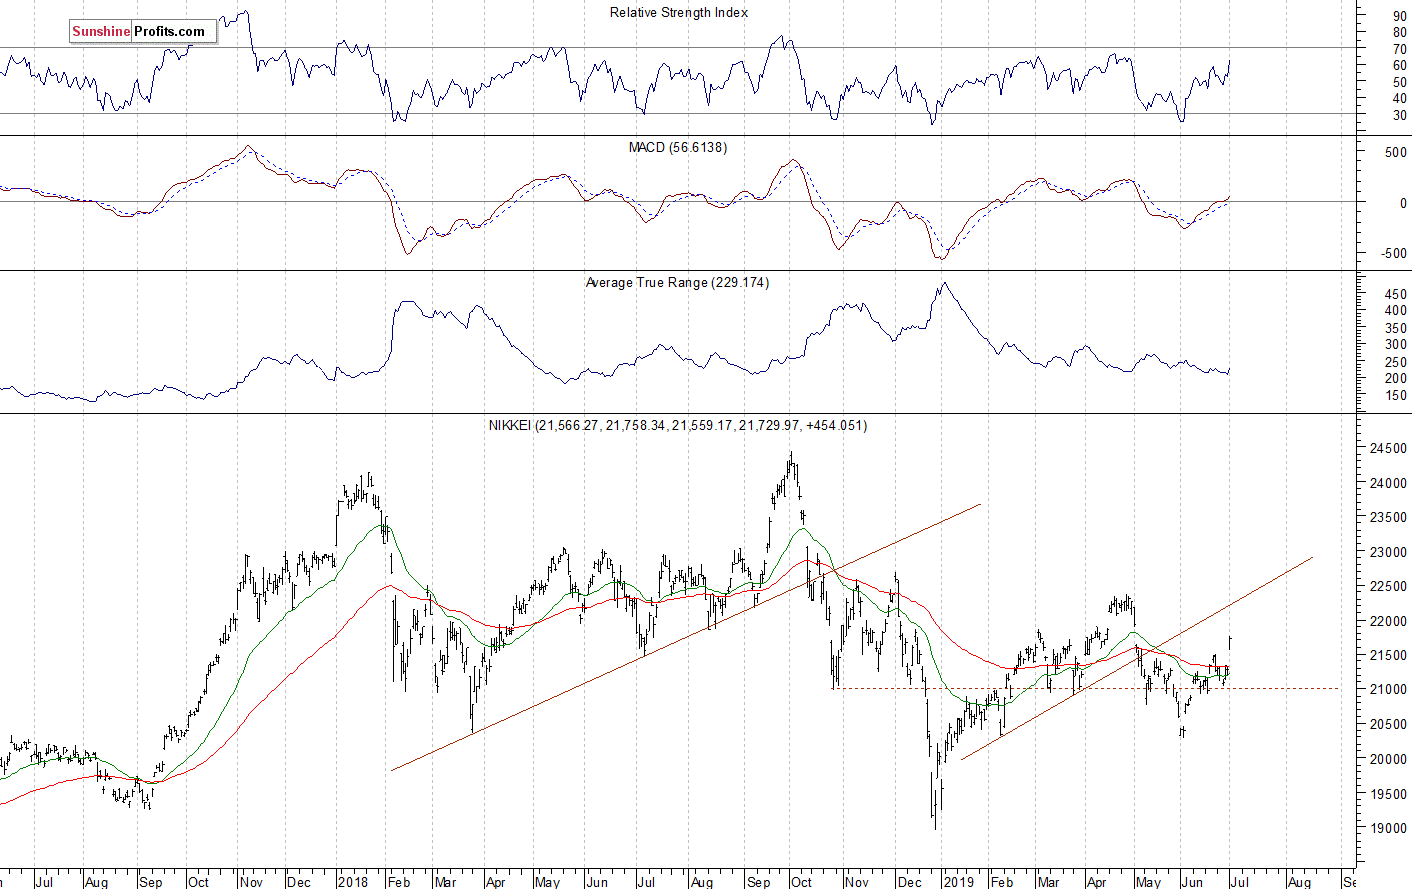
Nikkei Advancing Today
Let's take a look at the Japanese Nikkei 225 index. It broke above the recent trading range today, as it got closer to the 22,000 mark again. It is currently the highest since the early May:
The S&P 500 index reached the new record high on the previous Friday, before reversing its upward course. So was it a downward reversal or just quick profit-taking action before another leg higher? Tuesday's trading session was quite bearish, but since then we saw a sideways trading action. Today, we may see an attempt at breaking higher following the G20 Osaka Summit outcomes.
Concluding, the S&P 500 index will likely open higher today. The market may reach the new record high this morning. However, we could see a profit-taking action at some point.
Trading position (short-term; our opinion): Short position with the downside target of 2,840 (S&P 500 index) remains justified from the risk/reward perspective. However, the outlook may change if the index breaks above the resistance level of 2,980-3,000.
Thank you.
Paul Rejczak
Stock Trading Strategist
Sunshine Profits - Effective Investments through Diligence and Care

