

Trading position (short-term; our opinion): no positions are justified from the risk/reward perspective.
Intraday outlook: The broad stock market will likely open slightly lower today. We may see some more short-term fluctuations along the 2,900 level.
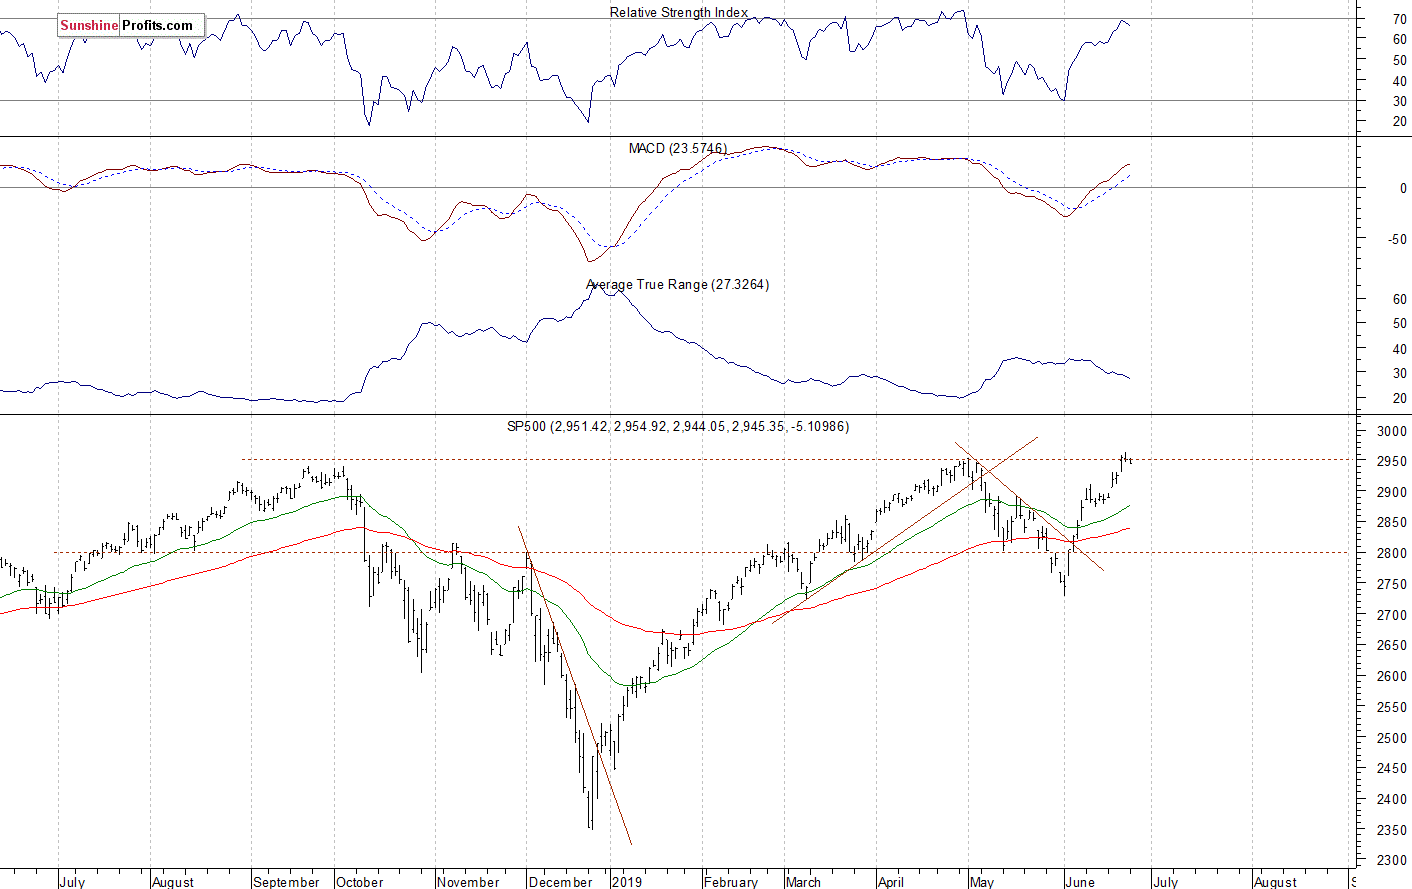
The U.S. stock market indexes were mixed between -0.3% and 0.0% on Monday, following last week's rally and Friday's intraday decline off the broad stock market's gauge new record high. The S&P 500 index reached the record high of 2,964.15 on Friday, but then it came back to the 2,950 mark again. The index gained more than 230 points from its early June local low of around 2,729. The Dow Jones Industrial Average was unchanged and the Nasdaq Composite lost 0.3% on Monday.
The nearest important resistance level of the S&P 500 index remains at 2,960-2,965, marked by the mentioned new record high. On the other hand, the support level is at 2,950. The next support level remains at 2,930-2,935, marked by the recent consolidation.
The broad stock market broke above the last year's high in the early May. But then the S&P 500 index retraced all of the April's advance. The market also broke below its two-month-long upward trend line in the early May. And then it got back higher following breaking above the month-long downward trend line. On Friday the broad stock market reached the new record high. However, it remains close to its previous medium-term highs:
Short-Term Consolidation
The index futures contracts trade 0.1-0.2% below their yesterday's closing prices, so the expectations before the opening of today's trading session are slightly negative. The European stock market indexes have lost 0.1% so far. Investors will wait for some economic data announcements: CB Consumer Confidence, Richmond Manufacturing Index, New Home Sales at 10:00 a.m. There will also be a speech from the Fed Chair Powell at 1:00 p.m.
The broad stock market will likely extend its short-term consolidation following last week's rally and Friday's record-breaking intraday advance. For now, it looks like a relatively flat correction within an uptrend.
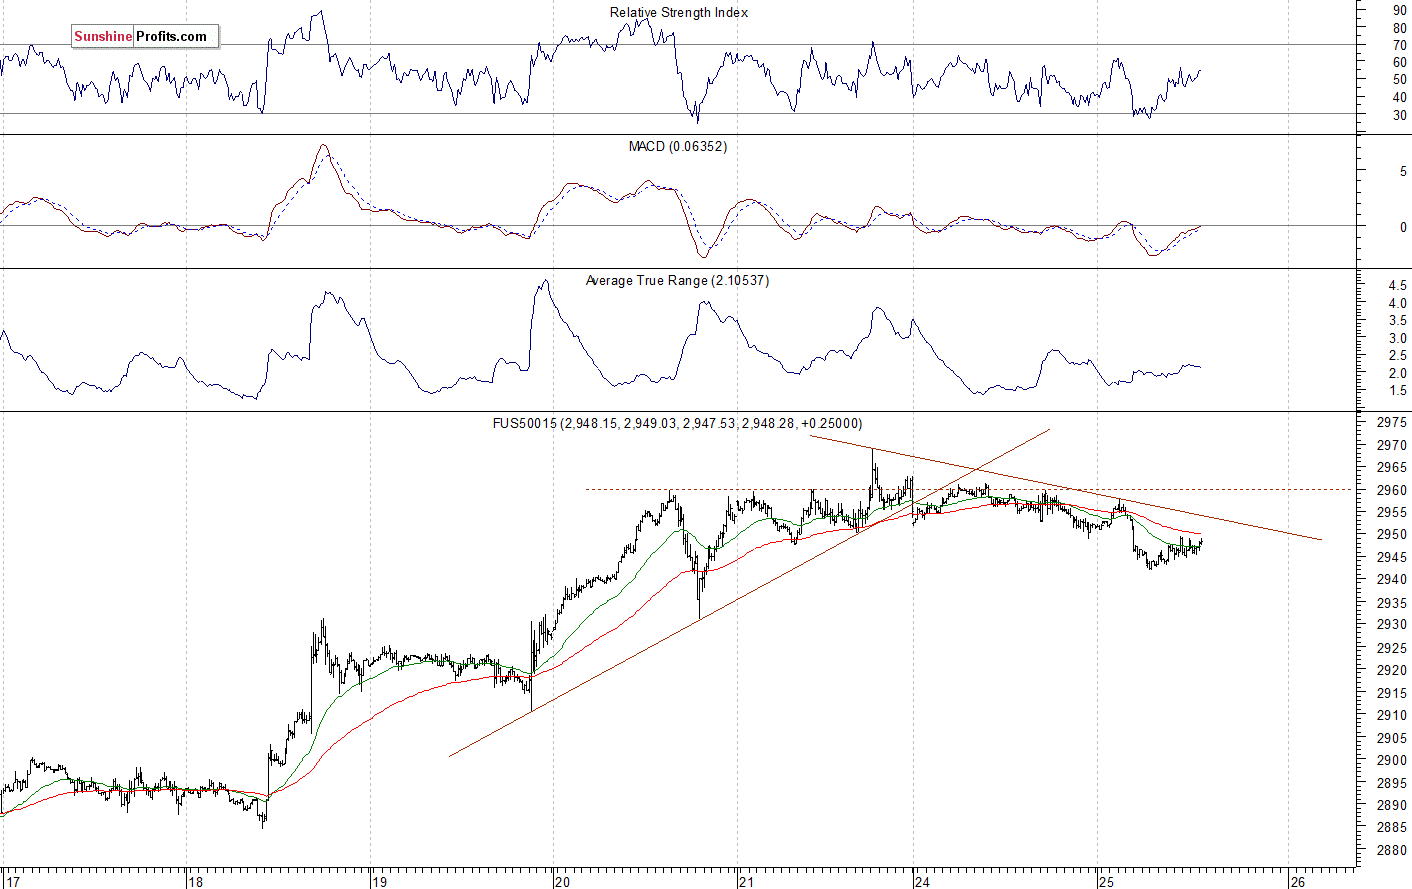
The S&P 500 futures contract trades within an intraday consolidation following an overnight decline. The nearest important support level is at around 2,940-2,945. On the other hand, the resistance level is at 2,955-2,960, marked by some recent local highs. The futures extends its short-term fluctuations this morning, as the 15-minute chart shows:
Nasdaq Also Going Sideways
The technology Nasdaq 100 futures contract follows a similar path, as it trades within an intraday consolidation. The nearest important resistance level is at 7,7507,800. On the other hand, the support level is at 7,650-7,700, marked by the recent resistance level. The Nasdaq futures contract is below its last week's upward trend line, as we can see on the 15-minute chart:

Microsoft at Another New Record High, Apple Going Sideways
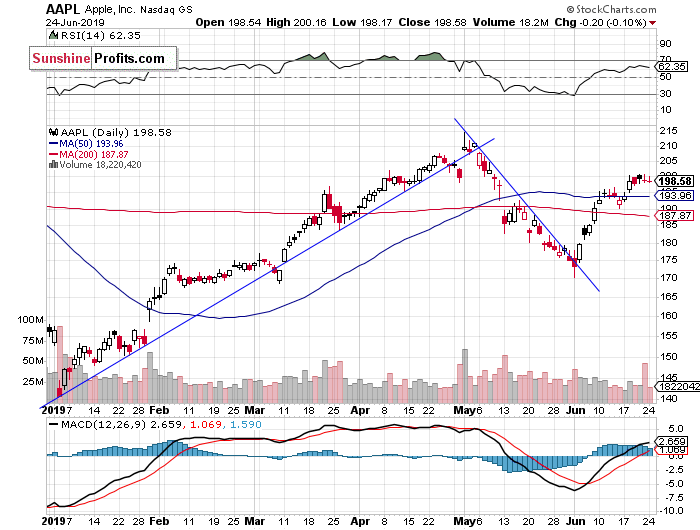
Let's take a look at the Apple, Inc. stock (AAPL) daily chart (chart courtesy of http://stockcharts.com). The stock remains close to the resistance level of $200, following breaking above the downward trend line in the early June. It still looks like an upward correction:
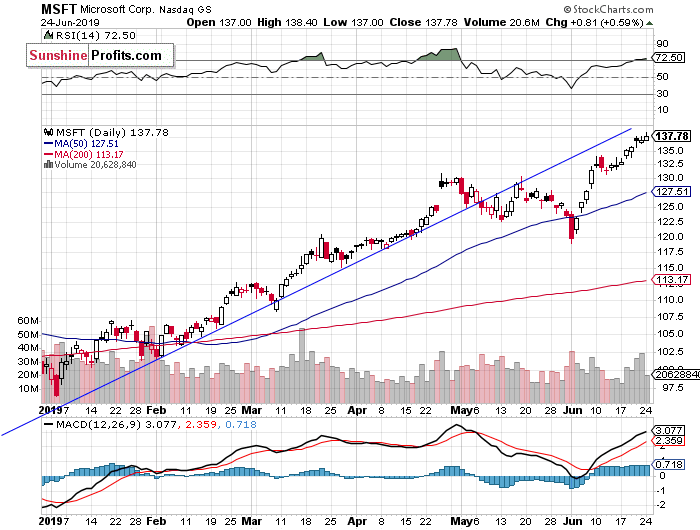
Now let's take a look at the daily chart of Microsoft Corp. (MSFT). The stock reached the new record high of $138.40 yesterday. It broke above the short-term consolidation last week. But will it continue upwards? We could see another profit-taking action at some point. The resistance level is at around $140, marked by the previous medium-term upward trend line:
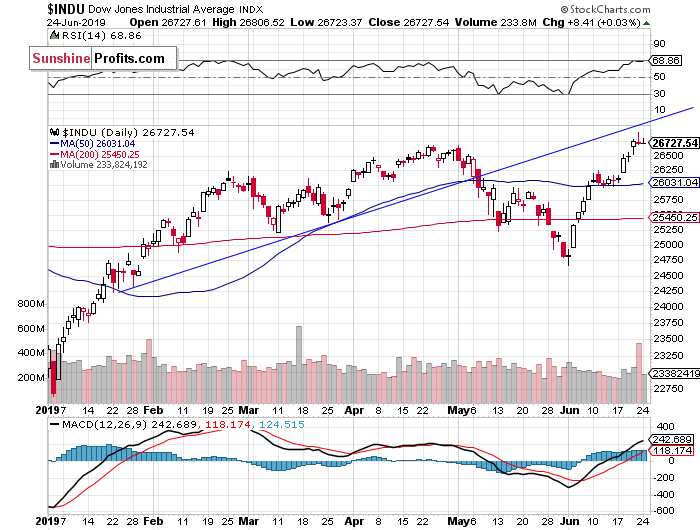
Dow Jones - Narrow Trading Range
The Dow Jones Industrial Average has been relatively weaker than the broad stock market since February. The resistance level remained at around 26,800-27,000, marked by the last year's topping pattern and the record high of 26,951.8. On Friday the index reached the new medium-term high, following breaking above its late April consolidation. However, it remains below the last year's all-time high:
The S&P 500 index reached the new record high on Friday, before reversing its upward course and closing slightly lower. So was it a downward reversal or just a quick profit-taking action before another leg higher? We could see some more volatility following the recent advances.
Concluding, the S&P 500 index will likely open slightly lower today. Then we may see more short-term fluctuations along the previous medium-term highs and the new record high. Investors will wait for today's economic data releases and a speech from the Fed Chair Powell.
Trading position (short-term; our opinion): no positions are justified from the risk/reward perspective.
Thank you.
Paul Rejczak
Stock Trading Strategist
Sunshine Profits - Effective Investments through Diligence and Care

