

Trading position (short-term; our opinion): Short position with the downside target of 2,840 (S&P 500 index) remains justified from the risk/reward perspective. However, the outlook may change if the index breaks above the resistance level of 2,980-3,000.
Intraday outlook: The broad stock market will likely open virtually flat today. We may see some more short-term volatility following yesterday's advance.
The U.S. stock market indexes gained between 0.4% and 1.1% on Monday, breaking above their short-term consolidation, as investors reacted to the G20 Osaka Summit outcomes. The S&P 500 index reached the new record high of 2,977.93. The index gained almost 250 points from its early June local low of around 2,729. But then it came back to the previous high of around 2,964. The Dow Jones Industrial Average gained 0.4% and the Nasdaq Composite gained 1.1% on Monday.
The nearest important resistance level of the S&P 500 index is now at 2,980-3,000. On the other hand, the support level is at 2,945-2,955, marked by yesterday's daily gap up of 2,943.98-2,952.22. The next support level is at around 2,930.
The broad stock market broke above its previous Friday's record high yesterday and the S&P 500 index got even closer to the 3,000 mark. However, it remains relatively close to the previous medium-term local highs. And there is still no real bullish breakout above the last year's September-October topping pattern:
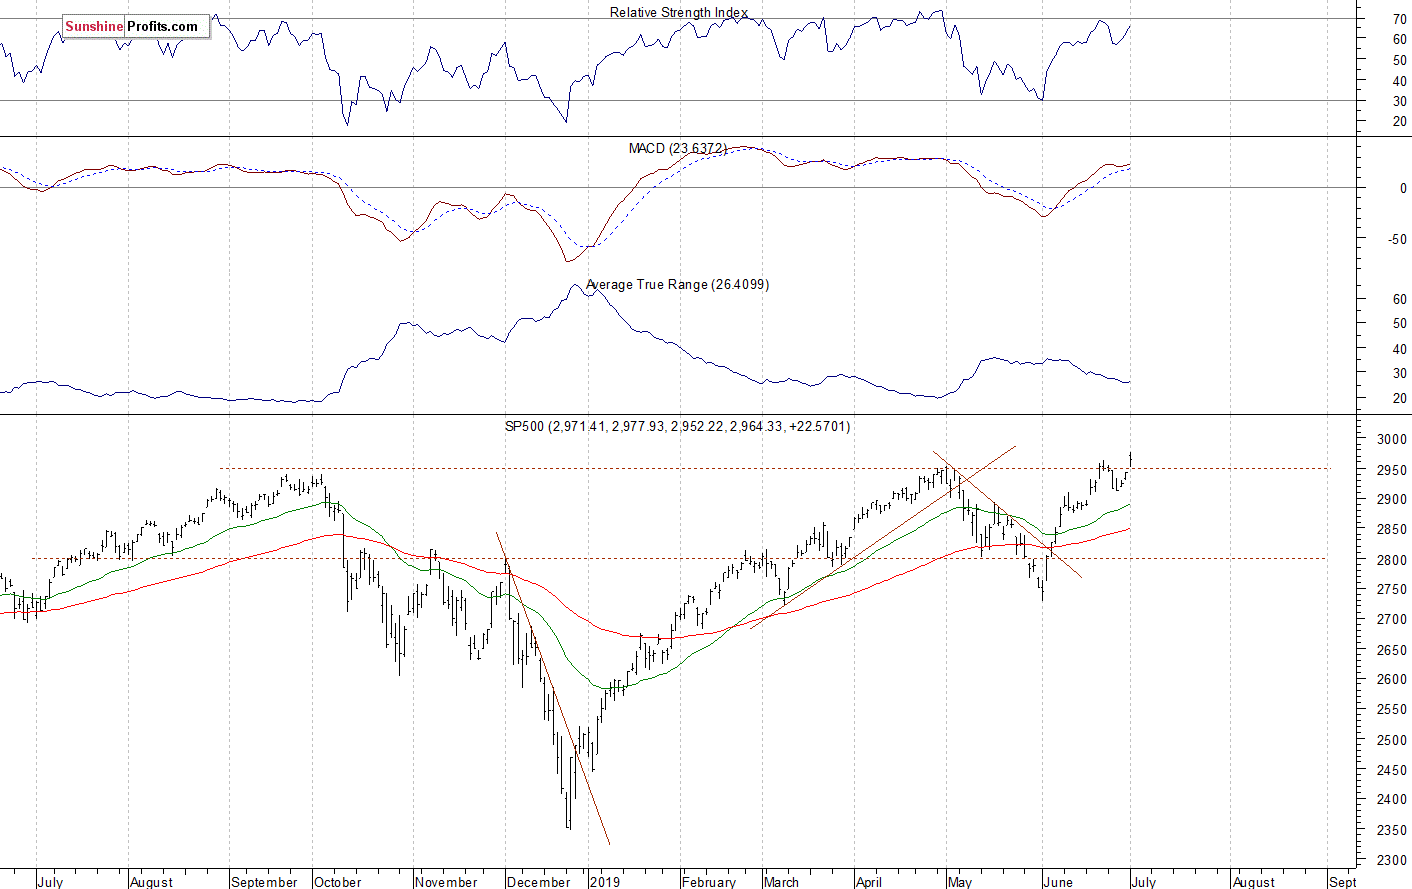
Flat Expectations, Topping Pattern?
The index futures contracts trade between -0.1% and -0.2% vs. their Monday's closing prices, so expectations before the opening of today's trading session are virtually flat to slightly negative. The European stock market indexes have been mixed so far. There will be no new important economic data announcements today.
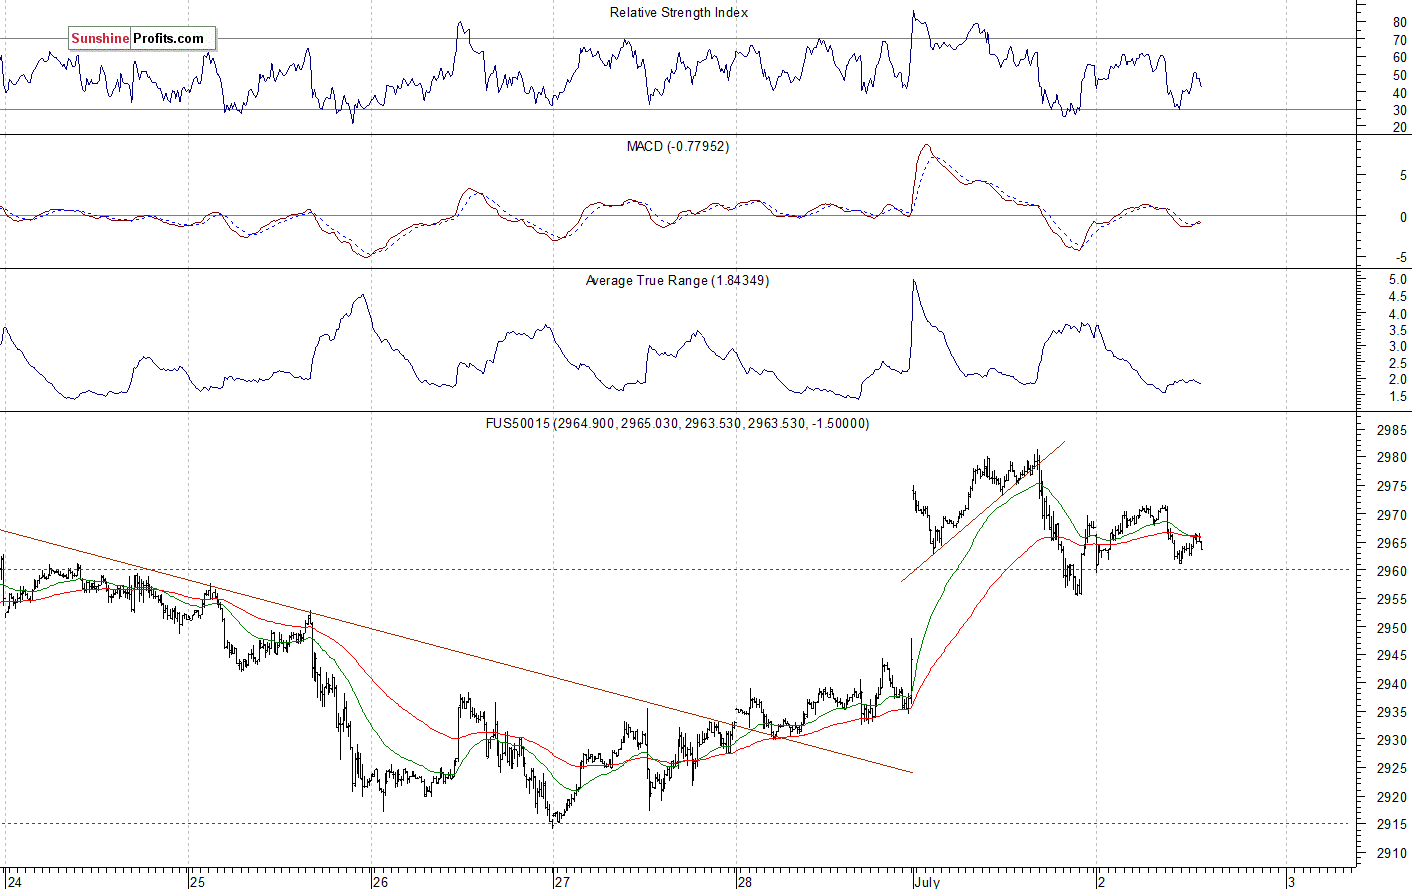
The S&P 500 futures contract trades within an intraday consolidation, as it remains relatively close to the new record high. The nearest important resistance level is at 2,980-3,000. On the other hand, the support level is at 2,950-2,960, marked by the previous resistance level. The futures contract is just above its previous local highs, as the 15-minute chart shows:
Nasdaq Remains Close to 7,800
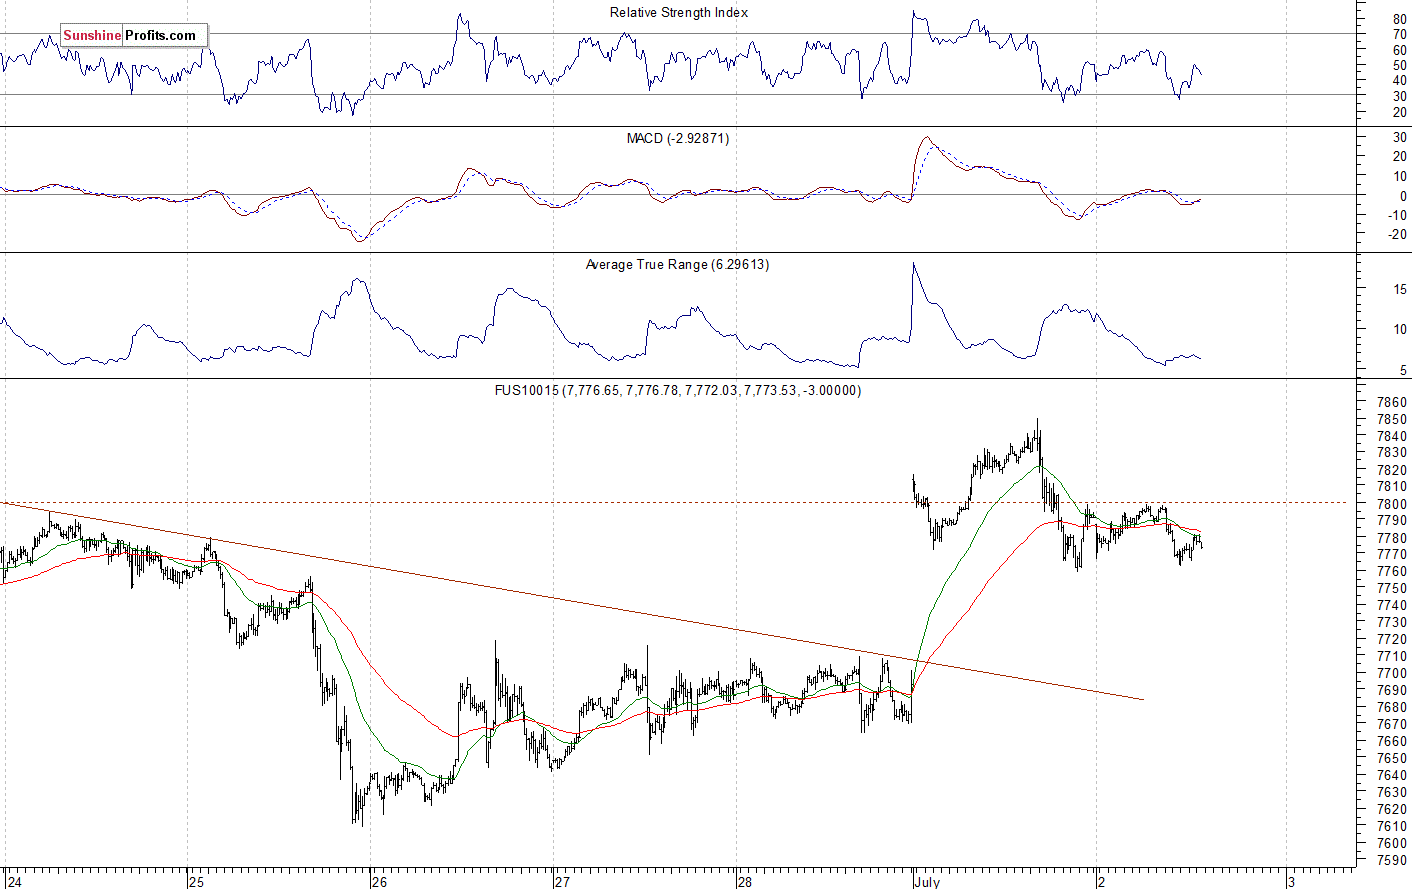
The technology Nasdaq 100 futures contract follows a similar path, as it trades within an intraday consolidation. The nearest important resistance level is at 7,800-7,900, marked by the late April record high. On the other hand, the support level is at 7,700-7,750. The Nasdaq futures contract extends its short-term fluctuations this morning, as we can see on the 15-minute chart:
Apple Breaking Higher?
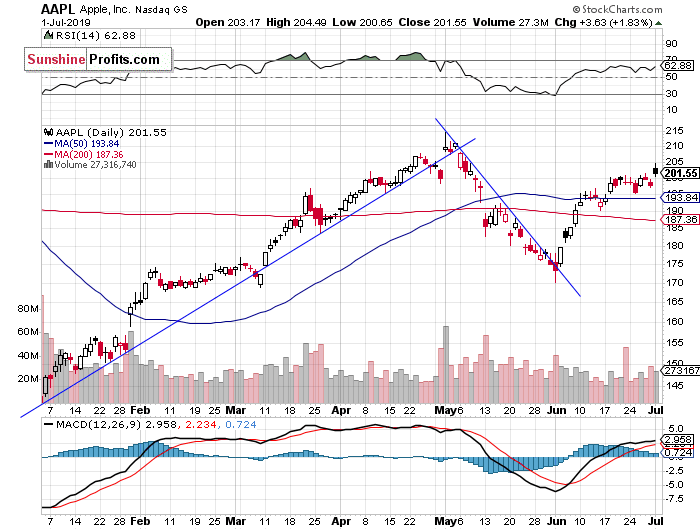
Let's take a look at the Apple, Inc. stock (AAPL) daily chart (chart courtesy of http://stockcharts.com). The stock broke slightly above the resistance level of $200 yesterday. However, we saw an intraday profit-taking action. The resistance level is now at $210-215, and the support level is at around $195:
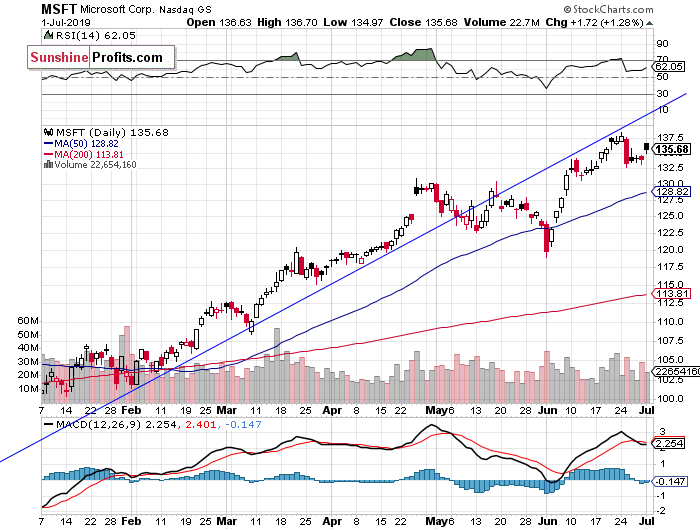
Now let's take a look at the daily chart of Microsoft Corp. (MSFT). The stock reached the new record high of $138.40 on the previous Monday, following breaking above the short-term consolidation. But last week's Tuesday's trading session was bearish, as the price fell to the previous short-term consolidation. For now, it looks like a consolidation:
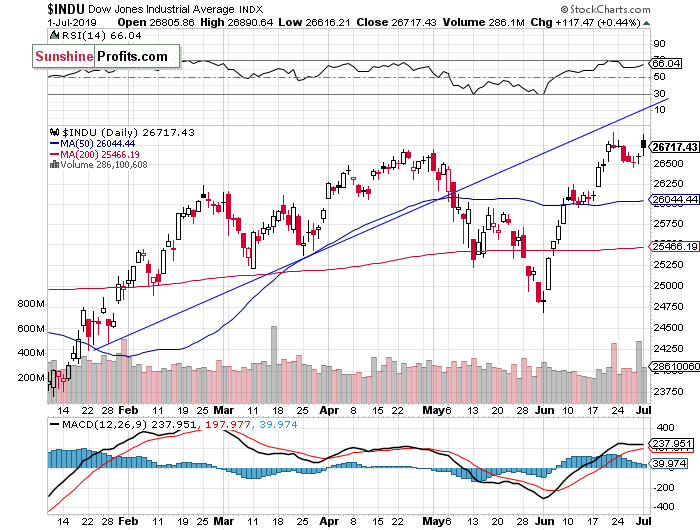
Dow Jones Below Previous High
The Dow Jones Industrial Average has been relatively weaker than the broad stock market since February. The resistance level remained at around 26,800-27,000, marked by the last year's topping pattern and the record high of 26,951.8. On the previous Friday the index reached the new medium-term high, following breaking above its late April consolidation. However, then it retraced the recent advance. And it failed to break higher yesterday:
The S&P 500 index reached the new record high yesterday, as investors reacted to the G20 Osaka Summit outcomes. Will the uptrend continue? We may see some more short-term uncertainty following bouncing off the mentioned resistance level of 2,980-3,000. For now, it looks like a flat correction within an uptrend. However, if the market gets back below the 2,950 support level, we could see more selling pressure.
Concluding, the S&P 500 index will likely open virtually flat today. There may be some uncertainty following the late Friday-early Monday's advance.
Trading position (short-term; our opinion): Short position with the downside target of 2,840 (S&P 500 index) remains justified from the risk/reward perspective. However, the outlook may change if the index breaks above the resistance level of 2,980-3,000.
Thank you.
Paul Rejczak
Stock Trading Strategist
Sunshine Profits - Effective Investments through Diligence and Care

