

Dear Subscribers,
The frequency of the analyses provided by Matthew Levy, CFA decreased to just 1x per week in April and based on the agreement between us, there was supposed to be one final analysis posted by Matthew Levy, CFA last Friday (Apr. 30). Unfortunately, due to urgent personal matters, Matthew has not been able to provide his final analysis up to this day.
As the Editor-in-Chief, I apologize to you for this inconvenience, and I think that the individual positions that were previously mentioned by Matthew Levy, CFA can now (in my opinion) be closed.
Some things are beyond my control, and I promise to deliver on what does depend on me. In the case of our Stock Trading Alerts, what does depend on me is to provide you with superb-quality analyses by finding great talent combined with extensive experience. And I’m happy to announce that, today, we’re delivering on this promise.
Namely, I’m pleased to announce Rafael Zorabedian as the new author of the Stock Trading Alerts.
After spending years as an active trader across several capital markets, Rafael earned his stripes as a former futures and options broker specializing in equity indices, energies, metals, and softs. He prides himself on identifying potential opportunities that feature a “confluence of indicators”. In addition to featuring a technically analytic approach, Rafael is in tune with the macroeconomic themes that influence pricing across many markets.
Best regards,
Przemyslaw Radomski, CFA
Founder, Editor-in-chief
Hello everyone! I’m Rafael Zorabedian, it’s a pleasure to be here, and I look forward to sharing my perspective on the markets with you via the Stock Trading Alerts. Please don’t hesitate in asking me questions… throw them my way! And because I’m here to share my knowledge with you, if there’s something that you’d like me to cover or to expand upon, please let me know.
To start, I felt it would only be appropriate to get into the granddaddy of all indices; the S&P 500. The ES, Spoo, e-mini, SPY, or whatever you want to call it, has been nothing short of spectacular since the pandemic lows in March 2020. Sometimes, as a trader, it can be challenging to get too excited about uptrends that have lasted this long. A trader may look at the chart and want to short the living daylights out of it, and rightfully so. With valuations seemingly stretched near a P/E ratio (north of 42 at the time of this writing) along with some seasonal tendencies for a slower summer, getting on the short side of the trade can be a gnawing thought - and with perfect timing, could be an excellent idea.
However, shorting this market has been brutal for short-sellers - and that is putting it lightly. The old adage of “the trend is your friend” has been a good one and has stood the test of time.
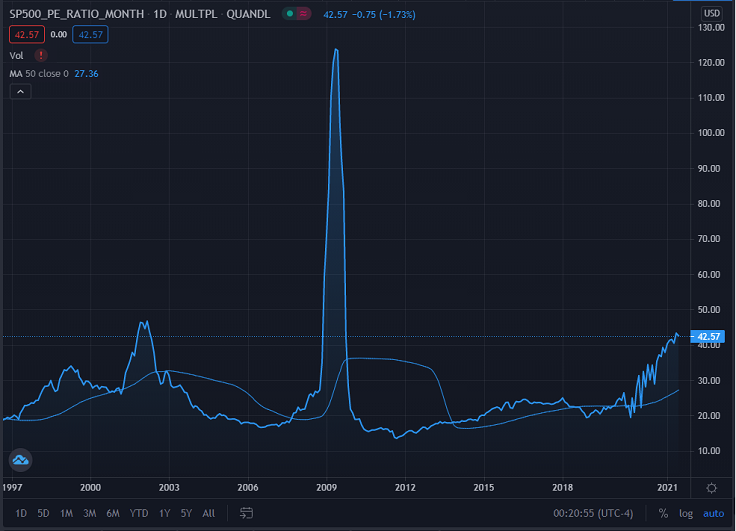
Figure 1 - S&P 500 Index P/E Ratio ~ 1974 - May 2021 Source: Quandl data via tradingview.com
Notice the potential head and shoulders formation that could be brewing in the super long-term in the S&P 500 P/E ratio.
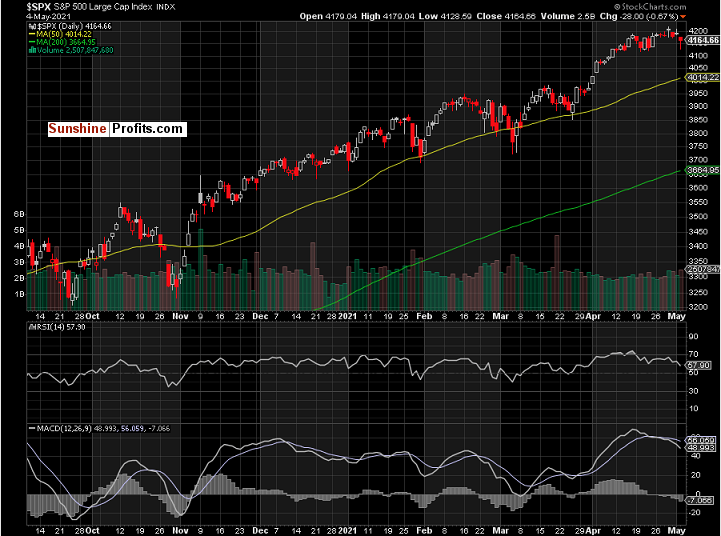
Figure 2 - S&P 500 Index (SPX) Daily Candles November 12, 2020 - May 4, 2021. Source stockcharts.com
Here we can see what every market bull would want to see; a chart moving from the lower left to the upper right. Looking at some daily technical indicators, we finally saw a bearish daily MACD crossover a couple of sessions ago, with the fast line crossing the slow line. In addition, we have seen some doji looking tops and inverted hammers over the last week forming on the daily candles. Those could be interpreted as short-term reversal indicators.
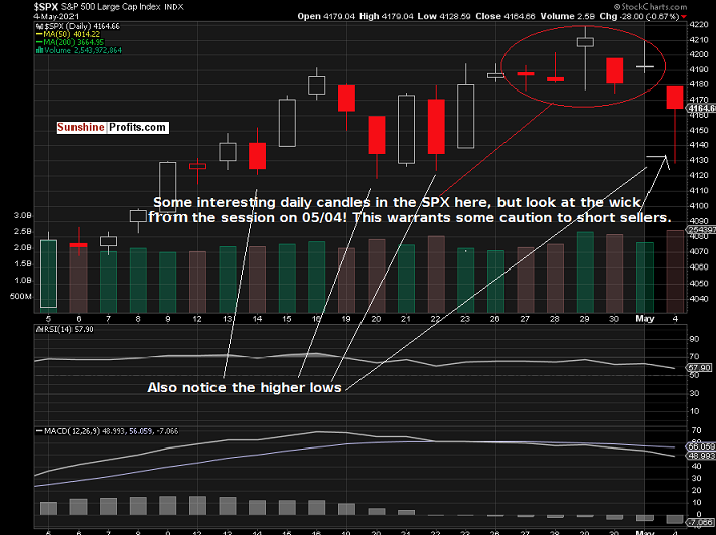
Figure 3 - S&P 500 Index (SPX) Daily Candles April 5th, 2021 - May 4, 2021. Source stockcharts.com
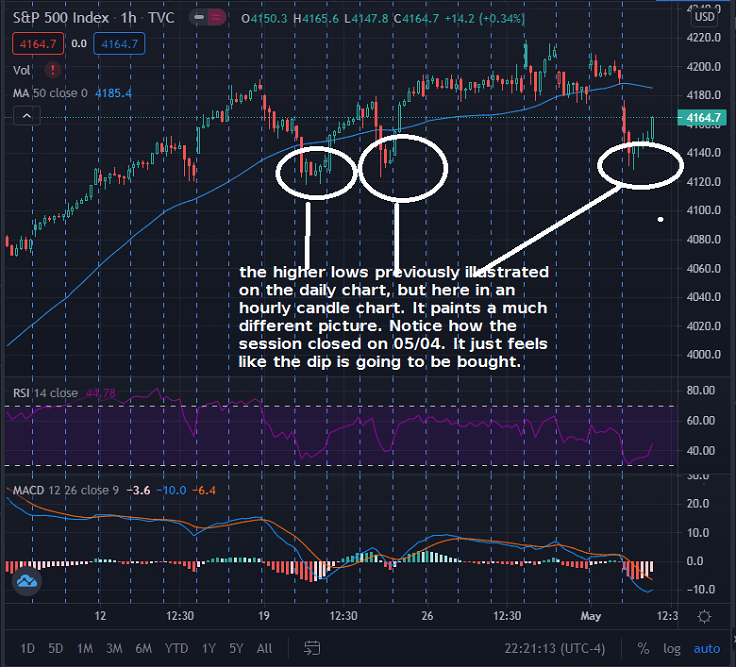
Figure 4 - S&P 500 Index (SPX) Daily Candles April 5th, 2021 - May 4, 2021. Source stockcharts.com
So, here we have what I like to call “contradictory indicators.” On one side, we have this massive long-term uptrend that is firmly in place, with new highs happening repeatedly. On the other side, and in the short term, we see some daily candles that are potential reversal indicators: a bearish MACD crossover combined with some higher lows in place on the daily candles.
It becomes clear, after adding everything together, that a mixed picture is painted for this broader index at this time. Recent pullbacks have been buying opportunities. The Federal Reserve’s “easy money” policy keeping interest rates “lower for longer” has continued and was reiterated in the most recent Fed meeting. It seems that this market would require a surprising catalyst to have any major downward moves at this moment.
For me, the combination of the above data hints towards sideways price action in a market that doesn’t seem to want to go lower. I am focusing on buying pullbacks in a market that is trending in this fashion. Shorter-term traders could be more aggressive and buy on higher lows being made, say to 4,130 or so with a 4,200 target. However, I prefer to wait for an entry point near the 50-day moving average which is currently near 4,000 - 4,014, since it has provided solid entries on two out of three of the last attempts. A quick break of 4,000 in the 3,990s comes to mind while seeing how the trading would occur intraday. As this is 164 points away from current levels, patience would be key for this entry.
To sum up the current viewpoint and opinion:
I have a BUY call for:
- S&P 500 (SPX): but ONLY on a pullback to, or below the 50-day moving average (currently 4014) making the suggested range for entry 3990 - 4014. A close below the 50-day moving average on a given day is a suggested stop loss level. Adjust stop level for your own risk tolerance.
Thank you.
Rafael Zorabedian
Trading Strategist

