

Briefly:
Intraday trade: Our Monday's neutral intraday outlook has proved accurate. The S&P 500 index extended its consolidation along the level of 2,500, as it remained close to record high. The market may retrace some of its recent uptrend following yesterday's bounce off support level marked by the September 12 daily gap up of 2,488.95-2,490.37. Therefore, intraday short position is favored. Stop-loss is at the level of 2,507, slightly below record high. Potential profit target is at 2,480 (S&P 500 index).
Medium-term trade: In our opinion, short position is favored (opened on June 5 at 2,437.83, with stop-loss at 2,530, and profit target at 2,300, S&P 500 index).
Our intraday outlook is bearish today, and our short-term outlook is bearish, as we expect downward correction. Our medium-term outlook remains bearish:
Intraday outlook (next 24 hours): bearish
Short-term outlook (next 1-2 weeks): bearish
Medium-term outlook (next 1-3 months): bearish
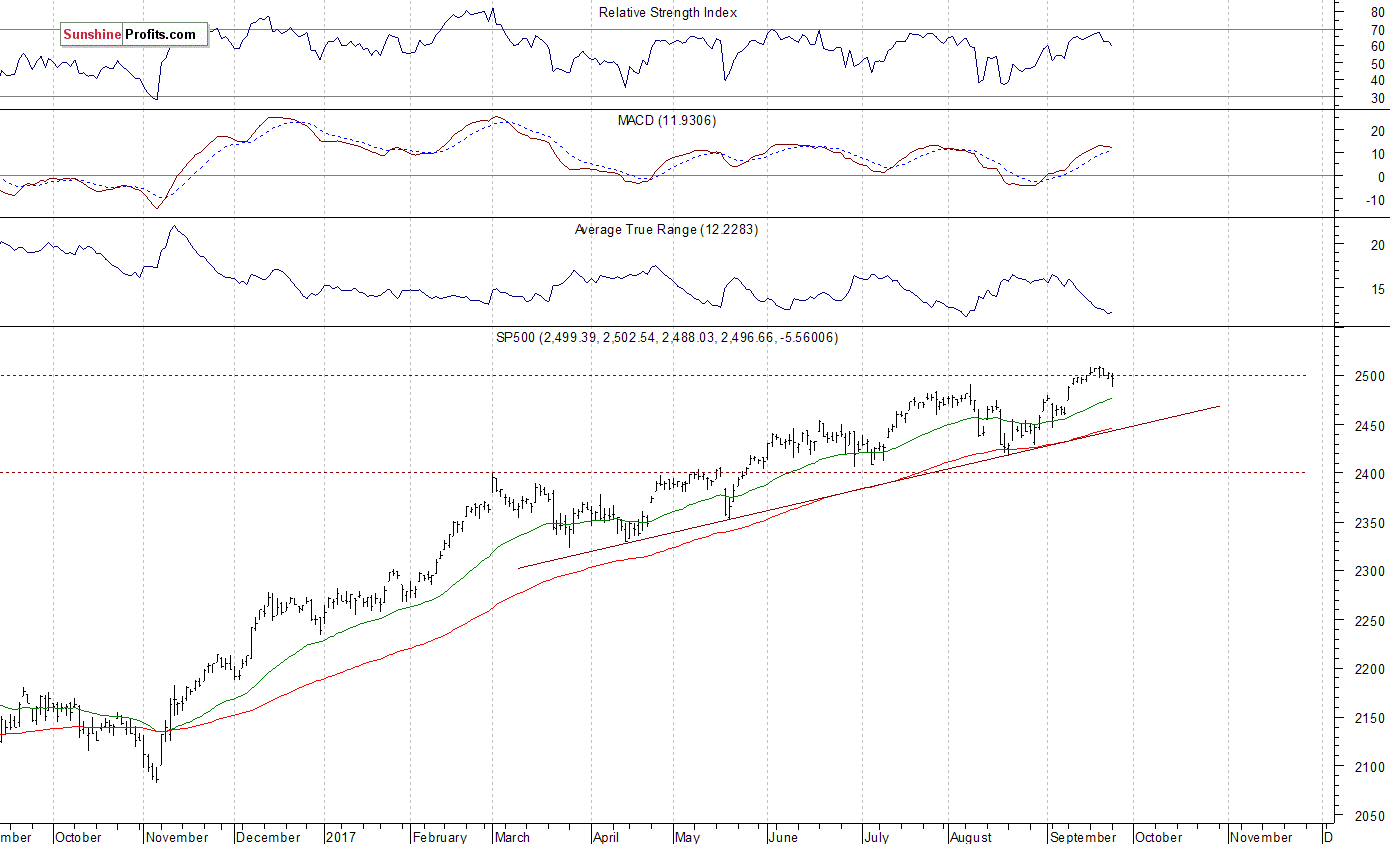
The main U.S. stock market indexes lost between 0.2% and 0.9% on Monday, retracing some of their recent move up, as investors' sentiment slightly worsened following global stock markets weakness. The S&P 500 index remains close to 2,500 mark and its last week's Wednesday's new record high of 2,508.85 The Dow Jones Industrial Average retraced some of its recent advance, as it got away from last Thursday's new record high of 22,419.51. The technology Nasdaq Composite was relatively weaker than the broad stock market. It broke below its recent consolidation, and closed around 1.7% below last week's Monday's new all-time high of 6,477.77. The nearest important level of resistance of the S&P 500 index remains at 2,510. On the other hand, support level is at 2,490, marked by the September 12 daily gap up of 2,488.95-2,490.37, among others. The next support level remains at 2,465-2,475, marked by the September 11 daily gap up of 2,467.11-2,474.52. The level of support is also at 2,460, marked by previous short-term consolidation. The S&P 500 index continued its long-term uptrend, as it reached new record highs above the level of 2,500. It was gaining despite some short-term technical overbought conditions. We still can see medium-term negative technical divergences, but will they lead to a downward correction?
No Clear Direction
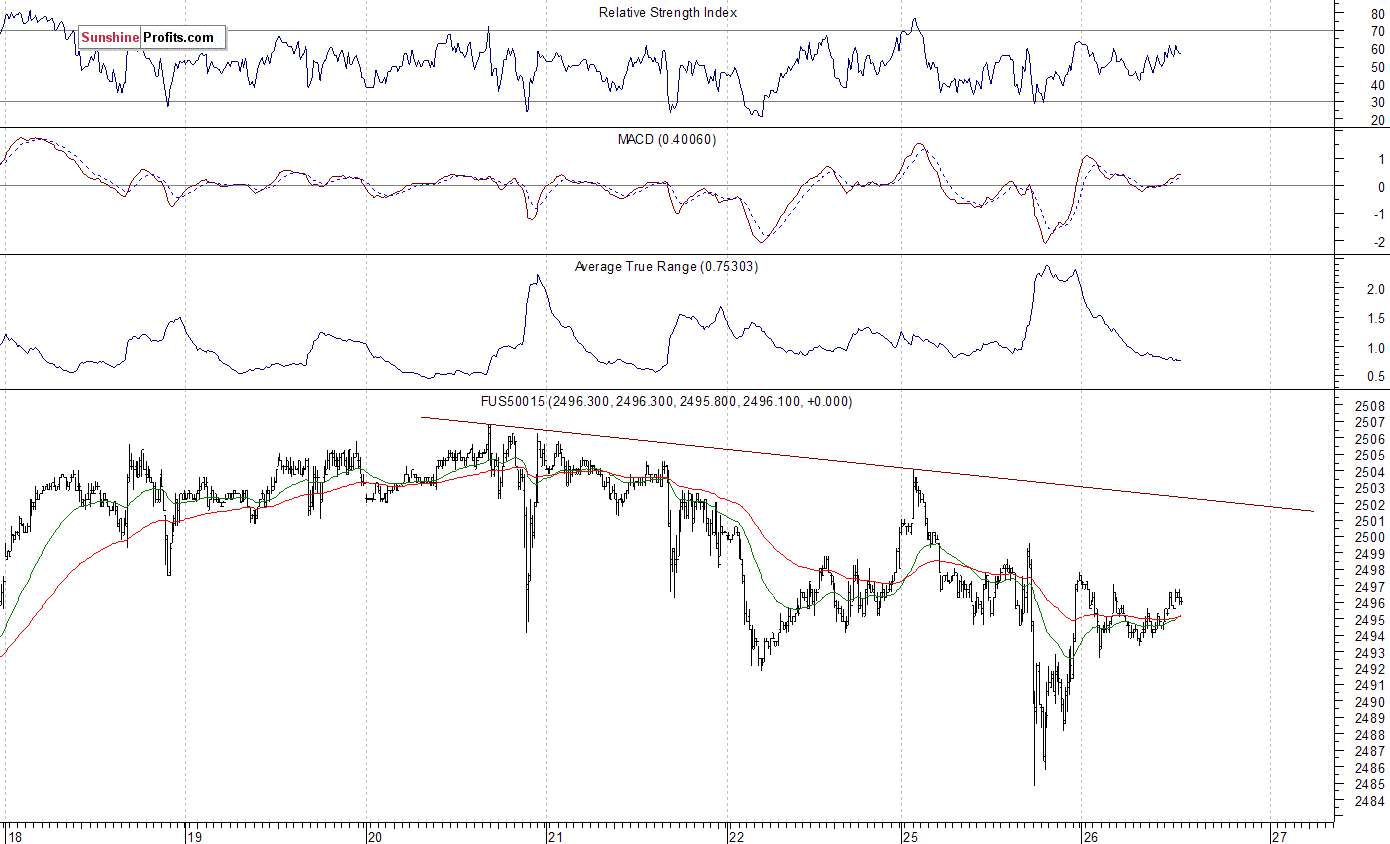
Expectations before the opening of today's trading session are mixed, with index futures currently between -0.05% and +0.1% vs. their Monday's closing prices. The European stock market indexes have been mixed so far. Investors will now wait for some economic data announcements: Consumer Confidence, New Home Sales at 10:00 a.m. The market expects that the Conference Board Consumer Confidence number was at 119.9 in September. The S&P 500 futures contract trades within an intraday consolidation following overnight move up. The nearest important level of resistance remains at around 2,500-2,510. On the other hand, support level is at 2,485-2,490, marked by previous level of resistance. The next support level is at 2,480, marked by short-term consolidation. The support level is also at 2,465-2,470, among others. The futures contract trades within a short-term consolidation along 2,500 mark, as we can see on the 15-minute chart:
Nasdaq Still Weaker
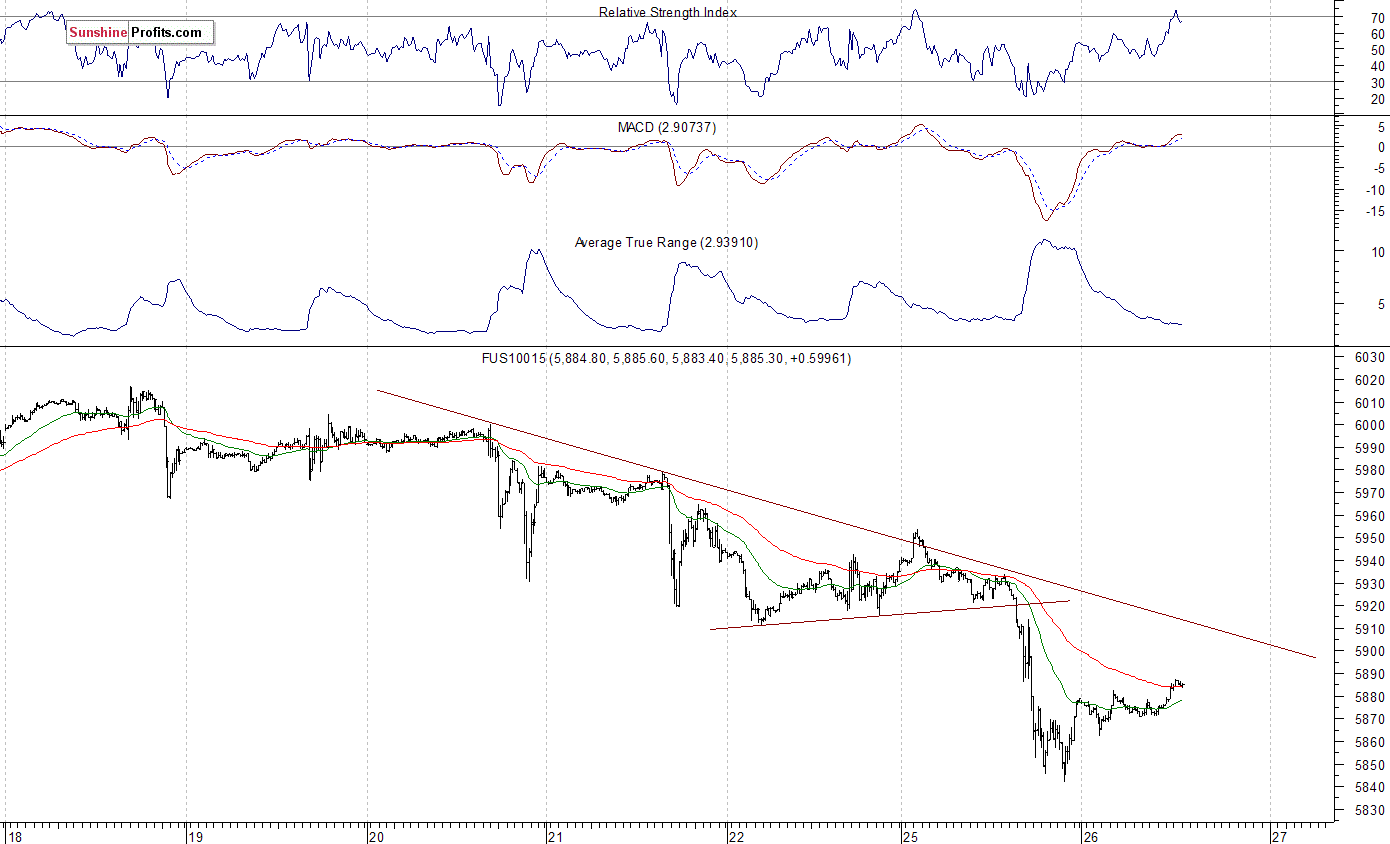
The technology Nasdaq 100 futures contract trades within an intraday uptrend, as it retraces some of its yesterday's move down. The nearest important level of support is at around 5,840-5,850, marked by yesterday's daily lows. The next support level is at 5,780-5,800. On the other hand, level of resistance is at 5,900-5,920, marked by recent fluctuations. The next important resistance level is at 5,950, marked by short-term local highs. The Nasdaq futures contract bounces following yesterday's decline. It trades below slightly descending downward trend line, as the 15-minute chart shows:
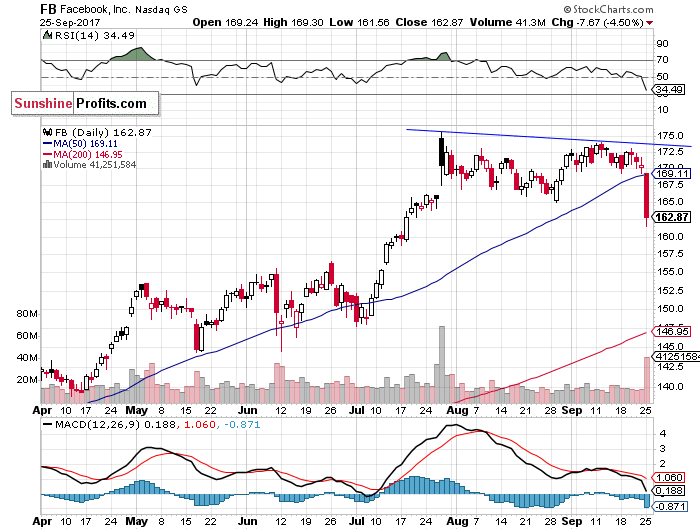
Let's take a look at Facebook, Inc. stock (FB) daily chart (chart courtesy of http://stockcharts.com) again. It was relatively weak yesterday, as it broke below its recent trading range. This big cap tech stock fell the lowest since half of July. Is this a new downtrend or just downward correction following months-long bull market? The nearest important support level is at around $150-$155, marked by previous consolidation:
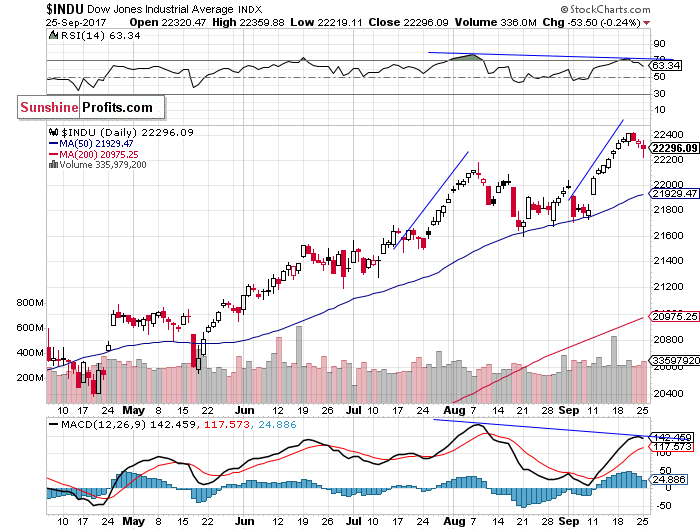
Now, let's take a look at the Dow Jones Industrial Average daily chart (chart courtesy of http://stockcharts.com). The blue-chip index retraced more of its recent move up, as it got away from last Thursday's new record high. It was relatively stronger than the broad stock market recently. Is this an uptrend reversal? We still can see some negative technical divergences, along with topping pattern:
Concluding, the S&P 500 index lost 0.2% yesterday, as it extended its short-term consolidation along record highs. Is this a topping pattern or just another flat correction within an uptrend? Will the broad stock market retrace more of its September advance? We still can see medium-term overbought conditions along with negative technical divergences.
We continue to maintain our medium-term short position (opened at 2,437.83 on June 5 - opening price of the S&P 500 index). We decided to move our stop-loss level up for the first time on Thursday, to the level of 2,530 (from 2,510). This will be the final stop-loss for this trade. Potential profit target remains at 2,300 (S&P 500 index). One can trade S&P 500 index using futures contracts (S&P 500 futures contract - SP, E-mini S&P 500 futures contract - ES) or an ETF like the SPDR S&P 500 ETF - SPY. It is always important to set some exit price level in case some events cause the price to move in the unlikely direction. Having safety measures in place helps limit potential losses while letting the gains grow.
To summarize: medium-term short position in S&P 500 index is justified from the risk/reward perspective with the following entry prices, stop-loss orders and profit target price levels:
Intraday trade:
S&P 500 index - short position: profit target level: 2,480; stop-loss level: 2,507,
S&P 500 futures contract (September) - short position: profit target level: 2,477; stop-loss level: 2,504
SPY ETF (SPDR S&P 500, not leveraged) - short position: profit target level: $248.0; stop-loss level: $250.7
Medium-term trade:
S&P 500 index - short position: profit target level: 2,300; stop-loss level: 2,530
S&P 500 futures contract (December) - short position: profit target level: 2,297; stop-loss level: 2,527
SPY ETF (SPDR S&P 500, not leveraged) - short position: profit target level: $230; stop-loss level: $253
SDS ETF (ProShares UltraShort S&P500, leveraged: -2x) - long position: opening price: $50.24; profit target level: $55.92; stop-loss level: $46.46
Thank you.
Paul Rejczak
Stock Trading Strategist
Stock Trading Alerts

