

Briefly:
Intraday trade: The S&P 500 index gained 0.2% on Wednesday, after opening 0.2% higher. So our yesterday's intraday outlook proved quite accurate. The stock market will probably open slightly lower today. It may extend the short-term consolidation. Therefore, we prefer to be out of the market, avoiding low risk/reward ratio trades.
Medium-term trade: In our opinion, no medium-term positions are justified.
Our intraday outlook is neutral. Our short-term outlook is neutral, and our medium-term outlook is neutral:
Intraday outlook (next 24 hours): neutral
Short-term outlook (next 1-2 weeks): neutral
Medium-term outlook (next 1-3 months): neutral
The U.S. stock market indexes were mixed between -0.2% and +0.7% on Wednesday, as investors hesitated following recent fluctuations. The S&P 500 index slightly extended its yesterday's rebound off support level and it currently trades 3.6% below the January's 26th record high of 2,872.87. The Dow Jones Industrial Average lost 0.2%, as it was still relatively weaker than the broad stock market, and the technology Nasdaq Composite gained 0.7% on Wednesday.
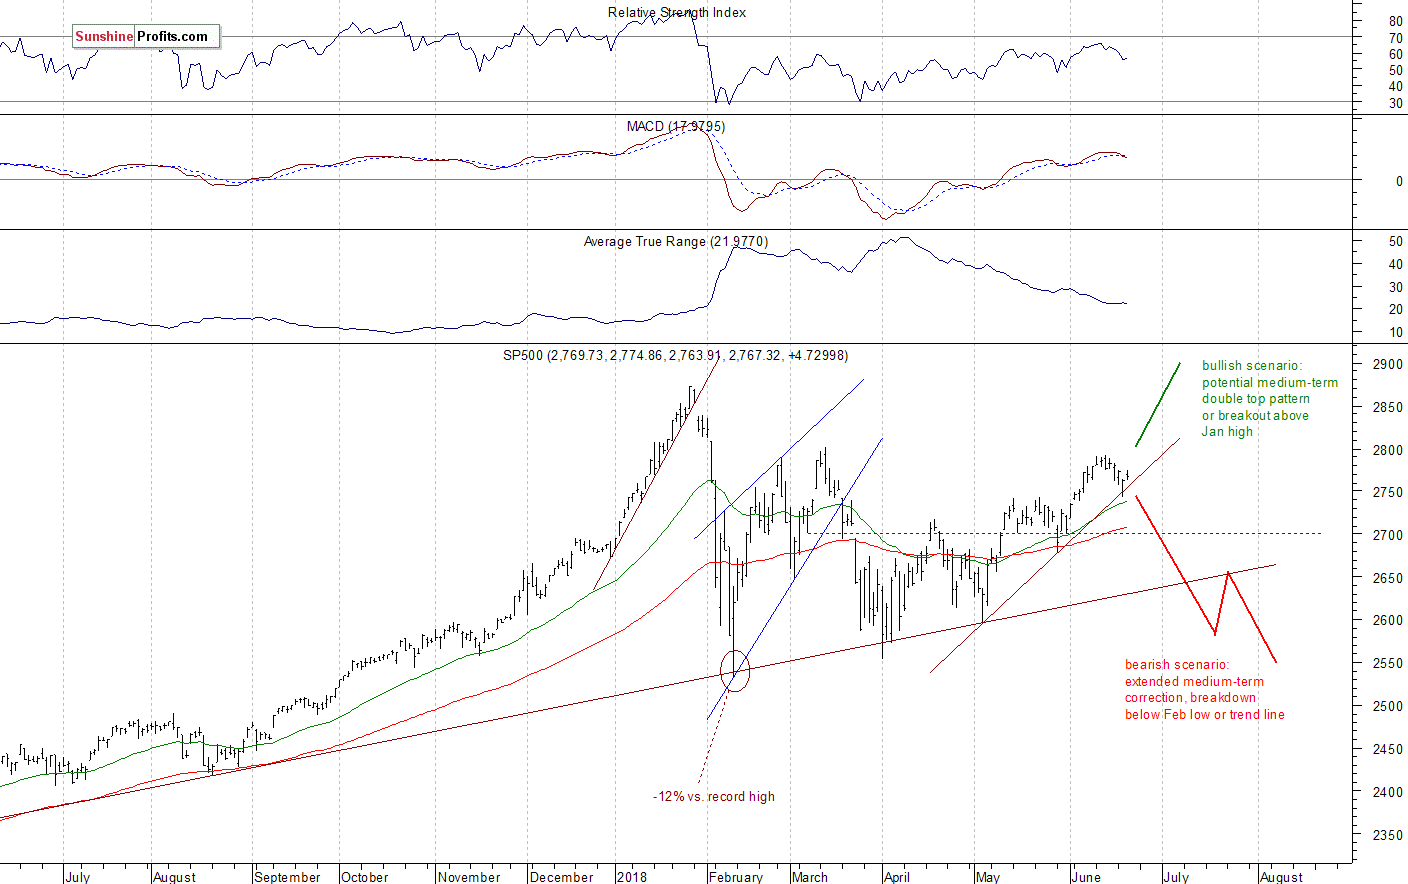
The nearest important level of resistance of the S&P 500 index remains at around 2,780-2,800, marked by the recent local highs along with the mid-March local high. The resistance level is also at 2,830-2,840, marked by the late January short-term consolidation. On the other hand, support level is at 2,750-2,755, marked by the previous level of resistance and yesterday's daily low. The next important level of support is at 2,735-2,740, marked by June the 4th's daily gap-up of 2,736.93-2,740.54. The support level is also at 2,700-2,720.
The broad stock market traded within a short-term consolidation recently, as investors took profits off the table following the early June rally. Then the S&P 500 index retraced most of its early June advance. But it has bounced off support level of around 2,750 on Tuesday. Is this a new downtrend or just downward correction? There are still two possible medium-term scenarios - bearish that will lead us below the February low following trend line breakdown, and the bullish one in a form of medium-term double top pattern or breakout towards 3,000 mark. There is also a chance that the market will just go sideways for some time, and that would be positive for bulls in the long run (some kind of an extended flat correction). The S&P 500 index trades along its two-month-long upward trend line:
Futures Slightly Lower
Expectations before the opening of today's trading session are negative, because the index futures contracts trade 0.1-0.2% below their yesterday's closing prices. The main European stock market indexes have been mixed so far. Investors will wait for some economic data releases today: Initial Claims, Philadelphia Fed number at 8:30 a.m, Leading Indicators at 10:00 a.m. The broad stock market will likely retrace some of its recent advance today. For now, it looks like a short-term consolidation following the early June rally. Is this a topping pattern or just a relatively flat correction before another leg up? It's hard to say, but for now it looks like a correction within an uptrend.
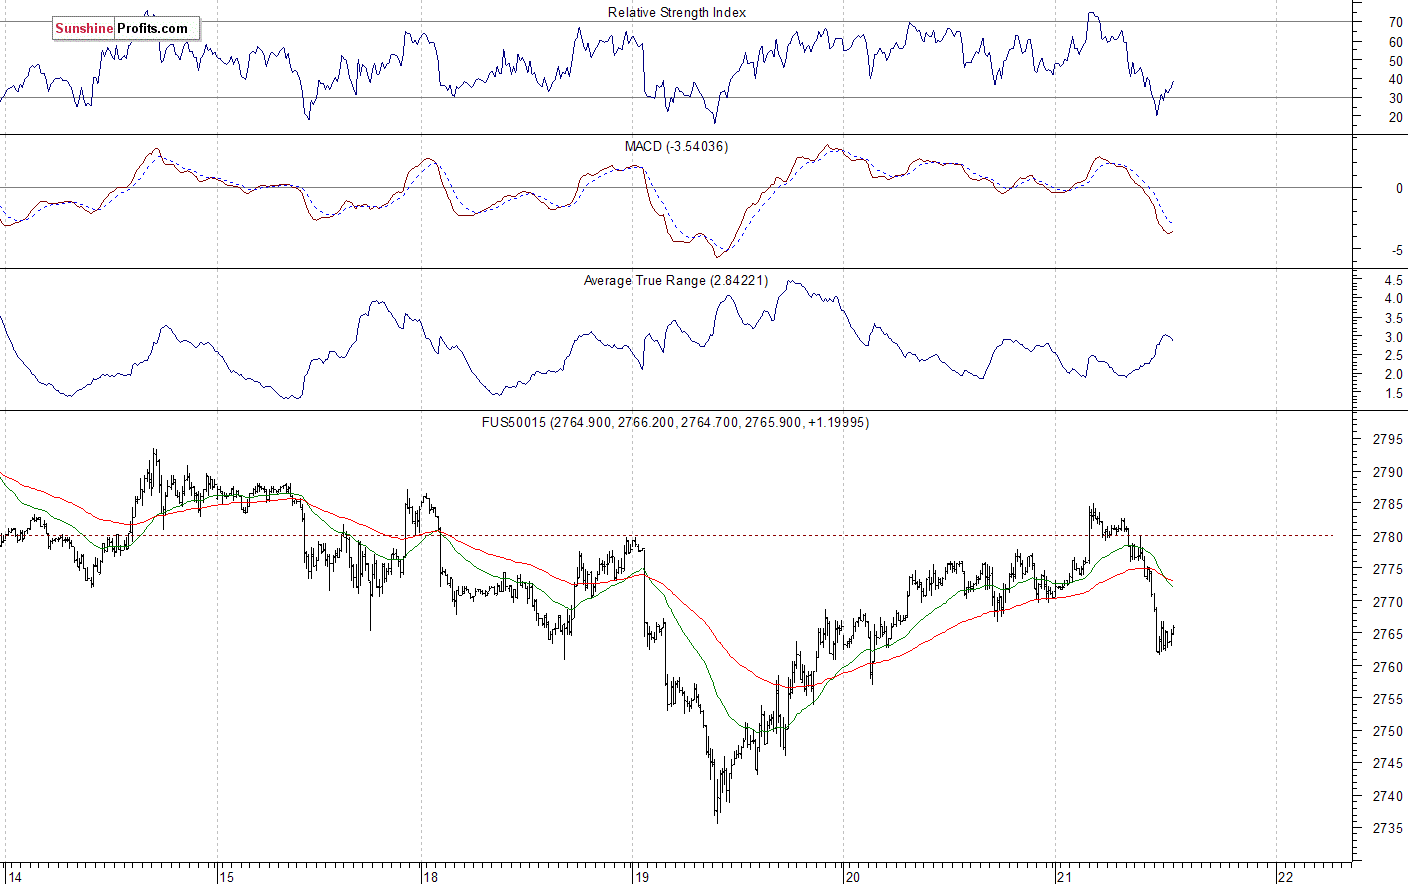
The S&P 500 futures contract trades within an intraday downtrend, as it retraces its overnight advance. The nearest important level of resistance remains at 2,780-2,785, marked by local highs. The level of resistance is also at 2,790-2,800. On the other hand, level of support is at 2,755-2,760, marked by the recent local lows. The next support level is at 2,740-2,750. The futures contract bounced off its recent local highs, as the 15-minute chart shows:
Nasdaq Backs Off from New Record High
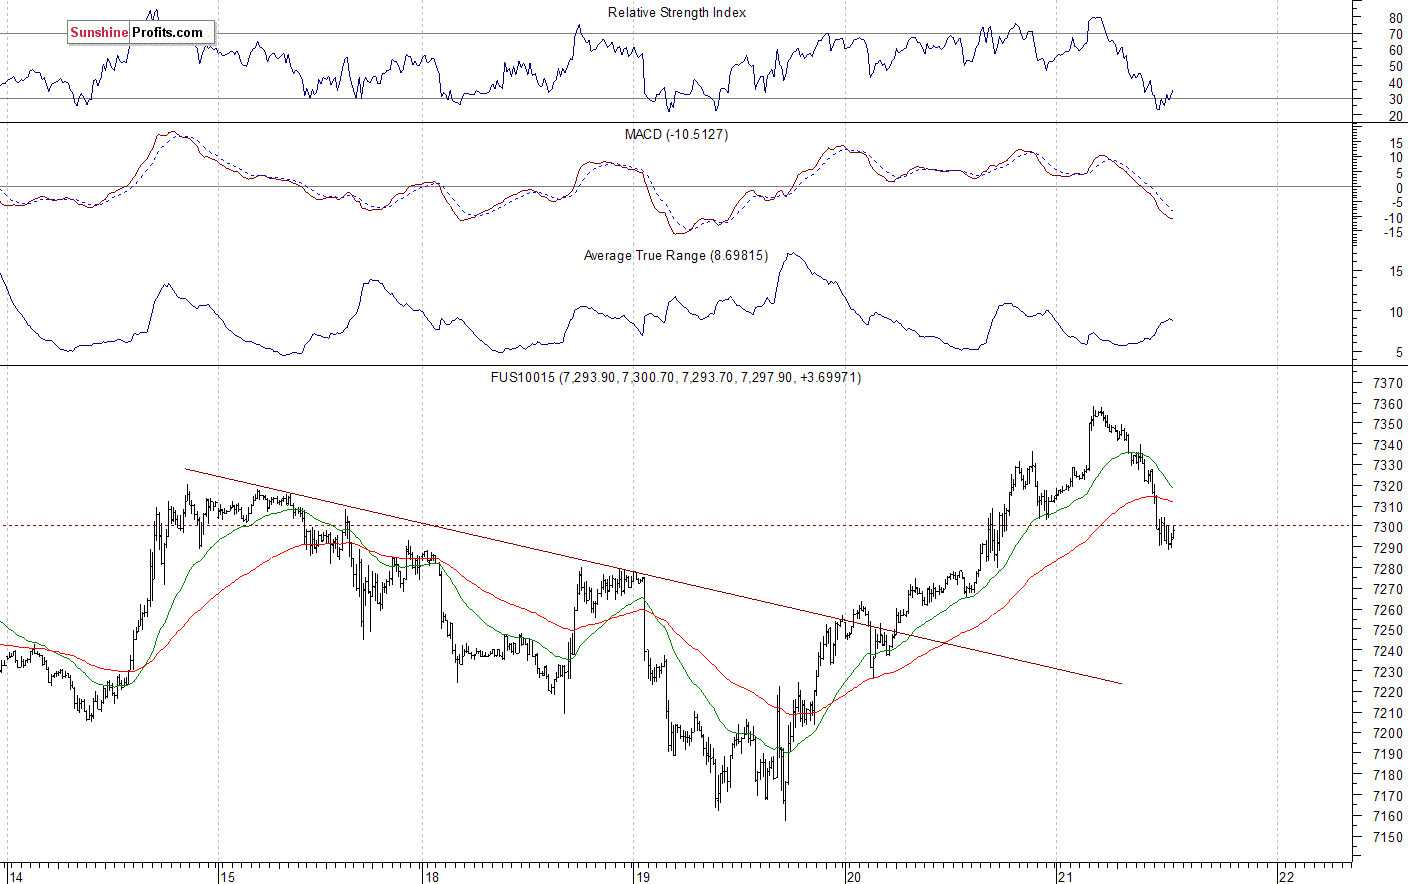
The technology Nasdaq 100 futures contract follows a similar path, as it retraces its overnight advance. The market reached new record high above the level of 7,350, and it currently trades along 7,300 mark. The nearest important resistance level is at around 7,350. On the other hand, level of support is at 7,200-7,250, among others. The Nasdaq futures contract trades just below its new all-time high, as we can see on the 15-minute chart:
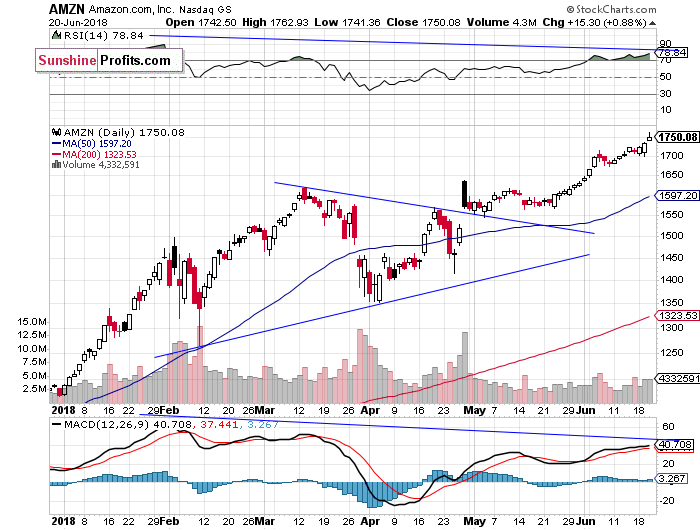
Amazon - Yet Another New Record High, Apple Still Lower
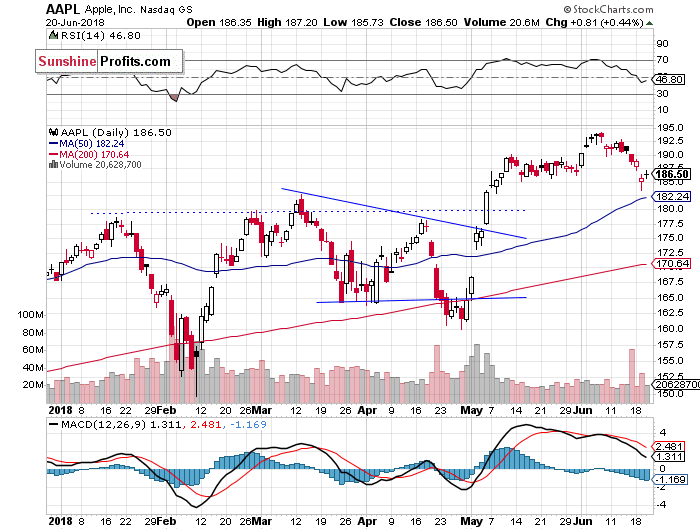
Let's take a look at Apple, Inc. stock (AAPL) daily chart (chart courtesy of http://stockcharts.com). It reached new record high two weeks ago, as it slightly extended its uptrend following a breakout above the price of $190. Then the stock retraced some of its advance, as it fell below $190 again. It continued the short-term downtrend on Tuesday, but then it bounced off support level of around $185, marked by the previous local lows. Will it reverse the decline here? We may see some more short-term fluctuations:
Now let's take a look at Amazon.com, Inc. stock (AMZN) daily chart. It reached another new record high yesterday, as it remained relatively very strong. The nearest important level of support is at around $1,670-1,700, marked by the recent local lows. We still can see some negative technical divergences, but there have been no confirmed negative signals so far:
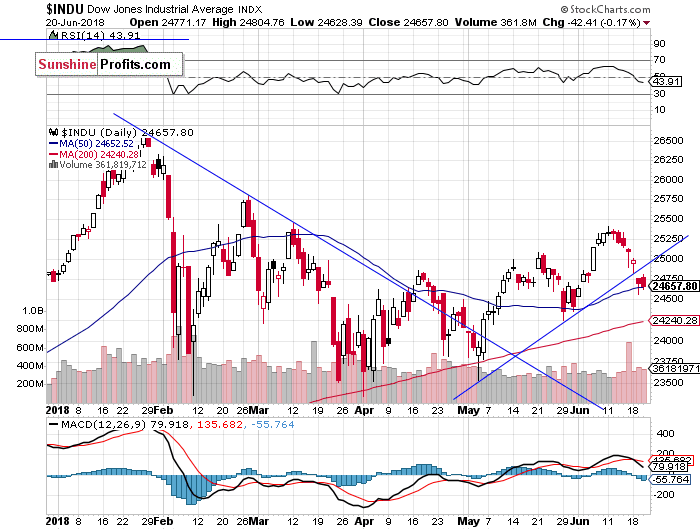
Blue Chip Stocks Remain Relatively Weaker
The Dow Jones Industrial Average broke below its two-month-long upward trend line on Tuesday. Will it continue lower? For now, it looks like some more medium-term sideways price action. However, if DJIA breaks below the support level of around 24,250-24,500, we could see some more selling pressure:
The S&P 500 index will probably open slightly lower today, as investors' sentiment worsens following an overnight advance. Will the downtrend resume? Stocks may continue to fluctuate and we may see some more short-term uncertainty. There have been no confirmed negative signals so far.
Concluding, the broad stock market will likely open slightly lower today following an overnight downward reversal. We may see some more uncertainty, as the S&P 500 index continues to trade below the important resistance level of around 2,780-2,800.
Currently, we prefer to be out of the market, avoiding low risk/reward ratio medium-term trades. We will let you know when we think it is safe to get back in the market.
To summarize: no medium-term positions are justified from the risk/reward perspective at this moment.
Intraday trade:
No intraday position is justified from the risk/reward perspective today.
No medium-term position is justified from the risk/reward perspective at this moment.
Thank you.
Paul Rejczak
Stock Trading Strategist
Stock Trading Alerts

