

Briefly:
Intraday trade: Our yesterday's bearish intraday outlook has proved accurate. The S&P 500 index traded lower following slightly higher opening. However, the market didn't reach our profit target level of 2,425. The S&P 500 index may continue to fluctuate today. There have been no confirmed positive signals so far. On the other hand, the S&P 500 index remains above support level marked by Tuesday's daily gap up. Therefore, we prefer to be out of the market today, avoiding low risk/reward ratio trades.
Medium-term trade: In our opinion, short position is favored (opened on June 5 at 2,437.83, with stop-loss at 2,510, and profit target at 2,300, S&P 500 index).
Our intraday outlook is now neutral, and our short-term outlook remains bearish, as we expect downward correction. Our medium-term outlook remains bearish:
Intraday outlook (next 24 hours): neutral
Short-term outlook (next 1-2 weeks): bearish
Medium-term outlook (next 1-3 months): bearish
The U.S. stock market indexes lost between 0.1% and 0.2% on Thursday, as investors continued to take short-term profits off the table following Tuesday's rally. The S&P 500 index bounced off support level on Tuesday, as it got back to 2,450 mark. It currently trades 2.1% below the August 8 all-time high of 2,490.87. The Dow Jones Industrial Average trades close to the level of 21,800, and the technology Nasdaq Composite is around 2.9% below its record high of 6,460.84. The nearest important level of resistance of the S&P 500 index remains at 2,450-2,455, marked by Tuesday's local high. The next resistance level is at 2,465-2,475, marked by previous support level and local highs. The resistance level is also at 2,490-2,500, marked by the above-mentioned all-time high. On the other hand, support level is at 2.430-2,435, marked by Tuesday's daily gap up of 2,430.58-2,433.67. The next support level remains at 2,400-2,420. The market retraced some of its recent downtrend on Tuesday, but failed to extend its short-term uptrend on Wednesday and Thursday. Is this a new uptrend or just upward correction? There have been no confirmed positive signals so far. We still can see some negative technical divergences. But will they lead to medium-term downward correction? The S&P 500 index continues to trade within a medium-term consolidation following early June breakout above 2,400 mark, as we can see on the daily chart:
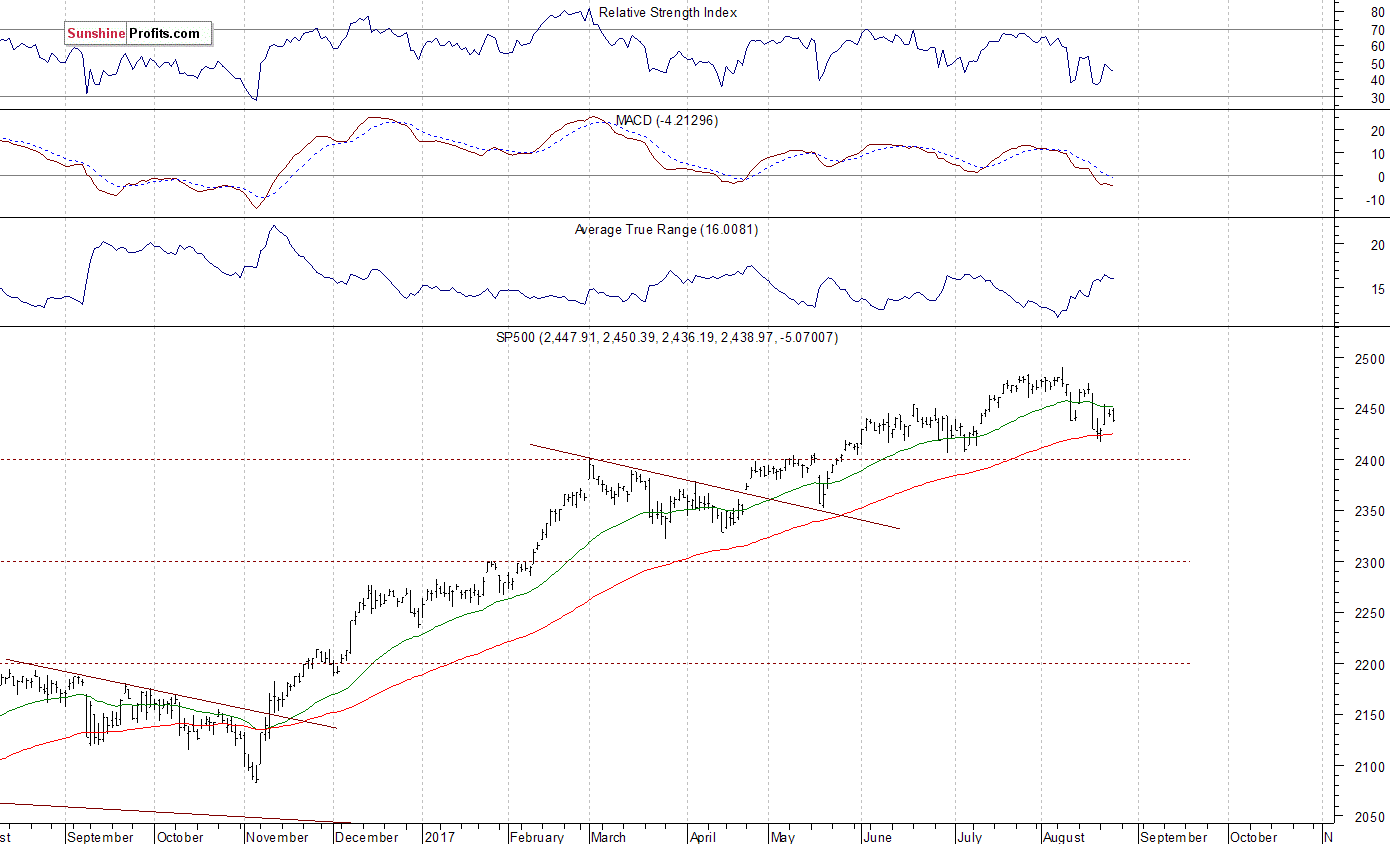
New Uptrend?
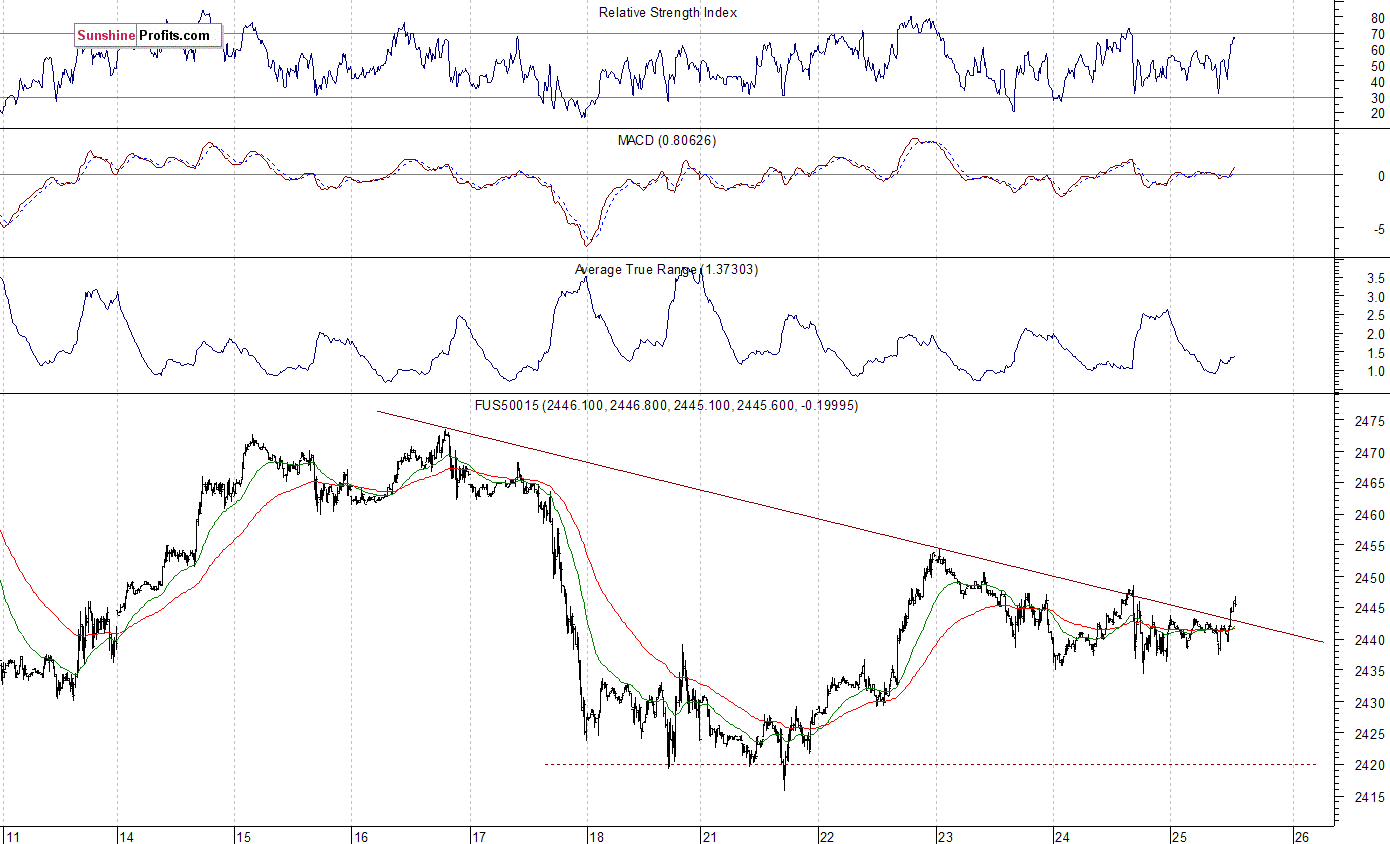
Expectations before the opening of today's trading session are positive, with index futures currently up 0.2-0.3% vs. yesterday's closing prices. The European stock market indexes have gained 0.3-0.4% so far. Investors will now wait for the Durable Goods Orders number release at 8:30 a.m. The market expects that it fell 6.0% in July. Investors will also wait for the Jackson Hole Economic Policy Symposium outcomes, including Fed's Janet Yellen's and ECB's Mario Draghi's speeches. The S&P 500 futures contract trades within an intraday uptrend following an overnight consolidation. The nearest important level of resistance is at around 2,445-2,450, marked by short-term local highs. The next resistance level is at around 2,455, marked by Tuesday's local highs. On the other hand, support level is at 2,430-2,435, marked by previous level of resistance. Will the market continue its Tuesday's rally? Or was this just some quick bounce following recent move down?
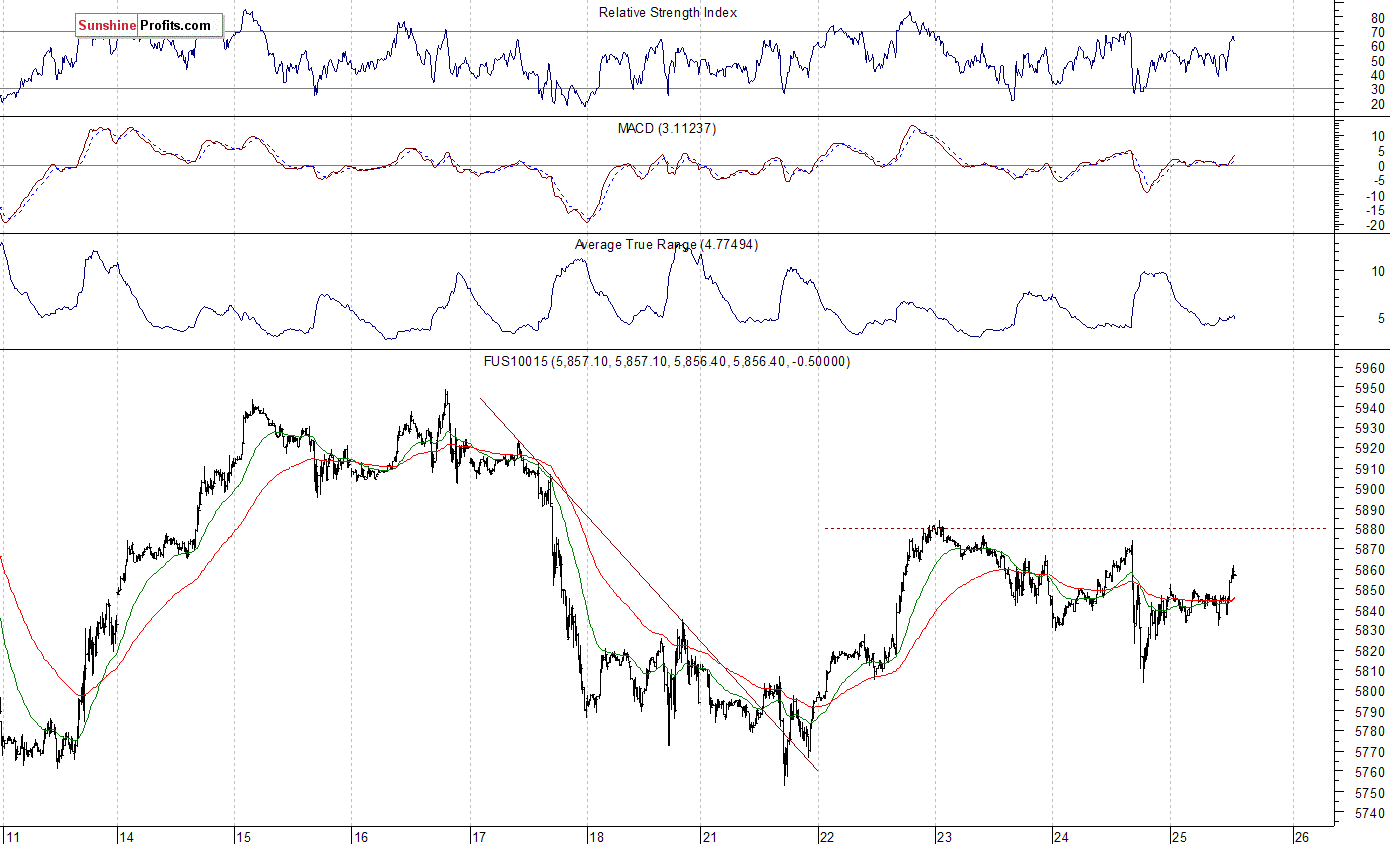
Nasdaq Bounces Again
The technology Nasdaq 100 futures contract trades within an intraday uptrend, as it retraces some of yesterday's move down. The nearest important level of resistance is at around 5,870, marked by yesterday's local high. On the other hand, support level is at 5,800, marked by local low. The market trades within a short-term consolidation following Tuesday's rally. Will it break above local highs and continue the uptrend?
Concluding, the S&P 500 index continued to fluctuate on Thursday, as investors hesitated following Tuesday's rally. Will the short-term uptrend continue? Or is this just a move within consolidation? There have been no confirmed positive signals so far. We still can see some medium-term overbought conditions along with negative technical divergences.
Therefore, we continue to maintain our medium-term short position (opened at 2,437.83 on June 5 - opening price of the S&P 500 index). Stop-loss level is at 2,510 and potential profit target is at 2,300 (S&P 500 index). One can trade S&P 500 index using futures contracts (S&P 500 futures contract - SP, E-mini S&P 500 futures contract - ES) or an ETF like the SPDR S&P 500 ETF - SPY. It is always important to set some exit price level in case some events cause the price to move in the unlikely direction. Having safety measures in place helps limit potential losses while letting the gains grow.
To summarize: medium-term short position in S&P 500 index is justified from the risk/reward perspective with the following entry prices, stop-loss orders and profit target price levels:
Intraday trade:
No intraday position is justified from the risk/reward perspective today.
Medium-term trade:
S&P 500 index - short position: profit target level: 2,300; stop-loss level: 2,510
S&P 500 futures contract (September) - short position: profit target level: 2,297; stop-loss level: 2,507
SPY ETF (SPDR S&P 500, not leveraged) - short position: profit target level: $230; stop-loss level: $251
SDS ETF (ProShares UltraShort S&P500, leveraged: -2x) - long position: opening price: $12.56; profit target level: $13.98; stop-loss level: $11.82
Thank you.
Paul Rejczak
Stock Trading Strategist
Stock Trading Alerts

