

As you know, Paul Rejczak is out of the office until August 3rd, but we didn’t want to keep you entirely without information regarding the stock price movement before that time, so we will provide you with occasional brief analyses anyway.
Let’s examine the short-term changes on the chart below (charts courtesy of http://stockcharts.com).
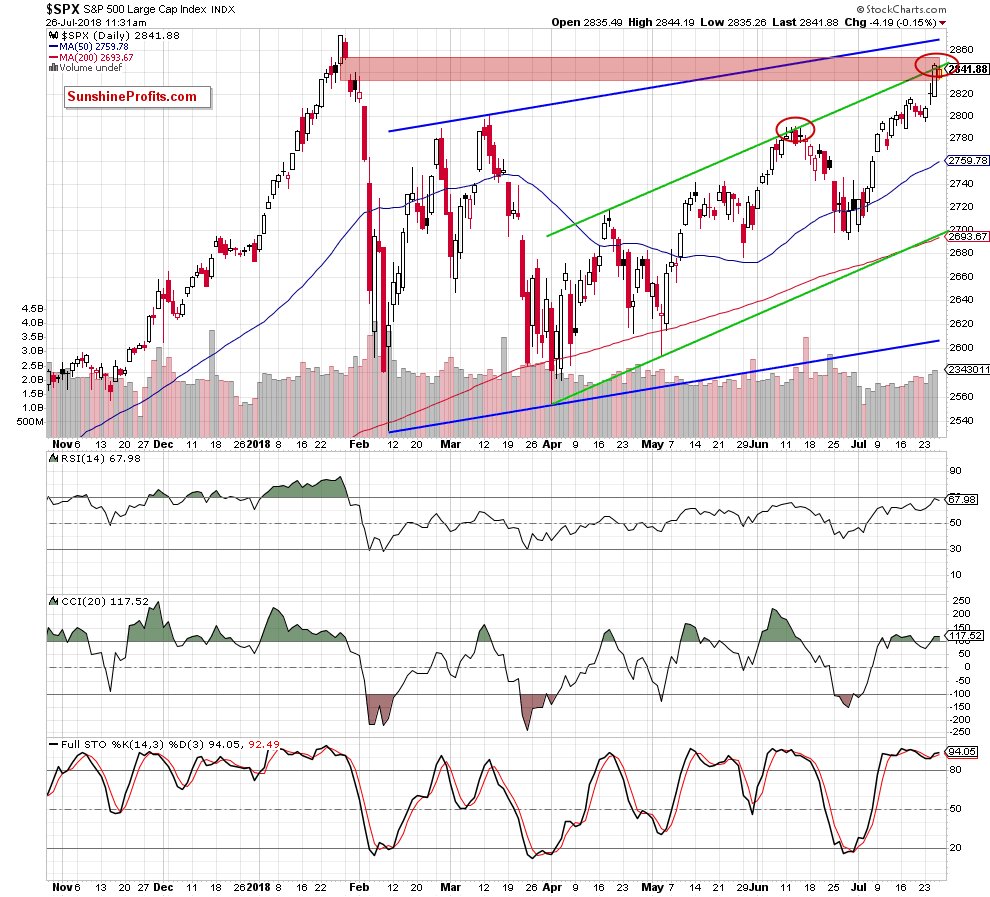
The first thing that catches the eye on the daily chart is yesterday's breakout above the upper border of the short-term green rising trend channel. Positive sign? Of course, but only at first glance and we have several arguments for it.
Firstly, although the S&P broke above this resistance, we should keep in mind that the index climbed to the red resistance zone based on the quite big gap created at the end of January.
As you see on the chart, at the turn of January and February, the bulls tried to return to higher levels, but their dreams of a new peak quickly disappeared, because the above-mentioned gap proved to be an impassable barrier. As a result, the index moved sharply lower in the following days, erasing over two-month increases.
Such price action suggests very clearly that as long as the gap is open, fresh peaks are not likely to be seen and another reversal from current levels should not surprise us.
Secondly, looking at the chart, we see that a very similar situation has already happened in the past (we marked both of them with the red ellipses). Back then (in mid-June), the buyers also reached the upper line of the green rising trend channel, but despite several attempts to move higher, they failed, which resulted in a quite sizable correction in the following days.
Thirdly, the current position of the daily indicators also increases the probability of a reversal in the very near future. Why? Because, the RSI climbed to its highest level since late January, which suggests that the space for its gains may be limited (please keep in mind what happened back then with stocks). The CCI came back to its overbought area, while the Stochastic Oscillator is still wavering above 90, which raises some concerns about the place to its grow. On top of that, there are bearish divergences between them (the last two indicators), which doesn’t bode well for the rally.
Is there anything positive for the bulls on the above chart?
Yes – one thing. The volume. As you see, it has been growing since the beginning of the week, which shows best that the buyers are full of hope and will fight for higher levels. This means that a test of the strength of the upper line of the red gap (around 2,851-2,853) should not surprise us.
At this point, it is also worth noting that even if they succeed and the gap is closed, they will have to break above the upper border of the medium-term blue rising trend channel (which is currently slightly below the January peak of 2,872) before the way to the north is open again.
Nevertheless, if the breakout becomes clear enough and the implications bullish enough to justify a speculative long position in the US stock market, we’ll let you know.
Thank you.
Nadia Simmons
Forex & Oil Trading Strategist
Gold & Silver Trading Alerts
Forex Trading Alerts
Oil Investment Updates
Oil Trading Alerts

