

Briefly:
Intraday trade: The S&P 500 lost 2.5% on Thursday, after opening 0.7% lower. The market will probably open higher today. We may see some more short-term volatility following the recent rebound.
Trading position (short-term; our opinion): no positions are justified from the risk/reward perspective.
Our short-term outlook is neutral, and our medium-term outlook is neutral:
Short-term outlook (next 1-2 weeks): neutral
Medium-term outlook (next 1-3 months): neutral
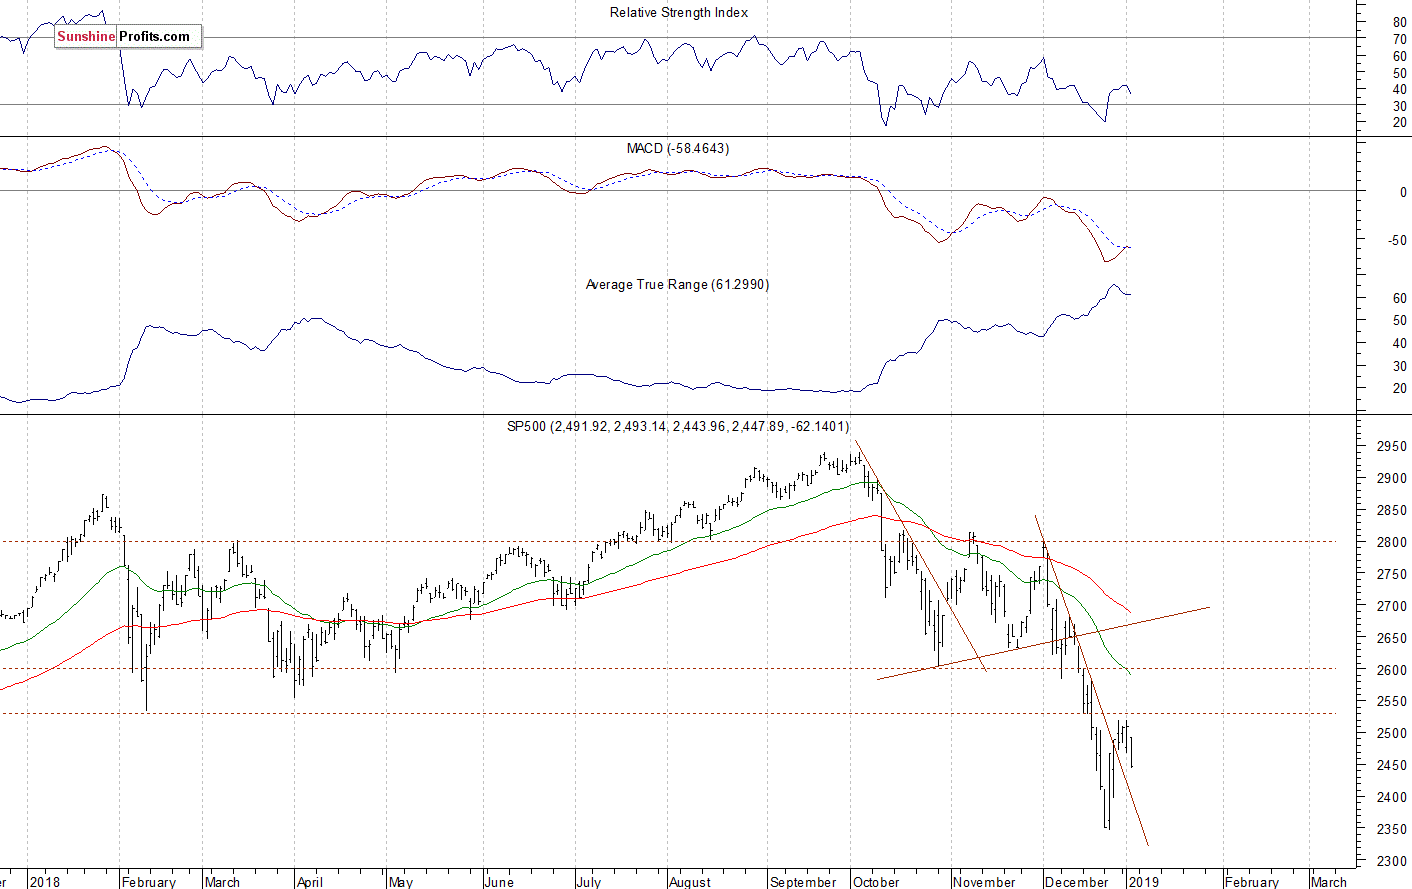
The U.S. stock market indexes lost 2.5-3.0% on Thursday, following Wednesday's Apple's profit warning release. The S&P 500 index fell the lowest since the late April of 2017 and it traded 20.2% below September the 21st record high of 2,940.91 on December the 26th, when it reached the new medium-term low of 2,346.58. Then the market rallied and got close to 2,500 mark. The Dow Jones Industrial Average lost 2.8% and the Nasdaq Composite lost 3.0% yesterday.
The nearest important level of resistance of the S&P 500 index is now at 2,470-2,480, marked by some recent fluctuations. The resistance level is also at 2,500-2,520, marked by the recent local highs. On the other hand, the support level is at 2,400-2,420.
The broad stock market broke below its two-month-long trading range recently, as the S&P 500 index fell below the level of 2,600. Then the market accelerated lower and it broke below the level of 2,400. The downward correction reached 20.2% from the September all-time high, surpassing January-February correction of around 12%. Is this a long-term bear market? It still looks like a medium-term downward correction, but the index remains below the recent consolidation, as we can see on the daily chart:
Positive Expectations Ahead of Jobs Data Release
Expectations before the opening of today's trading session are positive, because the index futures contracts trade 1.5-1.9% above their yesterday's closing prices. The European stock market indexes have gained 1.4-1.8% so far. Investors will wait for series of important economic data announcements this morning: Nonfarm Payrolls number, Unemployment Rate, Average Hourly Earnings at 8:30 a.m., Final Services PMI at 9:45 a.m., Crude Oil Inventories at 11:00 a.m. There will also be a speech from the Fed Chair Powell at 10:15 a.m. The broad stock market may retrace some of its yesterday's sell-off. For now, it looks like a consolidation following the recent rebound. The market remains below the important resistance level of around 2,500.
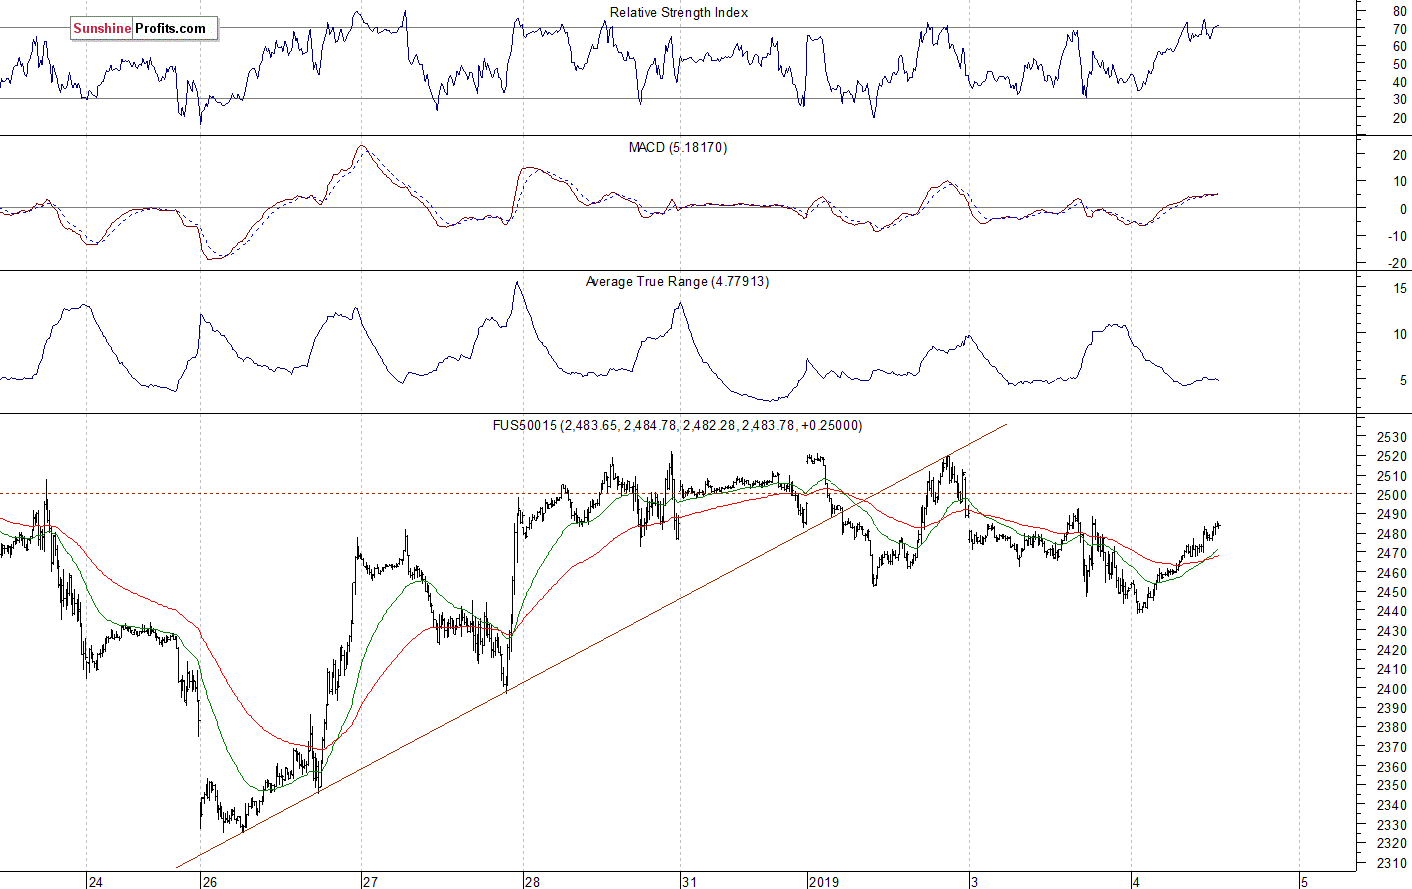
The S&P 500 futures contract trades within an intraday uptrend, as it retraces some of its yesterday's sell-off. The nearest important level of resistance is now at around 2,480-2,500. On the other hand, the support level is at 2,450, among others. The futures contract gets back closer to 2,500 mark again, as the 15-minute chart shows:
Nasdaq Also Higher
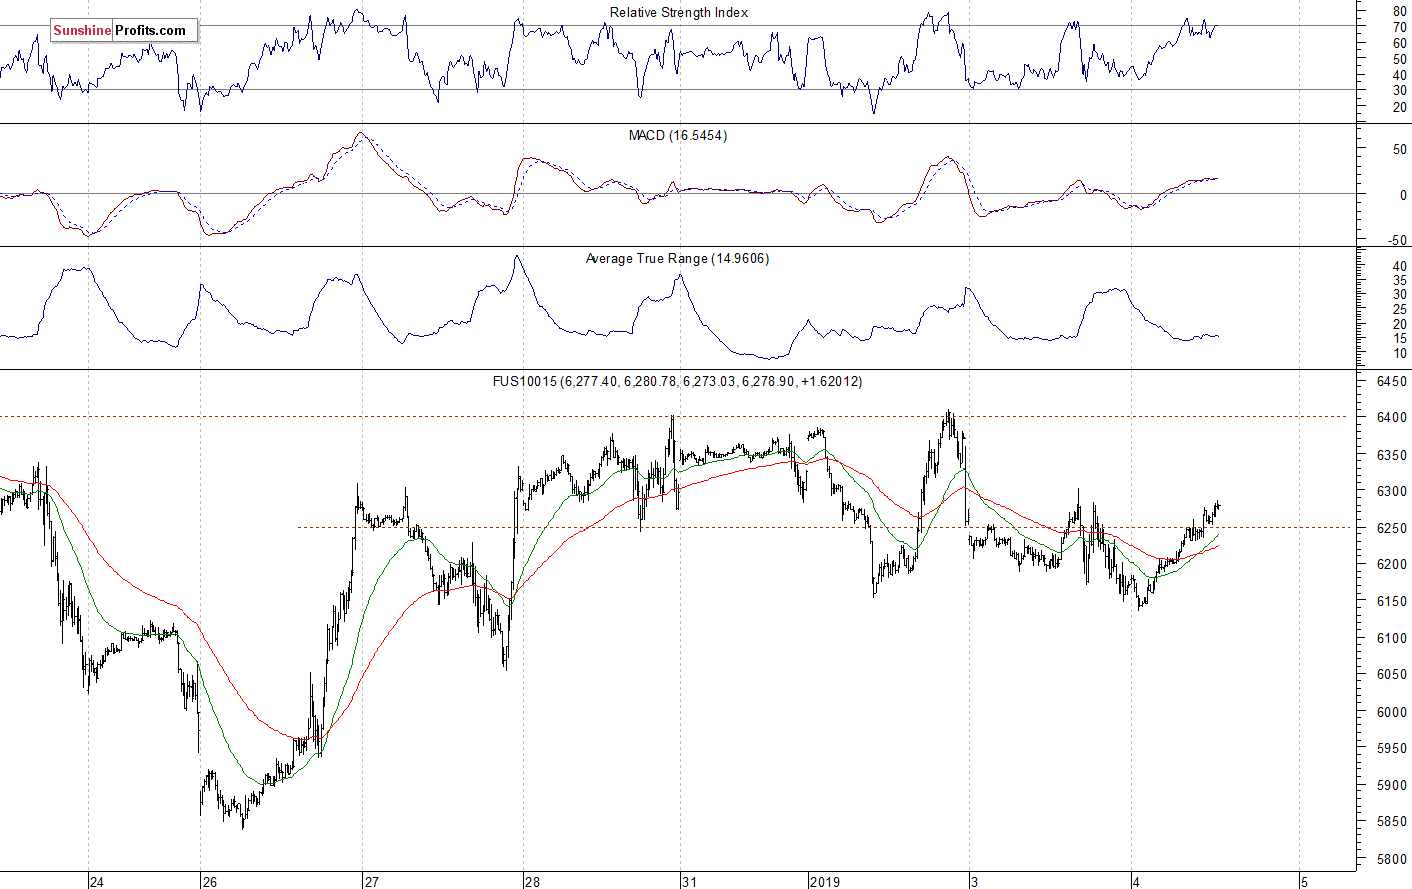
The technology Nasdaq 100 futures contract follows a similar path, as it retraces some of its yesterday's decline this morning. The nearest important resistance level is at 6,250-6,300. On the other hand, the support level is at 6,150-6,200. The Nasdaq futures contract continues to trade within a short-term consolidation, as we can see on the 15-minute chart:
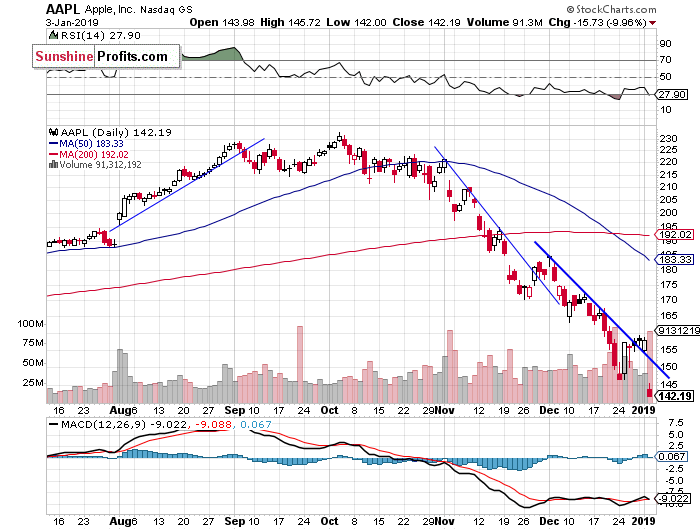
Apple at New Medium-Term Low, Amazon Relatively Stronger
Let's take a look at Apple, Inc. stock (AAPL) daily chart (chart courtesy of http://stockcharts.com). The stock sold off yesterday, as it reached the new medium-term low of $142. It is below the month-long downward trend line again. We can see some clear short-term oversold conditions. However, there have been no confirmed positive signals so far. The stock may retrace some of the sell-off in the near future.
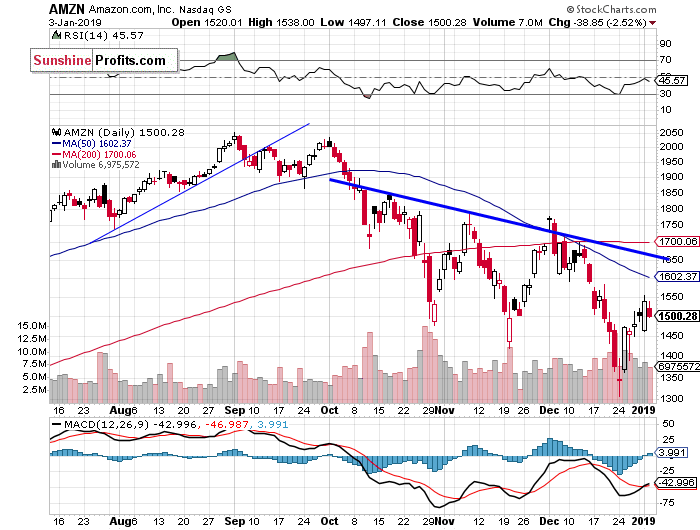
Now let's take a look at Amazon.com, Inc. stock (AMZN) daily chart. The stock accelerated its downtrend recently and it reached the new medium-term low of $1,307. Was last week's Wednesday's rally the upward reversal? For now, it looks like another upward correction. The market remains below its three-month-long downward trend line:
Dow Jones Reversing Lower?
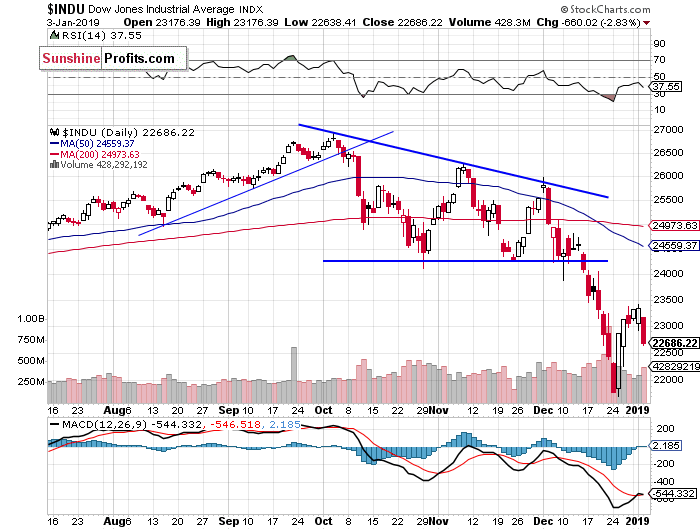
The Dow Jones Industrial Average broke below its two-month-long consolidation in the mid-December and then it accelerated much lower. The blue-chip stocks' gauge fell below the level of 22,000. It slightly extended the downtrend on Wednesday a week ago before sharply reversing higher and getting back to 23,000 mark. So was it an upward reversal or just a correction within a downtrend? The market remains below its October - December trading range:
The S&P 500 index extended its downtrend in the late December, before reversing higher. The broad stock market was more than 20% below its September's record high on December the 26th. Is this a new long-term bear market or just medium-term downward correction? For now, it looks like a correction. However, there have been no confirmed medium-term positive signals so far.
Concluding, the S&P 500 index will likely open higher today. However, we may see more short-term volatility after last week's Monday's panic-selling climax followed by Wednesday's rally. Investors will wait for series of economic data releases and the Fed's Chairman's speech today.
Trading position (short-term; our opinion): no positions are justified from the risk/reward perspective.
Thank you.
Paul Rejczak
Stock Trading Strategist
Stock Trading Alerts

