

Briefly:
Intraday trade: Our Thursday's intraday trading outlook was neutral. It proved accurate, because the S&P 500 gained 0.1% following higher opening of the trading session (+0.3%). The market fluctuated below its Wednesday's new record high. We still can see some clear short-term overbought conditions along with an overly bullish investors' sentiment. However, there have been no confirmed negative signals so far. We prefer to be out of the market today, avoiding low risk/reward ratio trades.
Medium-term trade: In our opinion, no medium-term positions are justified.
Our intraday outlook is neutral today. Our short-term outlook is neutral, and our medium-term outlook is neutral:
Intraday outlook (next 24 hours): neutral
Short-term outlook (next 1-2 weeks): neutral
Medium-term outlook (next 1-3 months): neutral
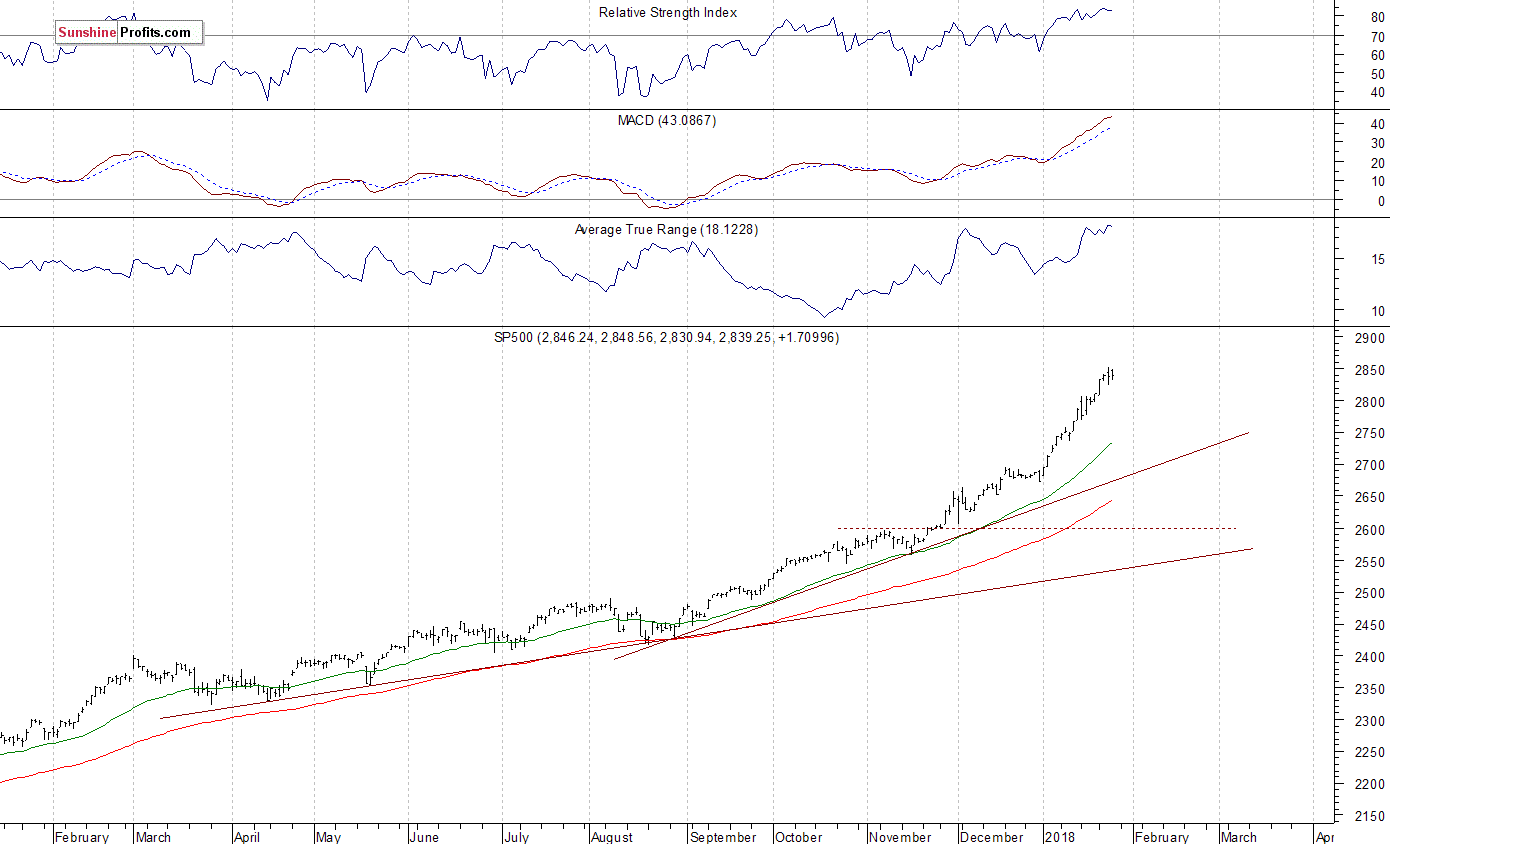
The main U.S. stock market indexes were mixed between -0.1% and +0.5% on Thursday, as investors continued to hesitate following recent record-breaking rally. The S&P 500 index remained within its Wednesday' daily trading range. It trades 0.5% below Wednesday's new record high of 2,852.97. The Dow Jones Industrial Average has also reached new record high at the level of 26,458.25. It was relatively stronger than the broad stock market again, as it gained 0.5%. The technology Nasdaq Composite was relatively weak, as it lost 0.1%. The nearest important level of support of the S&P 500 index is at around 2,825-2,830, marked by recent local lows. The next support level is at 2,800-2,810, marked by previous resistance level. The support level is also at around 2,780, marked by local lows. The support level is the price level, at which the buying interest is strong enough to overcome selling pressure and push the price higher. Support usually refers to the previous low or lows, lines that are created by drawing the line between previous important bottoms or important tops and then extrapolating this line into the future. We still can see medium-term technical overbought conditions, but the market continues its nine-year-long bull market:
Positive Expectations Again
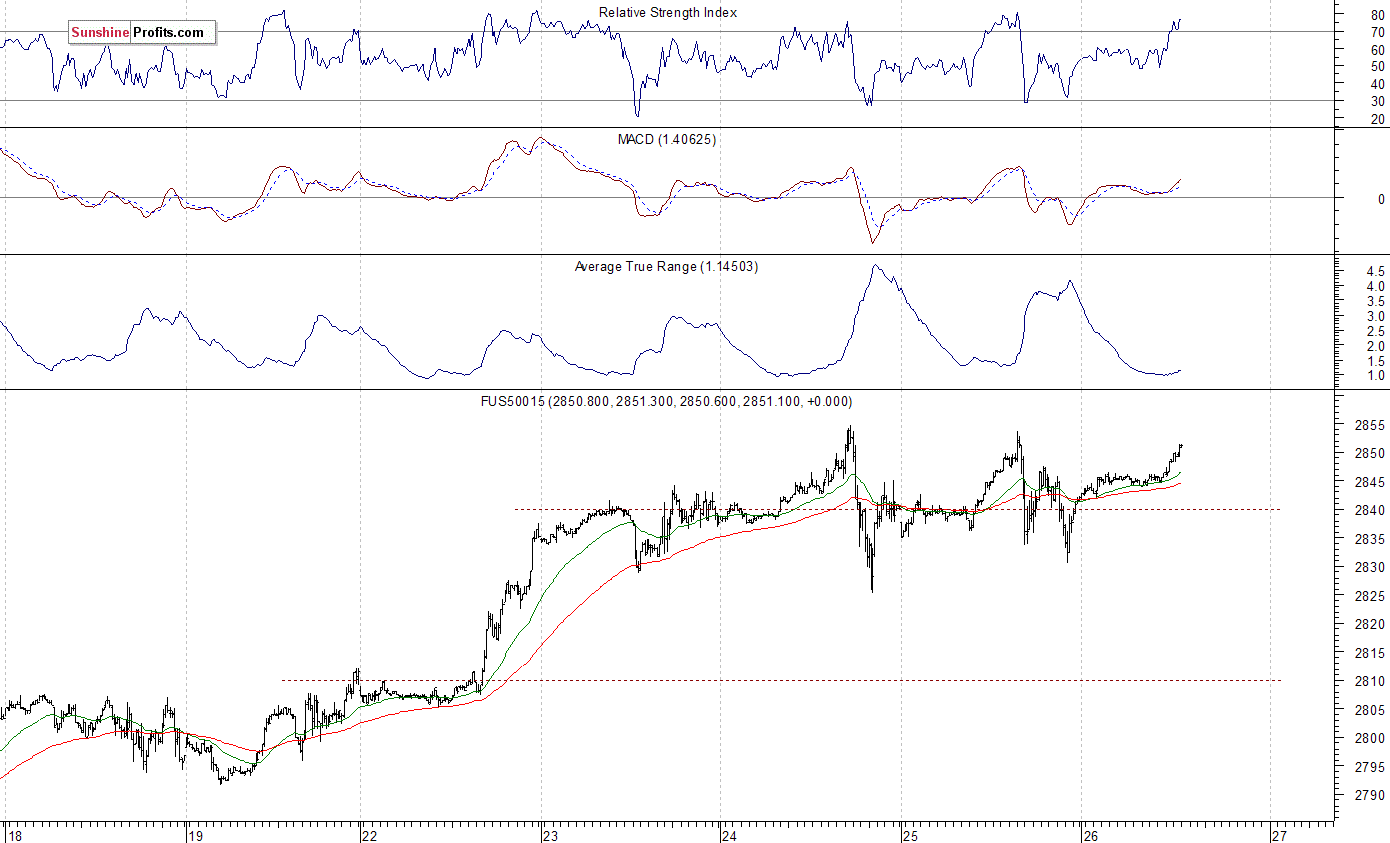
Expectations before the opening of today's trading session are positive, because index futures trade 0.2-0.5% higher vs. their Thursday's closing prices. The European stock market indexes have gained 0.1-0.8% so far. Investors will wait for some economic data announcements: Advance GDP number, Durable Goods Orders, Wholesale Inventories at 8:30 a.m. The market expects that the U.S. GDP grew 3.0% in the fourth quarter of 2017. Will better-than-expected quarterly GDP number release lead to new record highs? Probably not - some profit-taking and "buy the rumor, sell the news" scenario seems more likely. The S&P 500 futures contract trades within an intraday uptrend, as it retraces its yesterday's move down. The market is closer to its record high again. The nearest important level of resistance remains at around 2,850-2,855, marked by record high. On the other hand, support level is at 2,835-2,840, marked by short-term consolidation. The next level of support remains at 2,825-2,830, marked by yesterday's daily low. The futures contract remains close to its record high, as the 15-minute chart shows:
Nasdaq Higher Following Intel Earnings Release
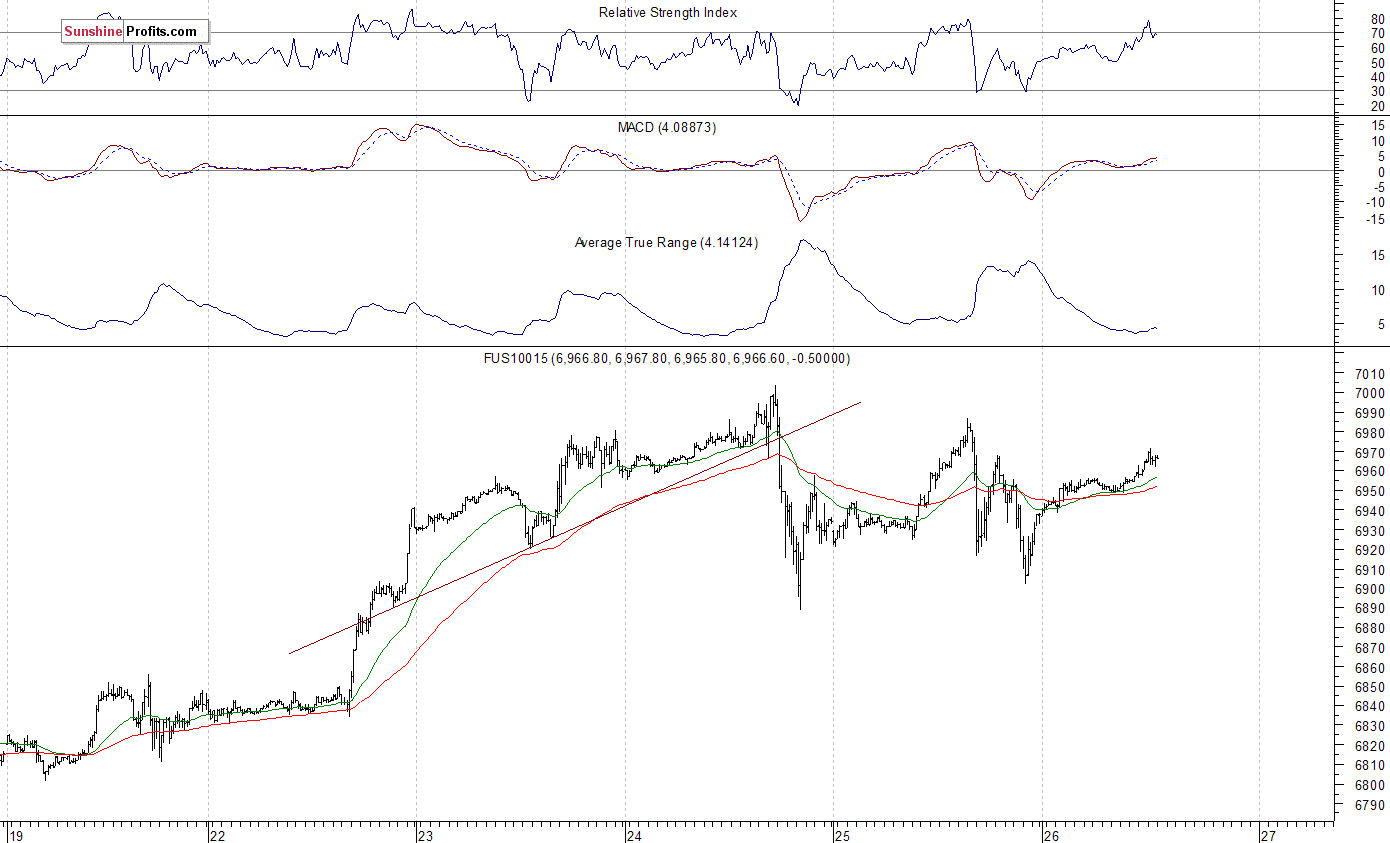
The technology Nasdaq 100 futures contract follows a similar path, as it retraces yesterday's move down this morning. Will the uptrend continue? Potential resistance level is at around 7,000, marked by new record high. On the other hand, support level is at 6,930, and the next level of support is at 6,880-6,900. The Nasdaq 100 futures contract trades within an over three-day-long consolidation, as we can see on the 15-minute chart:
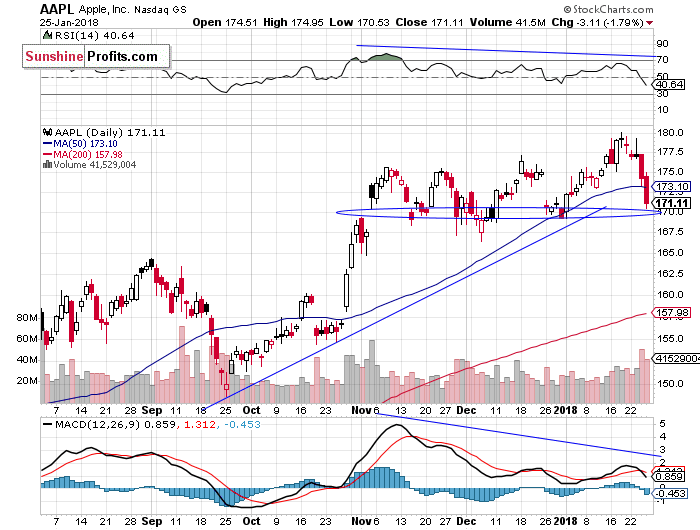
Let's take a look at Apple, Inc. stock (AAPL) daily chart (chart courtesy of http://stockcharts.com). The stock reached new record high on a week ago, following short-term consolidation along the support level of $175. The market got closer to $180 mark, but it failed to continue its short-term uptrend. Consequently, the stock retraced most of this month's advance on Wednesday and yesterday. It trades closer to support level of $165-170 again. The stock may fluctuate along this support level for some time. The rally ahead of February 1 quarterly earnings release seems less likely at this moment:
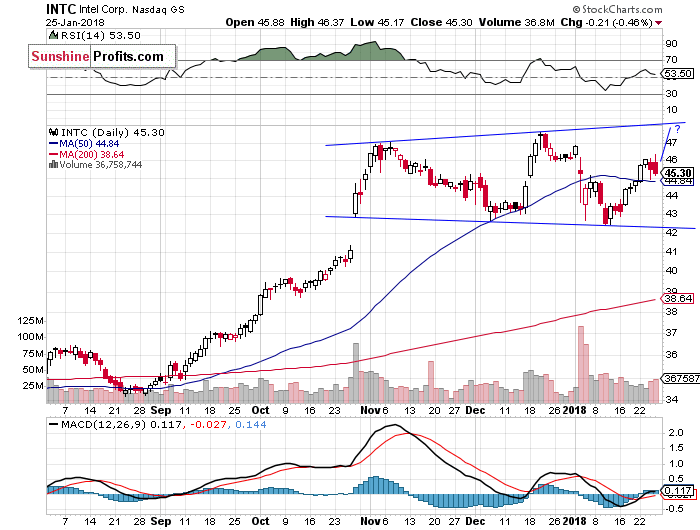
Intel Corp. stock (INTC) released better-than-expected quarterly earnings release yesterday in the after-hours trading session. The stock is gaining more than 5% ahead of the opening of today's trading session. Will it break above three-month-long expanding triangle pattern? The expanding triangle is a very interesting pattern, because the price is making series of lower lows and higher highs. If the stock will break through upper level, then there is a big chance that it continues higher:
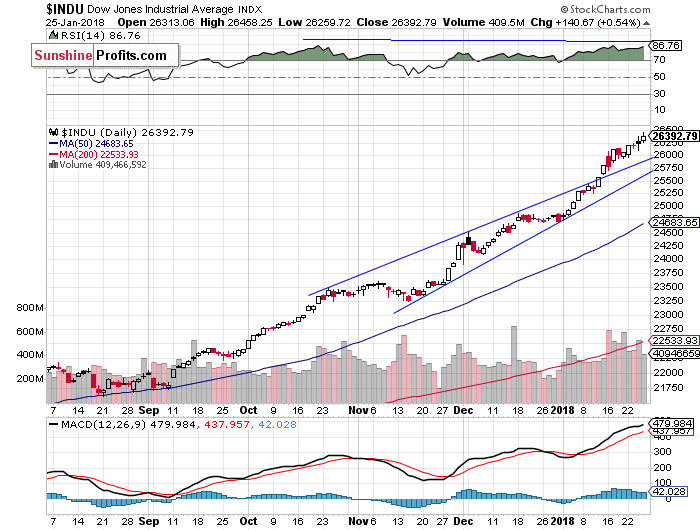
The Dow Jones Industrial Average daily chart shows that blue-chip index reached new record high yesterday, as it further extended its short-term uptrend following breakout above 26,000 mark. We still can see medium-term negative technical divergences. The most common divergences are between asset’s price and some indicator based on it (for instance the index and RSI based on the index). In this case, the divergence occurs when price forms a higher high and the indicator forms a lower high. It shows us that even though price reaches new highs, the fuel for the uptrend starts running low. However, the index trades above its two-month-long rising wedge pattern (failed potential uptrend reversal pattern), which confirms its multi-year bull market:
Concluding, the S&P 500 index gained 0.1% on Thursday, as it remained within its Wednesday's daily trading range. The broad stock market is within a short-term consolidation following its almost month-long bullish euphoria run. The index is trading around 6% above its December 29 yearly closing price. Is this some medium-term topping pattern before uptrend reversal? There have been no confirmed negative signals so far. However, we still can see medium-term overbought conditions. We can use indicators such as Relative Strength Index (RSI), Stochastic Oscillator, Money Flow Index to identify overbought conditions. For example, one can view a given market as "overbought" if the RSI indicator for this market is above 70. Paying attention to the overbought/oversold status of the market is very useful, but there are many other factors that need to be considered before placing a trade.
Currently, we prefer to be out of the market, avoiding low risk/reward ratio medium-term trades. We will let you know when we think it is safe to get back in the market.
To summarize: no medium-term positions are justified from the risk/reward perspective at this moment.
Intraday trade:
No intraday position is justified from the risk/reward perspective today.
No medium-term position is justified from the risk/reward perspective at this moment.
Thank you.
Paul Rejczak
Stock Trading Strategist
Stock Trading Alerts

