

Briefly:
Intraday trade: The S&P 500 index gained 1.1% after opening 0.3% higher on Friday. The broad stock market will likely open higher again. However, we may see some short-term profit-taking action along the mid-May high.
Trading position (short-term; our opinion): no positions are justified from the risk/reward perspective.
Our short-term outlook is neutral, and our medium-term outlook is neutral:
Short-term outlook (next 1-2 weeks): neutral
Medium-term outlook (next 1-3 months): neutral
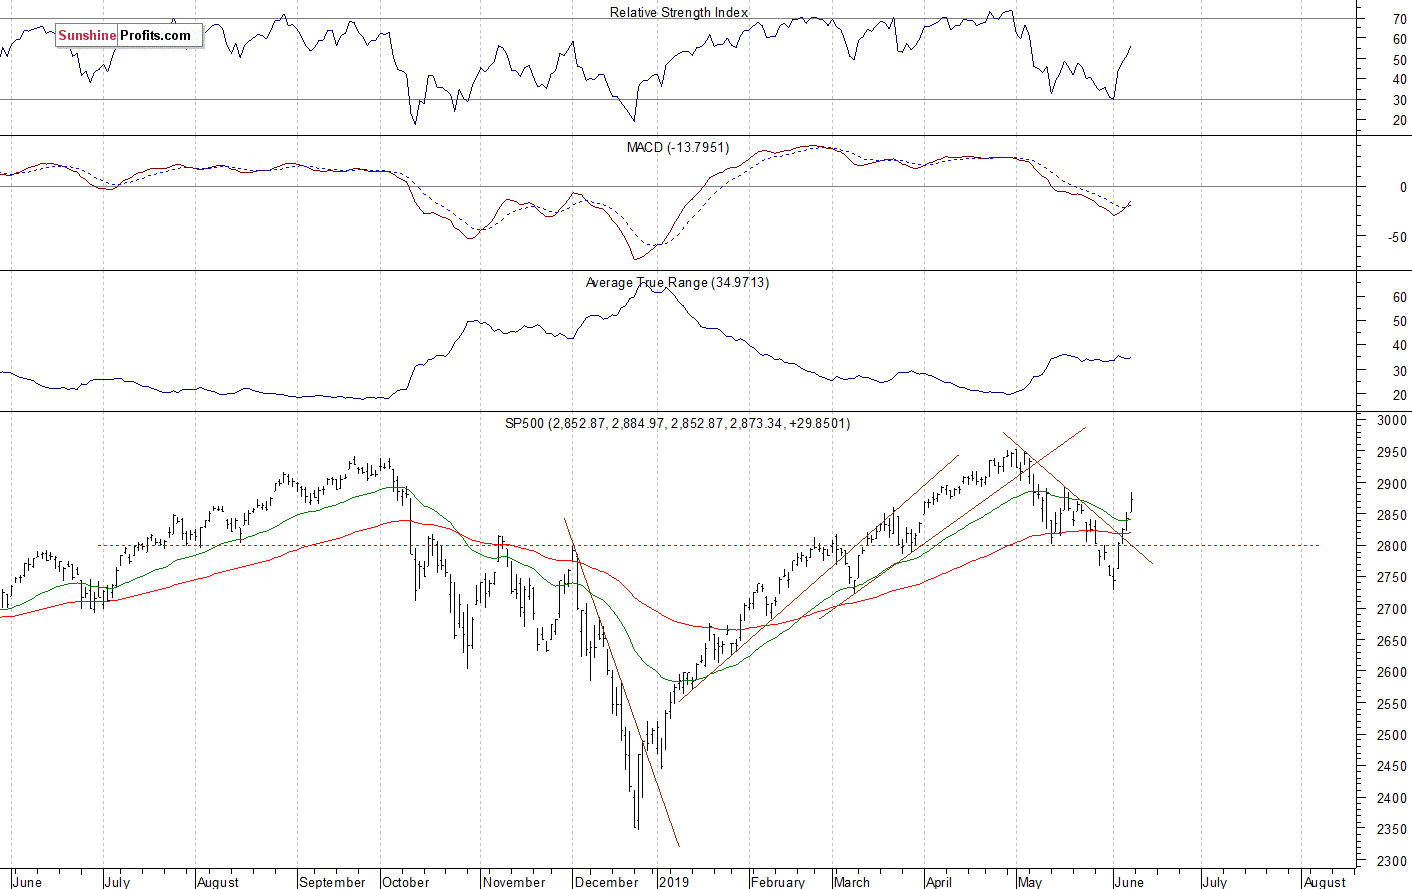
The U.S. stock market indexes gained 1.0% on Friday, extending their short-term run-up again, as investors' sentiment remained bullish after the monthly jobs data release. The S&P 500 index traded almost 160 points above its last week's Monday's local low. It is currently 2.7% below its May the 1st record high of 2,954.13. Both the Dow Jones Industrial Average and the Nasdaq Composite gained 1.0% on Friday.
The nearest important resistance level of the S&P 500 index is now at 2,890-2,900. The resistance level is also at 2,930-2,950. On the other hand, the support level is at 2,830-2,850, among others.
The broad stock market broke above the last year's high in the early May. But then the S&P 500 index retraced all of the April's advance. The market also broke below its two-month-long upward trend in the early May. And now it is trading above the month-long downward trend line:
Closer to Mid-May Local High
Expectations before the opening of today's trading session are positive, because the index futures contracts trade 0.4% above their Friday's closing prices. The European stock market indexes have gained 0.3-0.5% so far. Investors will wait for the JOLTS Job Openings number release at 10:00 a.m.
The broad stock market will likely extend its short-term uptrend again this morning. However, then we could see some profit-taking action. The S&P 500 got closer to the resistance level, marked by its mid-May local high.
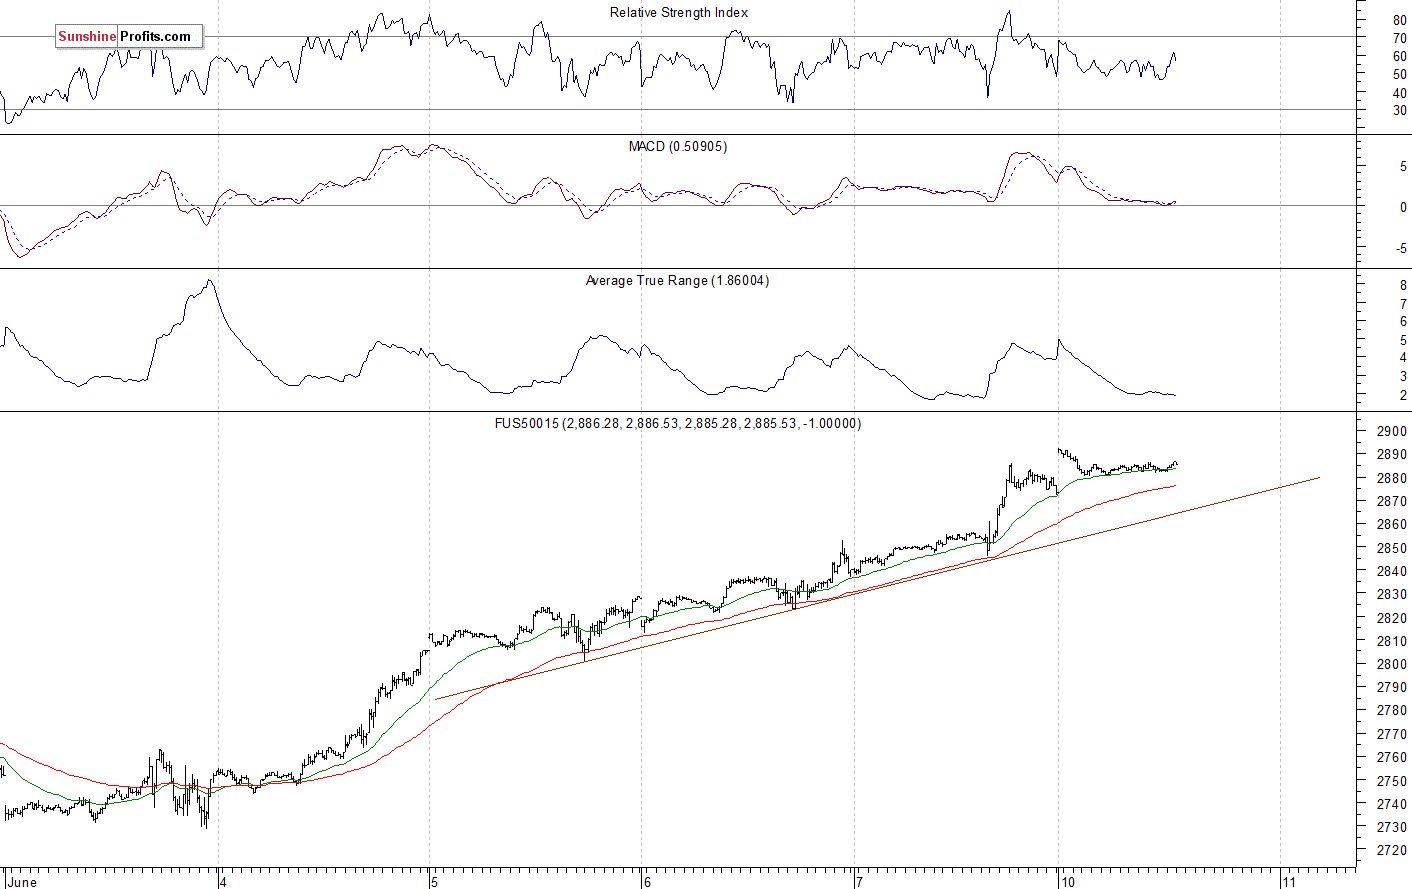
The S&P 500 futures contract trades within an intraday consolidation following an overnight advance. The nearest important resistance level is at around 2,895-2,900, marked by the local high. On the other hand, the support level is at 2,875-2,880. The futures contract continues to trade above the short-term upward trend line, as the 15-minute chart shows:
Nasdaq Also Above Friday's Close
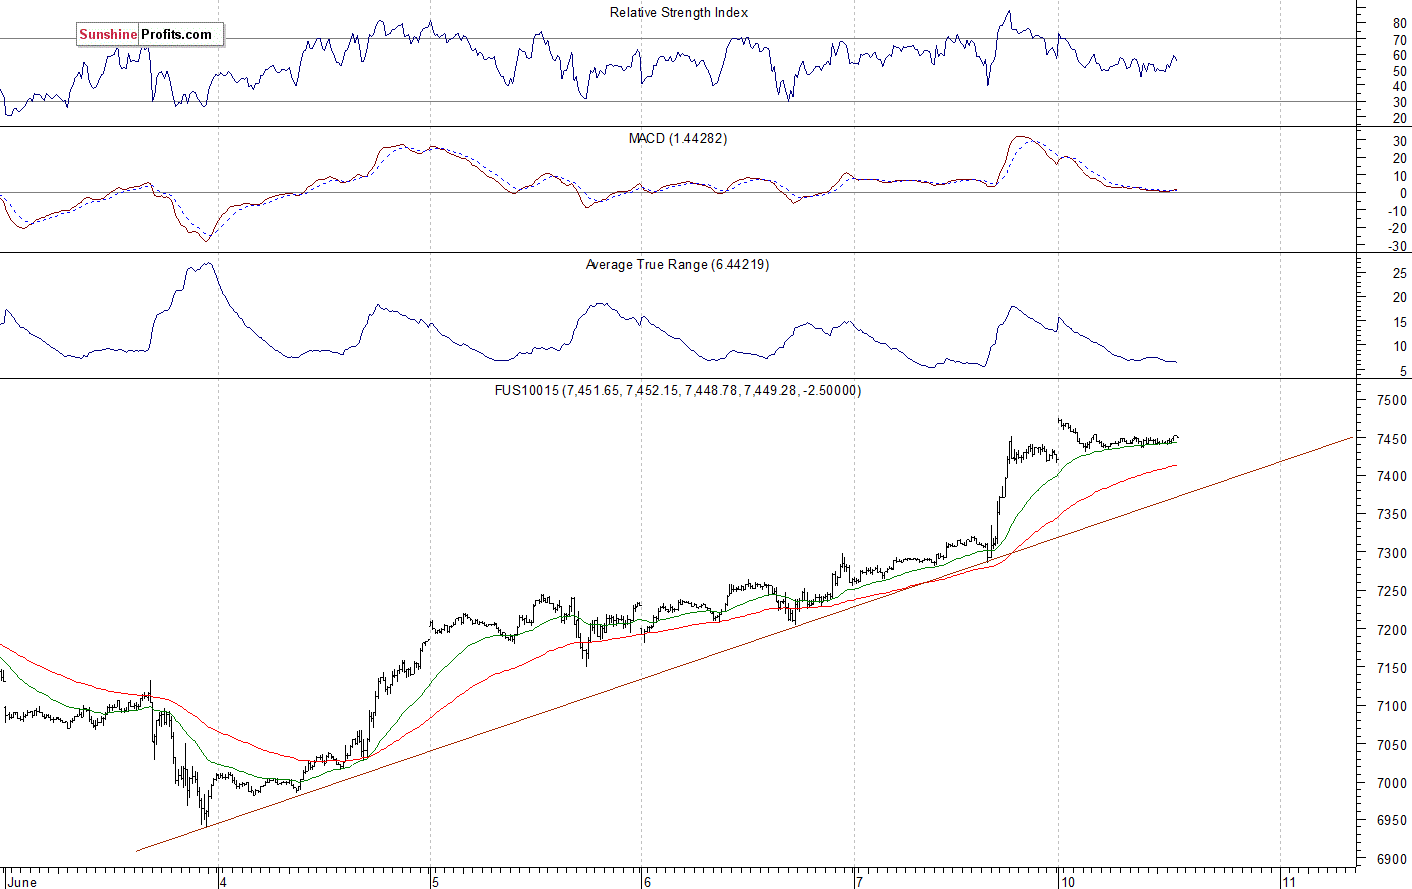
The technology Nasdaq 100 futures contract follows a similar path, as it trades within an intraday consolidation after opening higher. The market extended its rally on Friday, following breaking above the resistance level of 7,250-7,300. The nearest important resistance level is at 7,500, as we can see on the 15-minute chart:
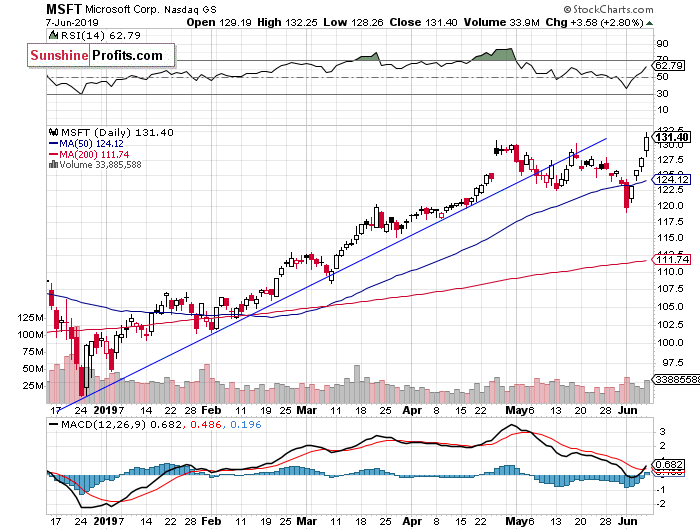
Microsoft at New Record High
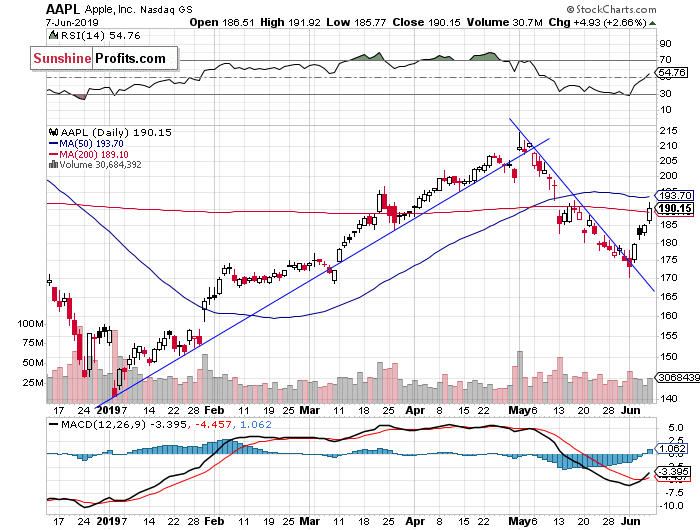
Let's take a look at the Apple, Inc. stock (AAPL) daily chart (chart courtesy of http://stockcharts.com). The stock extended its rally on May the 1st following the quarterly earnings release. Then the price reversed the upward course and broke below the medium-term upward trend line. Since then it was trading within a downtrend. And on Tuesday a week ago the stock broke above its downward trend line. For now, it looks like an upward correction:
Now let's take a look at the daily chart of Microsoft Corp. (MSFT). The stock accelerated its uptrend in late April. Since then, the market was trading within a consolidation. On Monday a week ago it broke below the support level, but then it got back higher. It reached the new record high of $132.25 on Friday:
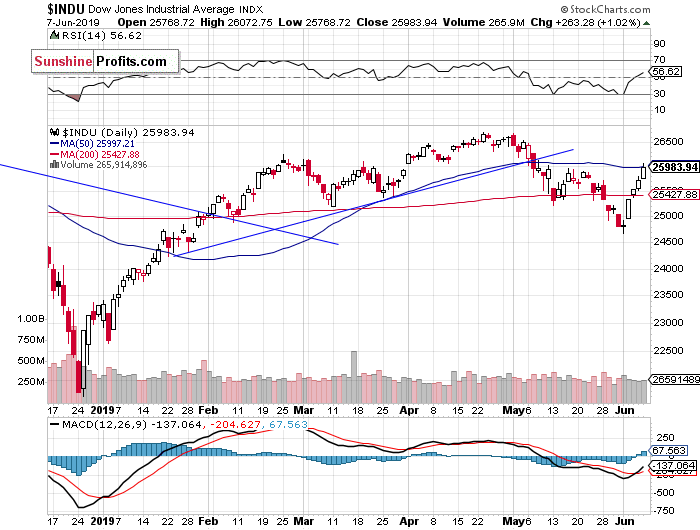
Dow Jones at Resistance Level Again
The Dow Jones Industrial Average has been relatively weaker than the broad stock market since February. The resistance level remained at around 26,800-27,000, marked by the last year's topping pattern and the record high of 26,951.8. Last week the blue-chip stocks' gauge followed the broad stock market, as it accelerated the downtrend. The market broke below its important 200-day moving average. On Tuesday it came back above the 25,000 mark, and on Wednesday it got back above the 200-day moving average. The resistance level remains at around 25,800-26,000, marked by the previous local highs:
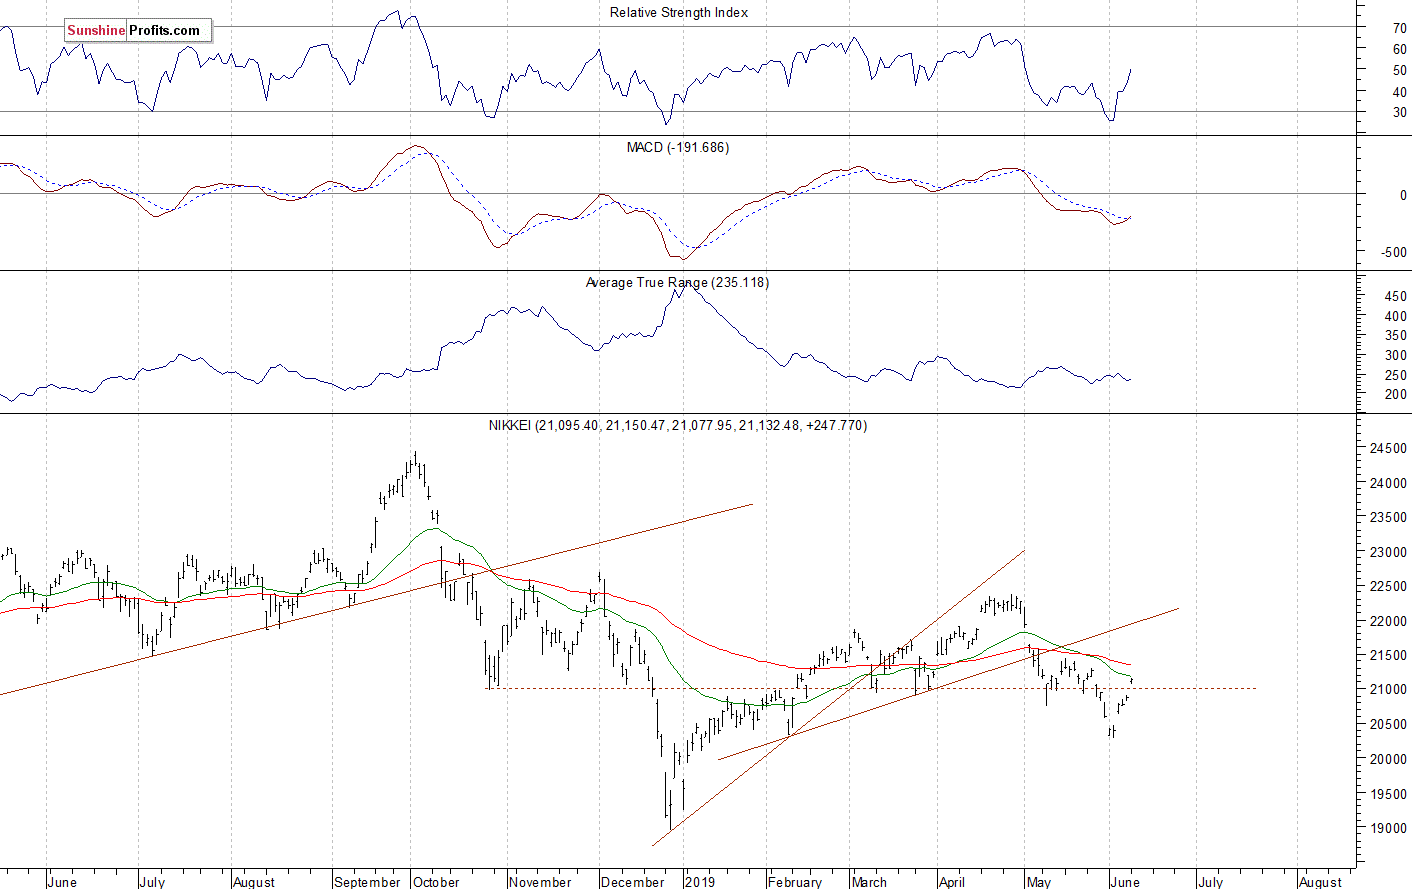
Nikkei Also Higher
Let's take a look at the Japanese Nikkei 225 index. It retraced more of its recent decline today. The market got back above the 21,000 mark. The index continues to trade along the previous local lows:
The S&P 500 index accelerated its short-term downtrend a week ago, as it fell to the local low of around 2,729 on Monday. Then the market broke above the month-long downward trend line and kept retracing its late May decline. Will it get back to the record high? There have been no confirmed negative signals so far. However, we can see some short-term overbought conditions.
Concluding, the S&P 500 index will likely open higher again today. The market may get closer to the mid-May local high and the resistance level of 2,900. However, we could see a profit-taking action at some point.
Trading position (short-term; our opinion): no positions are justified from the risk/reward perspective.
Thank you.
Paul Rejczak
Stock Trading Strategist
Sunshine Profits - Effective Investments through Diligence and Care

