

Briefly:
Intraday trade: Our Thursday's intraday trading outlook was bearish. It proved partly accurate because the S&P 500 index fell to new weekly low yesterday. However, the market reversed its downtrend and closed virtually flat. We still can see some short-term overbought conditions. Wednesday's reversal off new record high is a short-term negative signal. Therefore, intraday short position is favored. Stop-loss is at the level of 2,595 and potential profit target is at 2,545 (S&P 500 index).
Medium-term trade: In our opinion, no medium-term positions are justified.
Our intraday outlook is bearish today. Our short-term outlook is neutral, and our medium-term outlook is neutral:
Intraday outlook (next 24 hours): bearish
Short-term outlook (next 1-2 weeks): neutral
Medium-term outlook (next 1-3 months): neutral
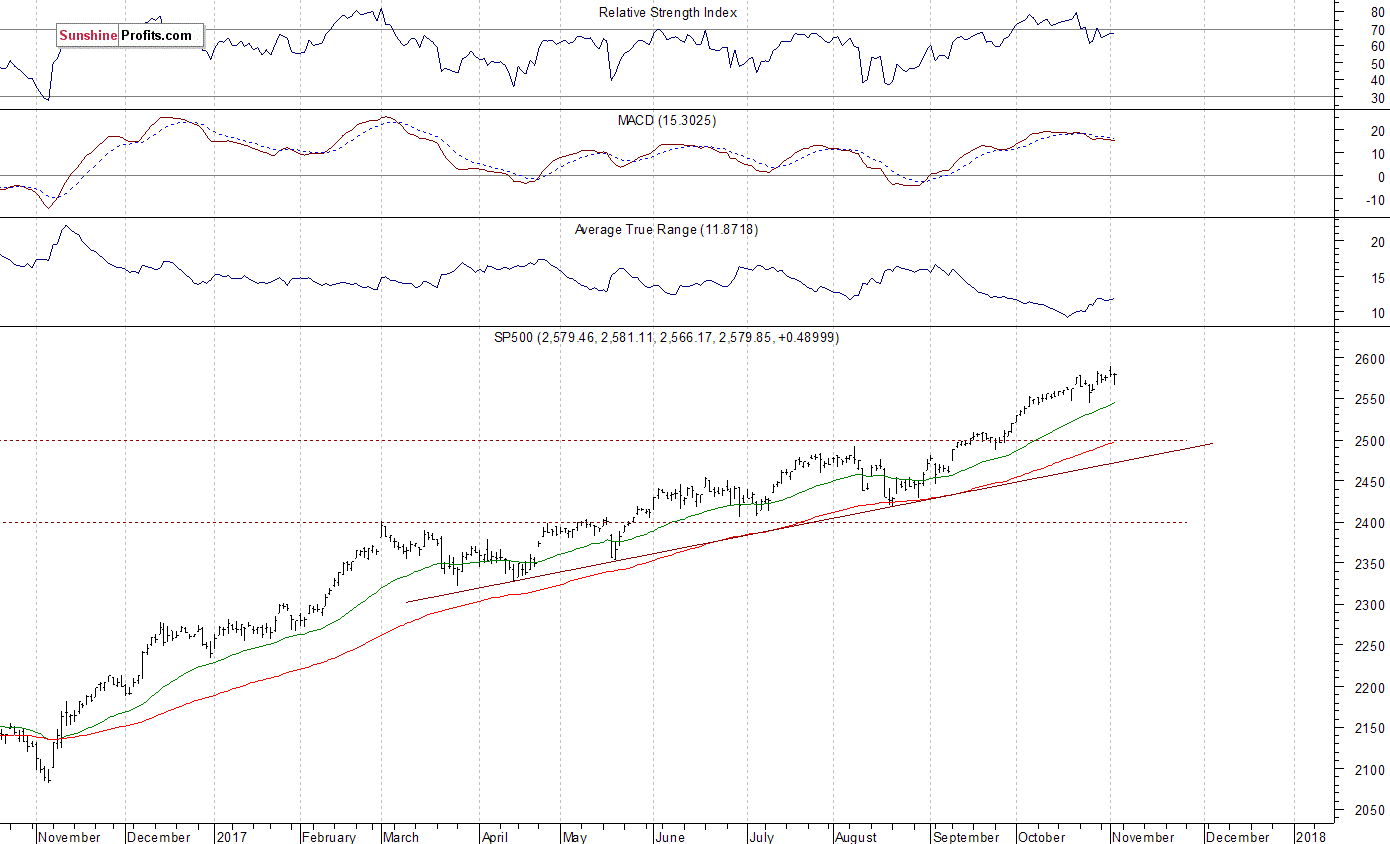
The U.S. stock market indexes were mixed between 0.0% and +0.4% on Thursday, as investors took some short-term profits off the table following recent rally. The S&P 500 index retraced this week's move up, before closing 0.02% higher. It remains around 0.3% below Wednesday's new record high of 2,588.40. The Dow Jones Industrial Average was relatively stronger than the broad stock market again, as it gained 0.4%. The blue-chip index reached new all-time high at the level of 23,531.38. The technology Nasdaq Composite extended its short-term consolidation following Wednesday's reversal off new record high at 6,759.66. The nearest important level of support of the S&P 500 index is at 2,565-2,570, marked by recent local lows. The next support level remains at 2,560, marked by previous local lows. The support level is also at 2,545-2,550, marked by last Wednesday's daily low, among others. On the other hand, potential resistance level is at around 2,590-2,600, marked by record high. The S&P 500 index extended its over eight-year-long bull market recently, as it reached new record high closer to 2,600 mark. Will bull market continue? Or is this some topping pattern ahead of downward reversal? There have been no confirmed negative signals so far. However, we still can see medium-term technical overbought conditions:
Positive Expectations
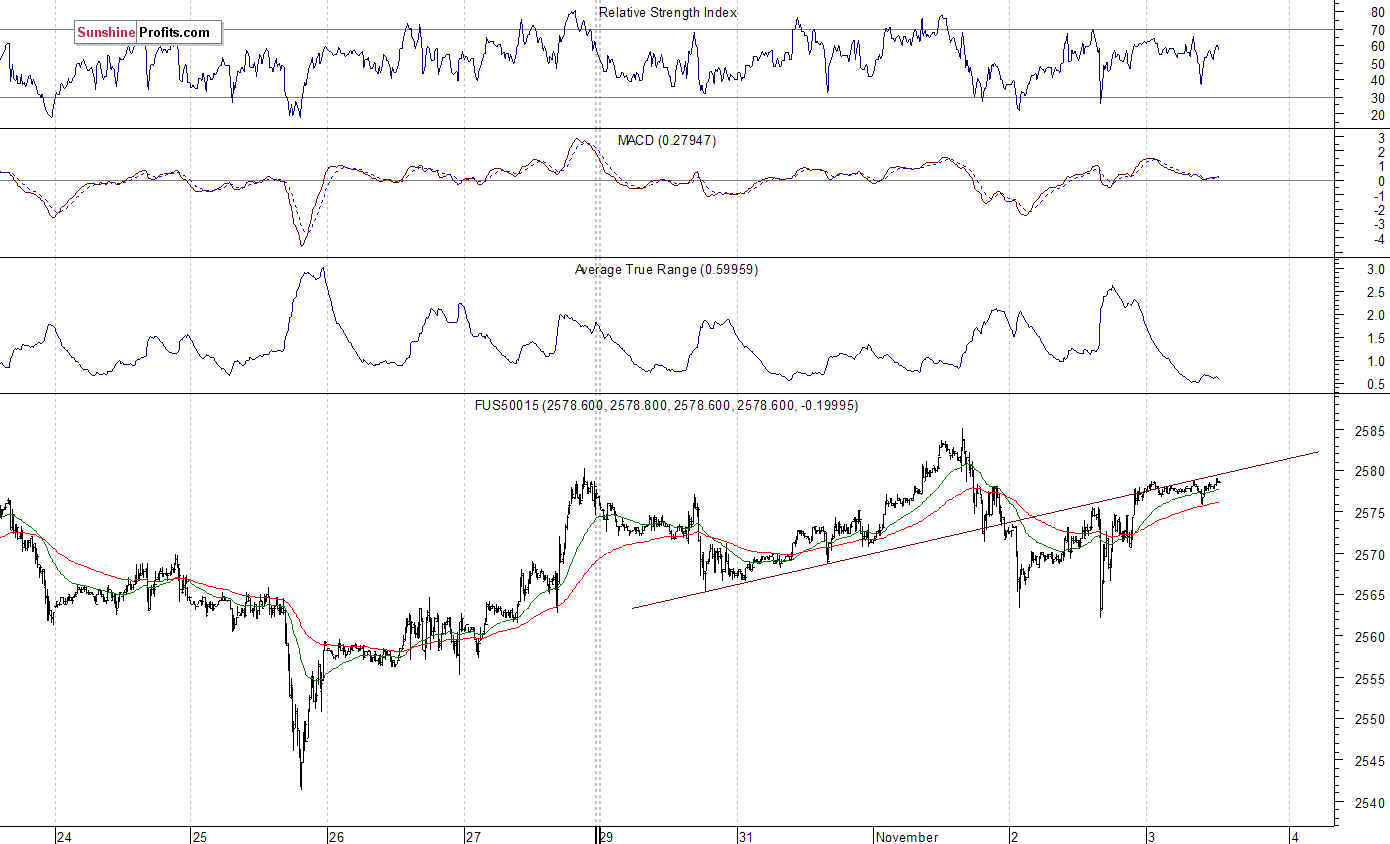
Expectations before the opening of today's trading session are positive, with index futures currently between +0.1% and +0.4% vs. their yesterday's closing prices. The European stock market indexes have gained 0.1-0.3% so far. Investors will wait for some important economic data announcements: Nonfarm Payrolls, Unemployment Rate, Trade Balance at 8:30 a.m., ISM Services number at 10:00 a.m. The market expects that Nonfarm Payrolls were at +312,000 in October. Investors will also wait for more quarterly corporate earnings releases. The S&P 500 futures contract trades within an intraday consolidation following yesterday's intraday move up. The nearest important level of support is at around 2,560-2,565, marked by local lows. On the other hand, resistance level is at 2,580-2,585, marked by new record high. The futures contract trades along its previously broken upward trend line, as the 15-minute chart shows:
Will Apple's Move Drive Nasdaq Higher?
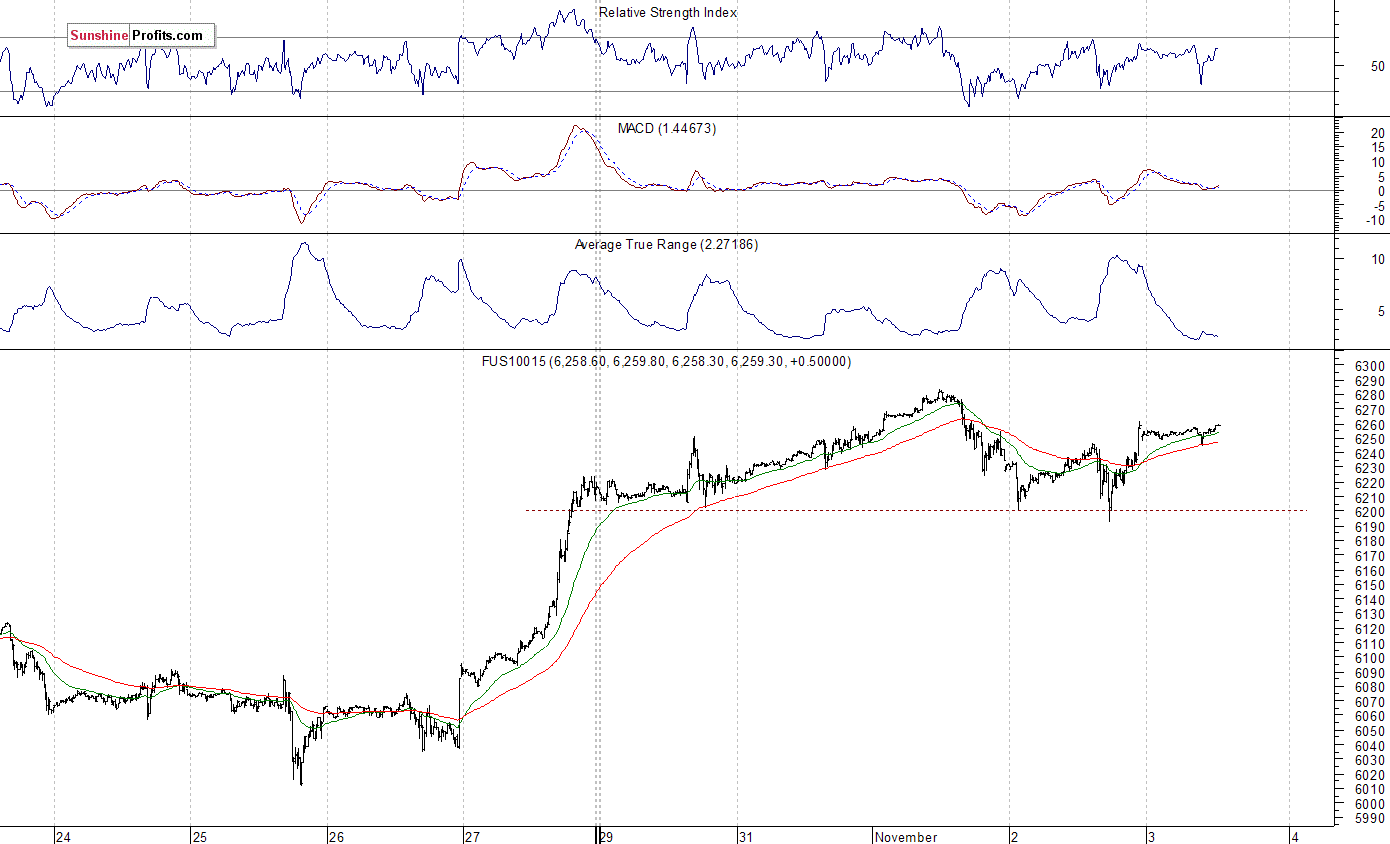
The technology Nasdaq 100 futures contract follows a similar path, as it fluctuates following yesterday's rebound off session's lows. Investors react to better-than-expected quarterly earnings release from Apple. The nearest important level of resistance is at around 6,260-6,280, marked by new all-time high. On the other hand, support level is at 6,200, among others. The Nasdaq 100 futures contract extends its short-term consolidation above support level of 6,200, as we can see on the 15-minute chart:
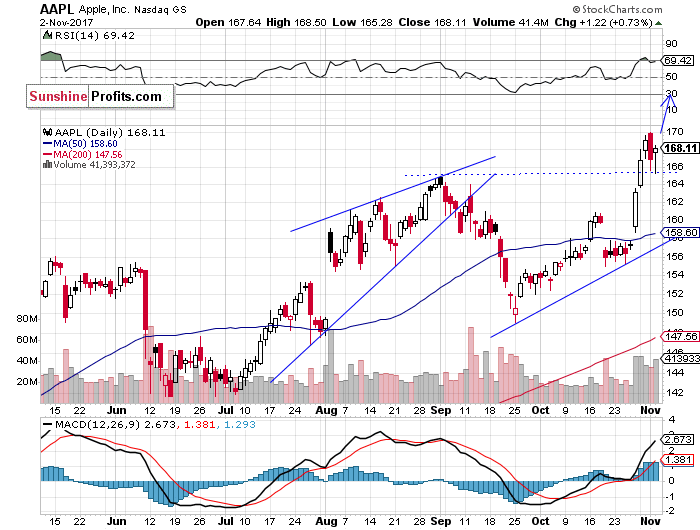
Let's take a look at Apple, Inc. stock (AAPL) daily chart (chart courtesy of http://stockcharts.com). The price broke above its September 1 all-time high on Monday, and it reached new record high of $169.94 on Wednesday. Expectations before the opening of today's trading session are very bullish, following yesterday's after-hours quarterly earnings release. But will the uptrend continue despite some clear technical overbought conditions? We can say that something (i.e. individual asset, entire market, technical indicator) is overbought when its value rises so high that (according to the technical analysis) it’s unlikely to advance even further. Generally, an overbought market is a sign that a downward correction is likely to occur. Traders use indicators such as Relative Strength Index (RSI), Stochastic Oscillator, Money Flow Index to identify overbought conditions. For example, one can view a given market as “overbought” if the RSI indicator for this market is above 70.
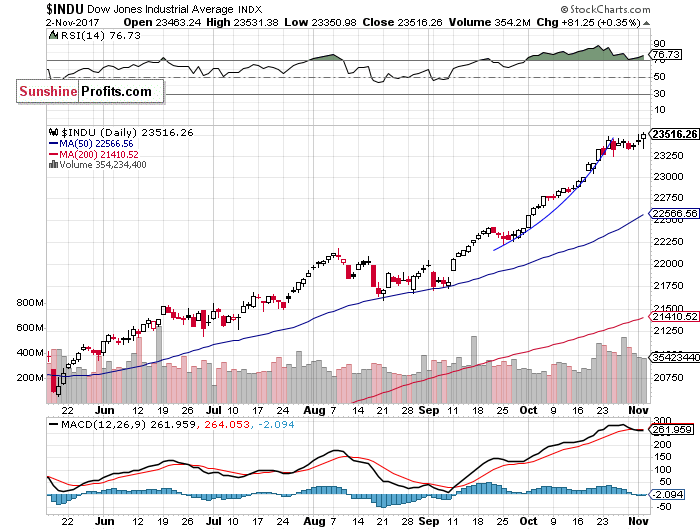
The Dow Jones Industrial Average daily chart (chart courtesy of http://stockcharts.com) shows that blue-chip index reached new all-time high on Thursday, as it broke above 23,500 mark. Will the uptrend accelerate again? Or is this some topping pattern before downward correction?
Concluding, the S&P 500 index extended its short-term consolidation on Thursday, as it bounced off support level at around 2,565. Is this a topping pattern before some downward reversal or just pause within an uptrend? There have been no confirmed negative signals so far. However, we still can see medium-term overbought conditions along with negative technical divergences.
Currently, we prefer to be out of the market, avoiding low risk/reward ratio medium-term trades. We will let you know when we think it is safe to get back in the market.
To summarize: no medium-term positions are justified from the risk/reward perspective at this moment.
Intraday trade:
S&P 500 index - short position: profit target level: 2,545; stop-loss level: 2,595,
S&P 500 futures contract (September) - short position: profit target level: 2,542; stop-loss level: 2,592
SPY ETF (SPDR S&P 500, not leveraged) - short position: profit target level: $254.5; stop-loss level: $259.5
Medium-term trade:
No medium-term position is justified from the risk/reward perspective at this moment.
Thank you.
Paul Rejczak
Stock Trading Strategist
Stock Trading Alerts

