

Briefly:
Intraday trade: The S&P 500 lost 0.2% on Tuesday, after opening virtually flat. The market will probably open higher today. We may see some more short-term sideways trading action and an increased volatility following the Rate Decision release at 2:00 p.m.
Trading position (short-term; our opinion): no positions are justified from the risk/reward perspective.
Our short-term outlook is neutral, and our medium-term outlook is neutral:
Short-term outlook (next 1-2 weeks): neutral
Medium-term outlook (next 1-3 months): neutral
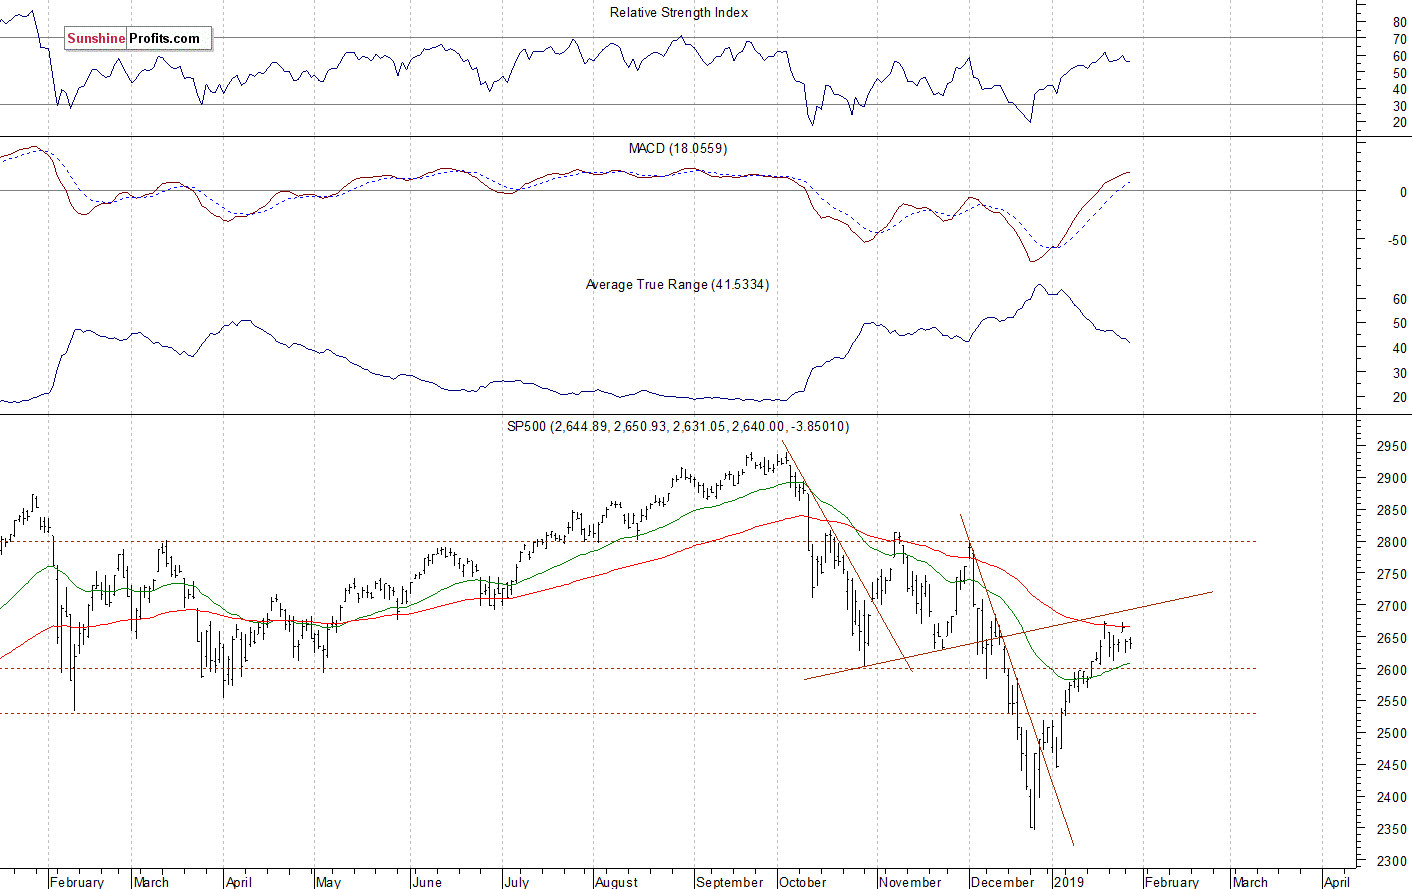
The U.S. stock market indexes were mixed between -0.8% and +0.2% on Tuesday, extending their two-week-long consolidation, as investors hesitated ahead of quarterly earnings releases. The S&P 500 index continues to trade along the 50% retracement of its October-December downward correction of 20.2% (2,643.74). It has gained almost 330 points from the late December medium-term low, but it is still around 300 points below the September 21st record high of 2,940.91. The Dow Jones Industrial Average gained 0.2% and the Nasdaq Composite lost 0.8% on Tuesday.
The nearest important resistance level of the S&P 500 index is at 2,645-2,655, marked by the recent support level and Monday's daily gap down of 2,644.97-2,657.33. The next resistance level is at 2,675-2,685, marked by the early December local highs. The resistance level is also at 2,700-2,710. On the other hand, the nearest important support level is at around 2,620-2,625, marked by Monday's daily low. The support level is also at 2,600-2,610.
The broad stock market broke below its two-month-long trading range in the mid-December, as the S&P 500 index fell below the level of 2,600. Then the market accelerated lower and it broke below the 2,400 mark. Since then, the market has retraced more than 50% of the whole decline off the September high. The index trades close to a possible resistance level of its previously broken upward trend line, as we can see on the daily chart:
Positive Expectations Ahead of Data, Earnings Releases
The index futures contracts trade 0.4-0.8% above their Tuesday's closing prices. So expectations before the opening of today's trading session are positive following yesterday's Apple quarterly earnings release. The European stock market indexes have been mixed so far. Investors will wait for series of important economic data announcements today: ADP Non-Farm Employment Change at 8:15 a.m., Pending Home Sales number at 10:00 a.m., Crude Oil Inventories at 10:30 a.m., the FOMC Statement at 2:00 p.m. Investors will also wait for the quarterly corporate earnings releases. The broad stock market will likely extend its short-term consolidation. There have been no confirmed negative signals so far. So it still looks like a flat correction within an uptrend.
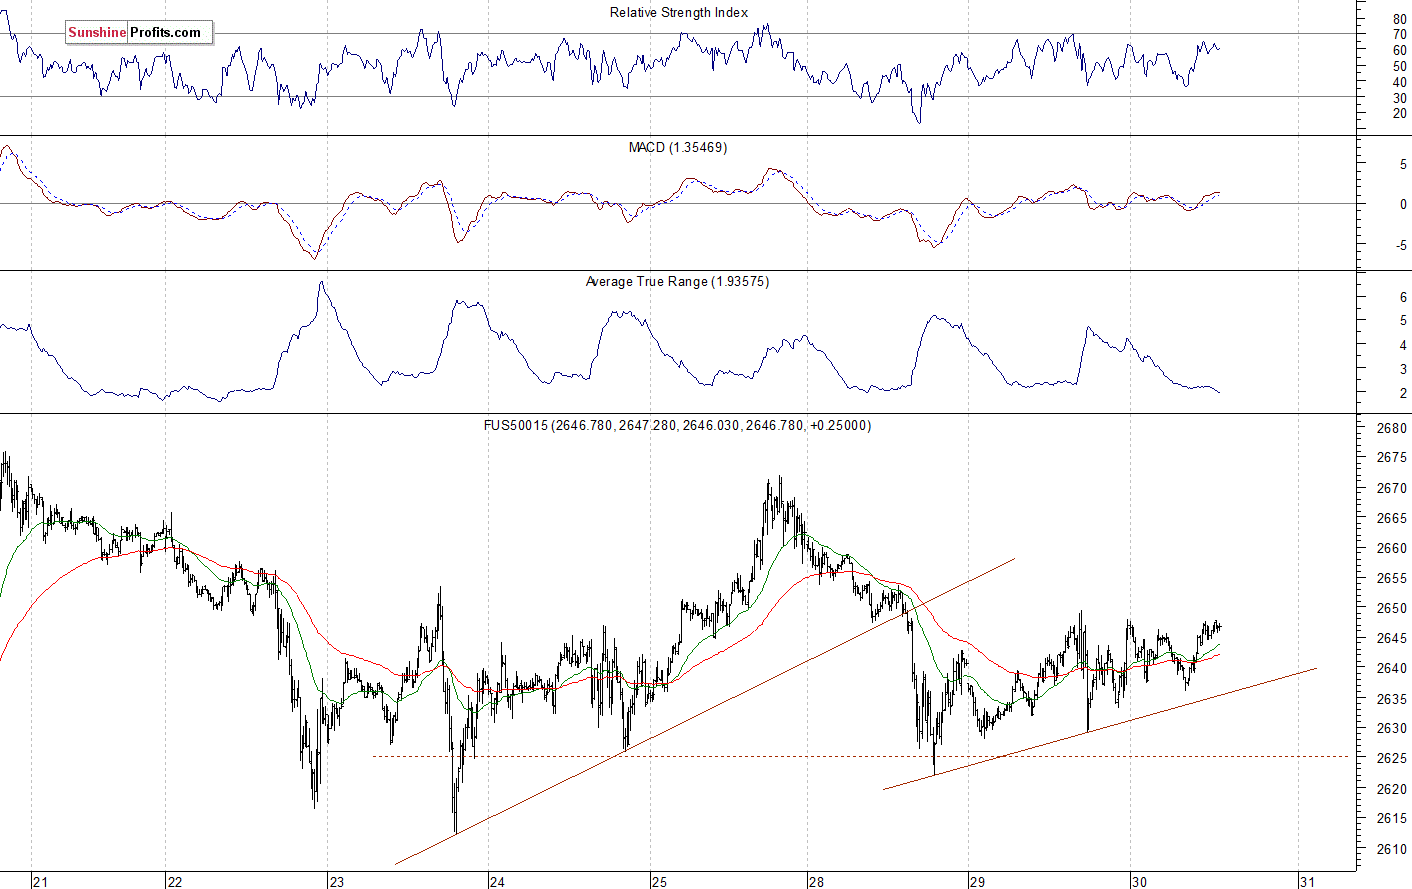
The S&P 500 futures contract trades within an intraday consolidation following yesterday's after-hours quick advance. The nearest important resistance level is at 2,650, marked by the short-term local highs. The next resistance level is at 2,660-2,670. On the other hand, the support level is at 2,620-2,630, marked by the local lows. The futures contract is above its two-day-long upward trend line, as the 15-minute chart shows:
Nasdaq Going Sideways
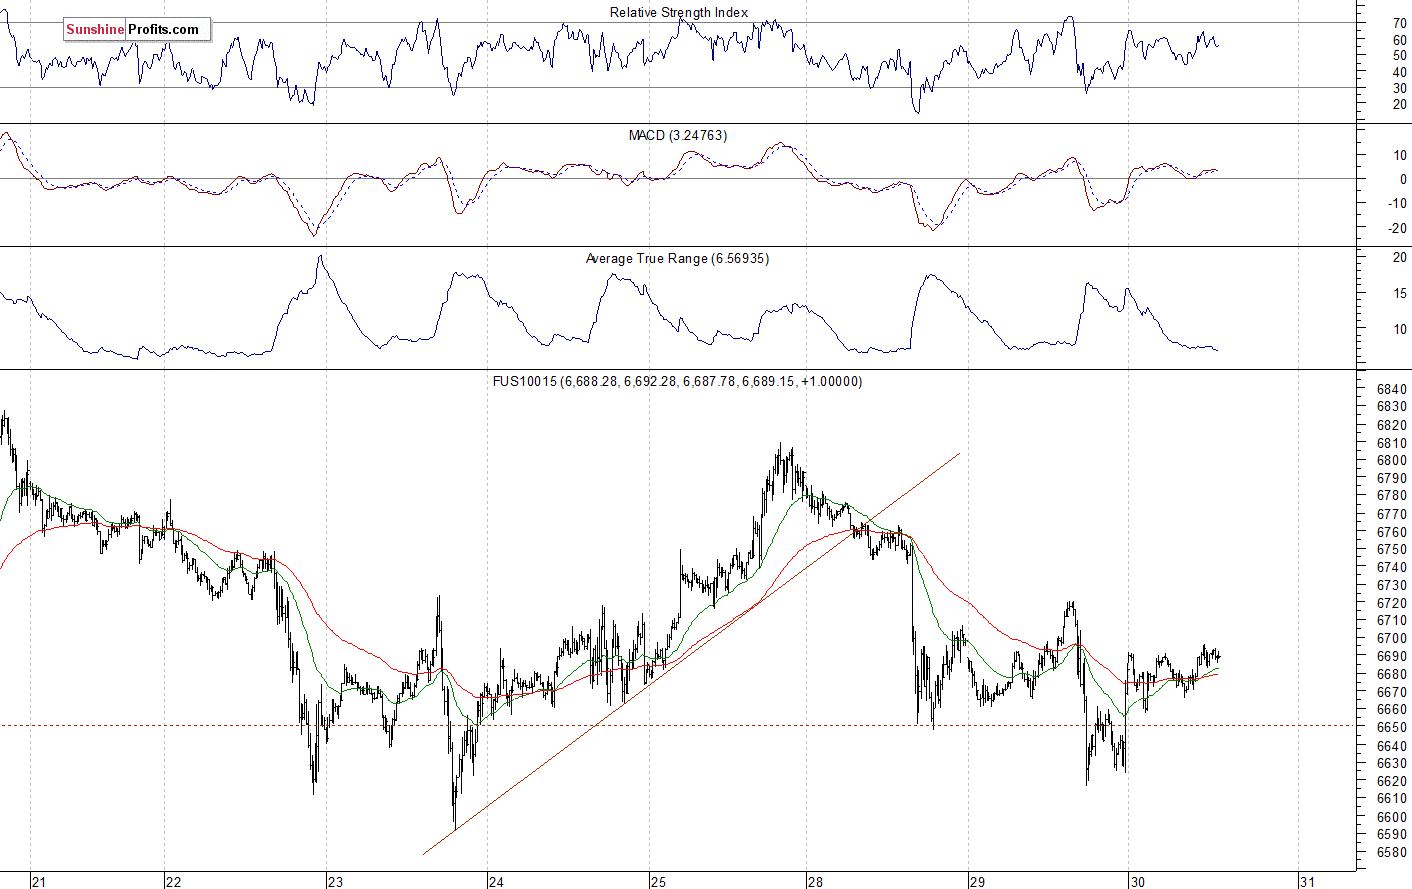
The technology Nasdaq 100 futures contract follows a similar path, as it trades within an intraday consolidation after bouncing off the support level. The market gained over 1,000 points from December the 26th local low of around 5,820 in the recent weeks. The nearest important resistance level remains at 6,750-6,800. The support level is at 6,600-6,650, marked by the recent fluctuations. The Nasdaq futures contract remains close to the 6,700 mark, as we can see on the 15-minute chart:
Big Cap Tech Stocks to Resume Uptrend?
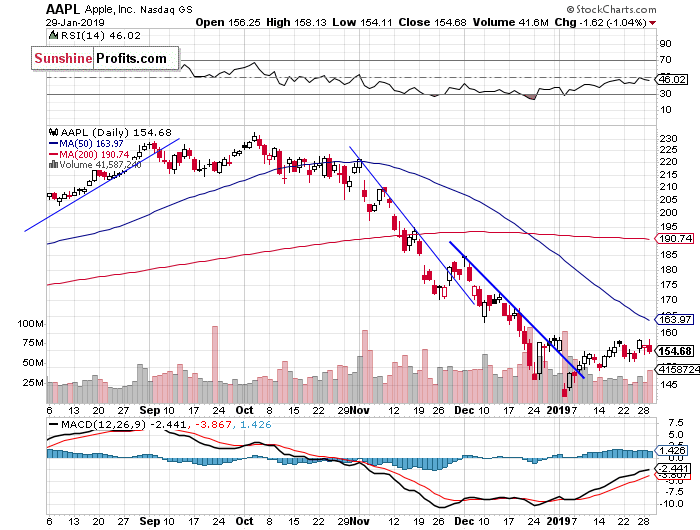
Let's take a look at the Apple, Inc. stock (AAPL) daily chart (chart courtesy of http://stockcharts.com). Apple released its quarterly earnings yesterday after the trading session's close. The stock is expected to open around 5% higher today and it is likely to break above the recent trading range and the resistance level of $155-160. The next possible resistance level is at $170:
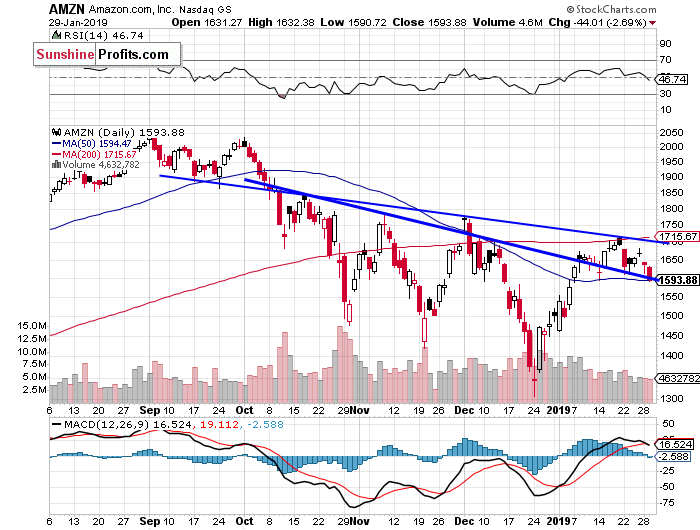
Now let's take a look at the daily chart of Amazon.com, Inc. (AMZN). The market broke above one of its three-month-long downward trend lines recently. Since then it goes sideways. There is a resistance level at around $1,700-1,750. On the other hand, the support level is at $1,550-1,600:
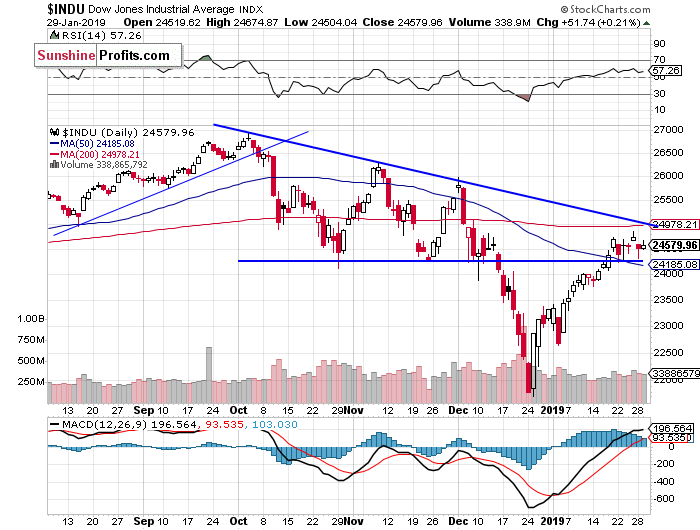
Dow Jones - Flat Correction or a Topping Pattern?
The Dow Jones Industrial Average extended its short-term uptrend more than a week ago, as it broke above the recent trading range. The market is back above its October-December local lows. So will it continue higher and reach the record high again? There have been no confirmed negative signals so far. However, the resistance level remains at the mentioned 25,000 level:
The S&P 500 index extended its short-term consolidation yesterday, as it continued to trade along the mentioned 50% retracement of the whole October-December decline. Is this a new medium-term uptrend or still just an upward correction before another medium-term leg lower? The market trades within a two-week-long short-term consolidation. For now, it looks like a flat correction within an uptrend.
Concluding, the S&P 500 index will likely open higher today. We may see some more fluctuations ahead of the important economic data announcements and the quarterly corporate earnings releases.
Trading position (short-term; our opinion): no positions are justified from the risk/reward perspective.
Thank you.
Paul Rejczak
Stock Trading Strategist
Stock Trading Alerts

