

Briefly:
Intraday trade: The S&P 500 gained 1.5% on Monday, after opening 0.2% higher. The market will probably open lower today. We may see some short-term uncertainty as stocks get closer to their recent local highs.
Trading position (short-term; our opinion): no positions are justified from the risk/reward perspective.
Our short-term outlook is neutral, and our medium-term outlook is neutral:
Short-term outlook (next 1-2 weeks): neutral
Medium-term outlook (next 1-3 months): neutral
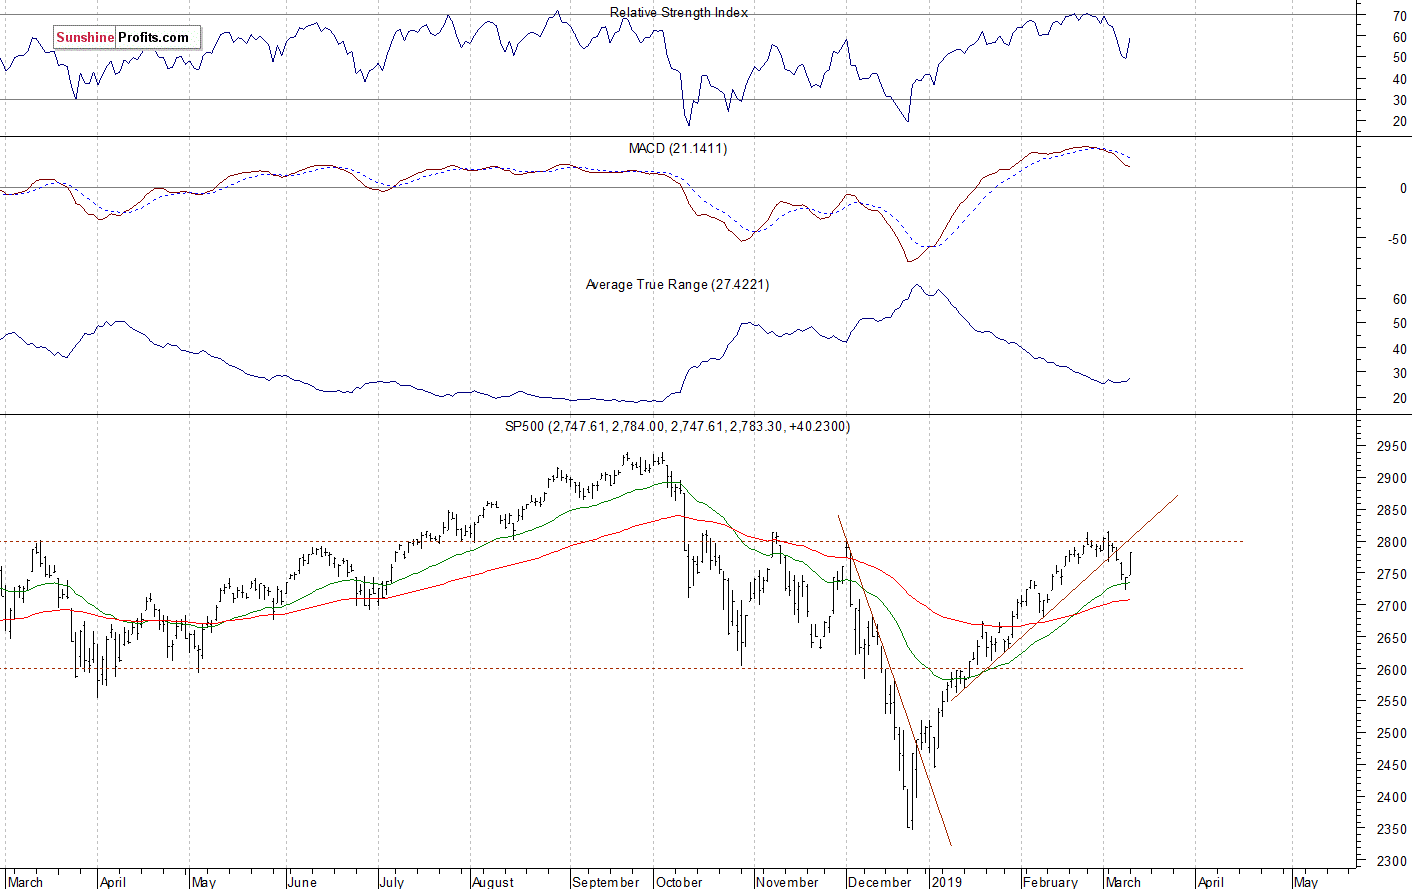
The U.S. stock market indexes gained between 0.8% and 2.0% on Monday, retracing some of their last week's decline as investors' sentiment improved again. The S&P 500 index retraced more of its October-December downward correction of 20.2% a week ago, before reversing lower and getting back below the 2,800 level. The market fluctuated close to the previous medium-term local highs and then it retraced most of its February's advance. But it came back higher yesterday. The Dow Jones Industrial Average gained 0.8% and the Nasdaq Composite gained 2.0% on Monday.
The nearest important resistance level of the S&P 500 index is now at around 2,800-2,820, marked by the medium-term local highs. On the other hand, the support level is at 2,745-2,750, marked by the yesterday's daily gap up of 2,744.13-2,747.61. The support level is also at 2,720-2,730, marked by the mid-February local low.
The broad stock market retraced all of its December sell-off and it got close to the medium-term resistance level of around 2,800, marked by the October-November local highs recently. So is it still just a correction or a new medium-term uptrend? The market broke above the 61.8% Fibonacci retracement of the 20% decline. And we may see an attempt at getting back to the record highs. But will the index break above the mentioned previous local highs? There have been no confirmed negative signals so far. However, the index broke below the two-month-long upward trend line on Thursday:
Slightly Negative Expectations, Just Correction?
Expectations before the opening of today's trading session are negative, because the index futures contracts trade 0.2-0.4% below their Monday's closing prices. The European stock market indexes have been mixed so far. Investors will wait for the Consumer Price Index release at 8:30 a.m. The broad stock market will likely fluctuate following Monday's rally. We may see some short-term uncertainty, as the index gets closer to the 2,800 mark again.
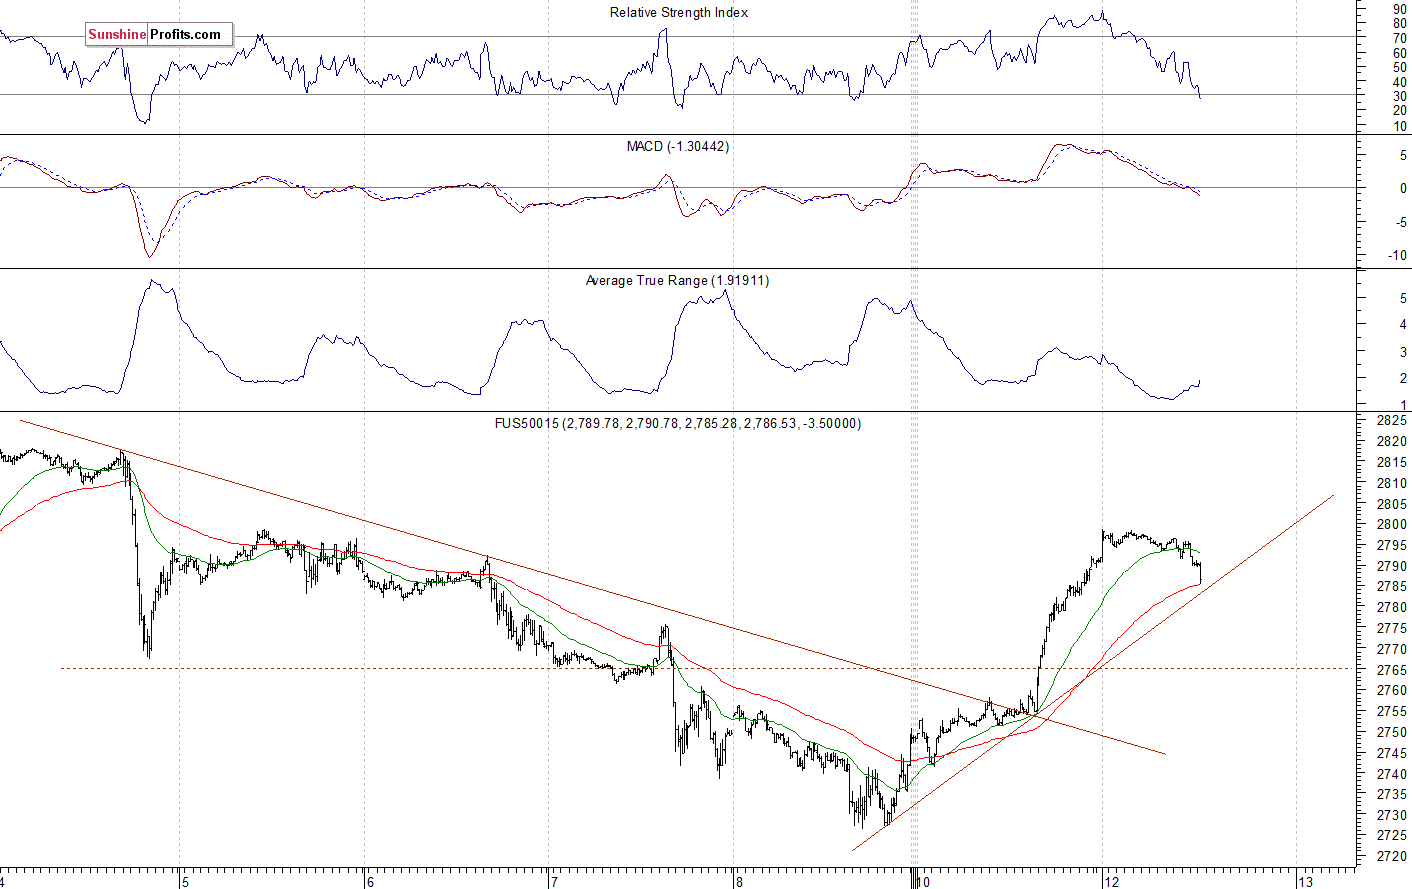
The S&P 500 futures contract trades within an intraday downtrend, as it retraces some of its yesterday's after-hours advance. The nearest important resistance level is now at around 2,800. On the other hand, the support level is at 2,770-2,775, among others. The futures contact is above its two-day-long upward trend line, as the 15-minute chart shows:
Nasdaq at 7,200 Mark
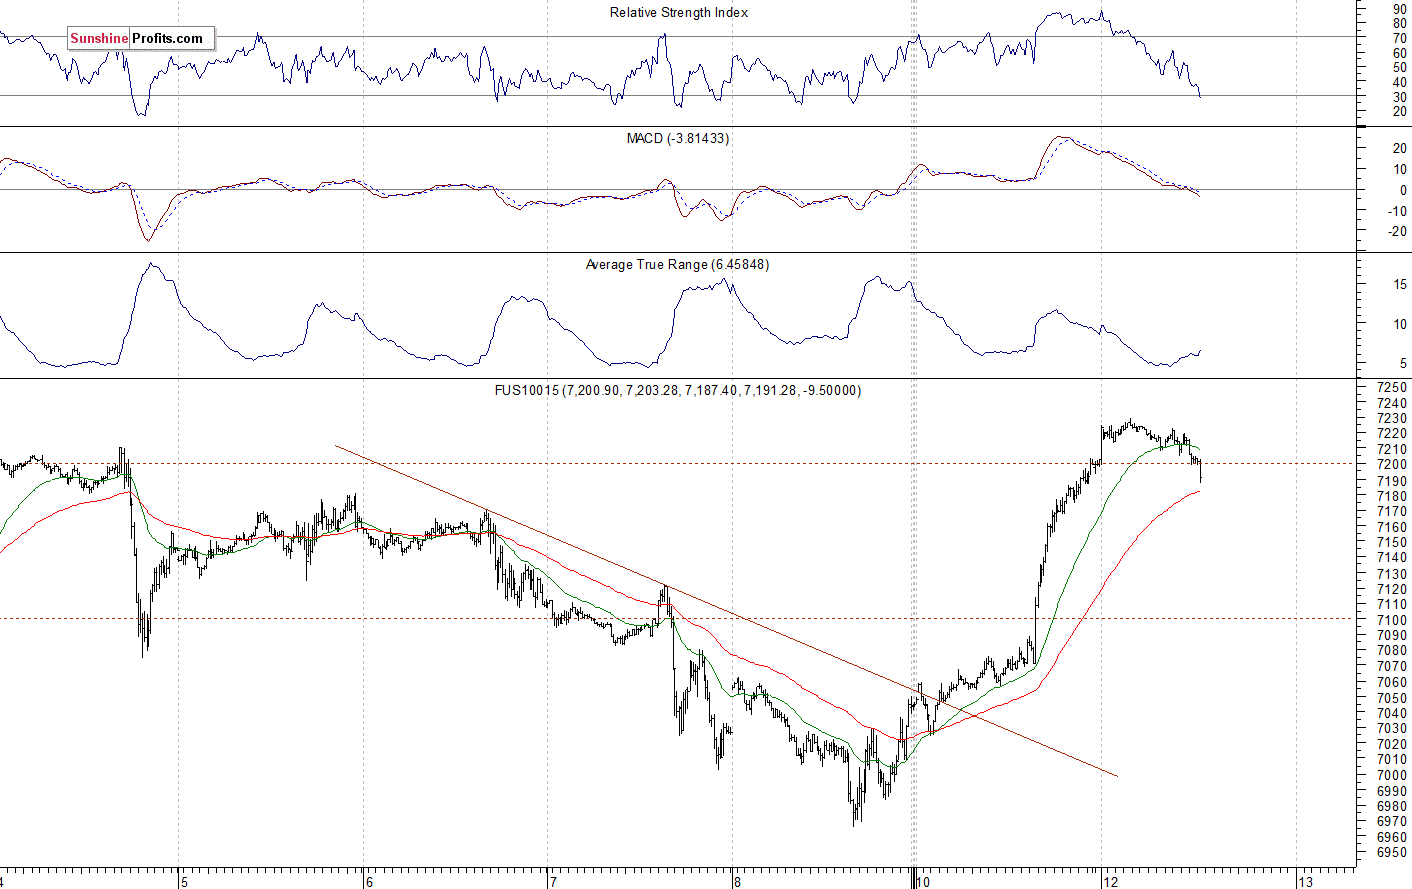
The technology Nasdaq 100 futures contract follows a similar path, as it retraces some of its yesterday's rally this morning. The market fell below the 7,000 mark on Friday, as investors took profits off the table following an almost 1,400-point rally from December the 26th local low of around 5,820. Then it came back the 7,200 level and reached the new medium-term high. The nearest important resistance level is at around 7,200-7,250. On the other hand, the support level is now at 7,100-7,150. The Nasdaq futures contract gets back slightly below the 7,200 level, as we can see on the 15-minute chart:
Apple, Amazon - Big Cap Tech Stocks Rallying
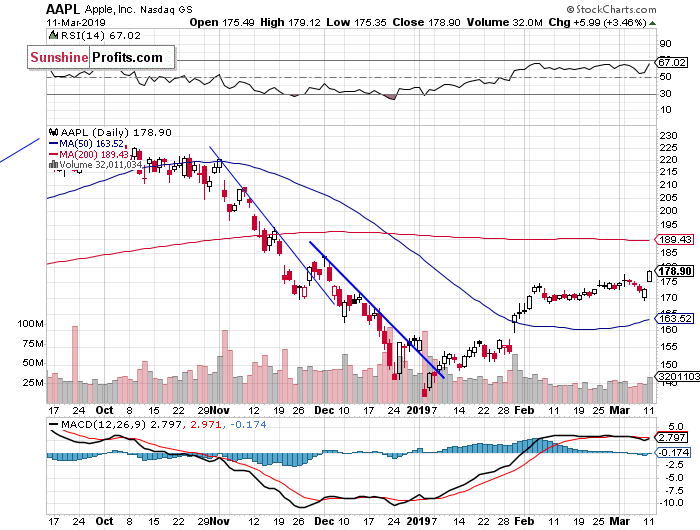
Let's take a look at the Apple, Inc. stock (AAPL) daily chart (chart courtesy of http://stockcharts.com). The market broke above its recent local highs yesterday and it got closer to the $180 level. The next resistance level is at $190-200. There have been no confirmed negative signals so far:
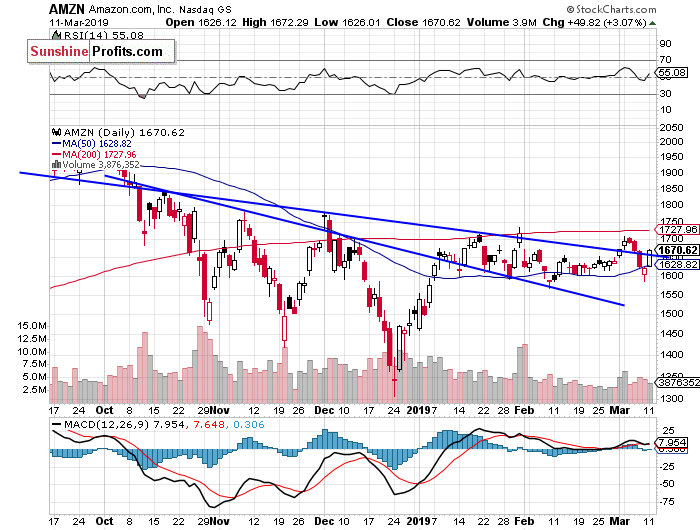
Now let's take a look at the daily chart of Amazon.com, Inc. (AMZN). The market retraced some of its recent declines, as it gained more than 3% yesterday. However, it continues to trade slightly below the medium-term downward trend line. There is a relatively important resistance level of around $1,700-1,750, marked by the previous local highs:
Dow Jones Also Higher
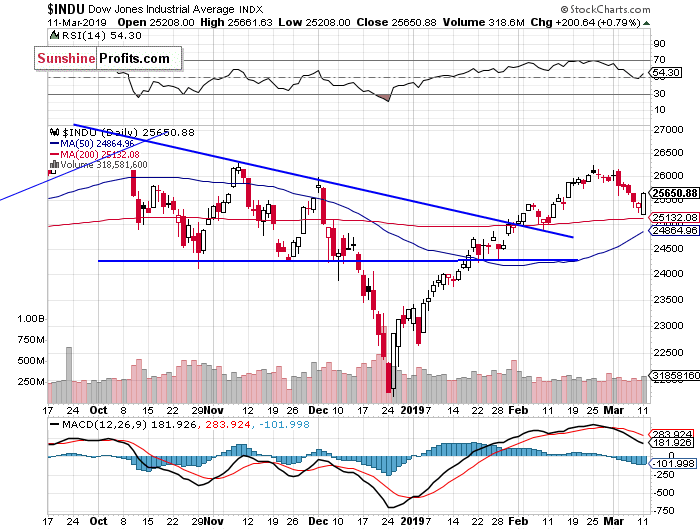
The Dow Jones Industrial Average retraced some of its last week's decline yesterday, following bouncing off the support level of around 25,000-25,500. For now, it looks like an upward correction. However, if the blue-chip stocks' gauge breaks above the 26,000 level, we could see more buying pressure:
The S&P 500 index slightly extended its recent run-up a week ago, before reversing lower and getting back below the 2,800 level. Then it retraced some more of its recent advances and it broke below the two-month-long upward trend line on Thursday. So it bounced off the mentioned medium term resistance level. For now it looks like a correction within an uptrend.
Concluding, the S&P 500 index will likely open lower today. We may see some short-term uncertainty following the yesterday's rally. There may be some profit-taking action.
Trading position (short-term; our opinion): no positions are justified from the risk/reward perspective.
Thank you.
Paul Rejczak
Stock Trading Strategist
Sunshine Profits - Effective Investments through Diligence and Care

