

Briefly:
Intraday trade: The S&P 500 index gained 0.8% on Monday after opening 0.4% higher. The broad stock market will probably open slightly higher again today. Then we may see some short-term uncertainty, as stocks trade along their potential resistance level of around 2,900. We prefer to be out of the market, avoiding low risk/reward ratio trades.
Trading position (short-term; our opinion): no short-term positions are justified from the risk/reward perspective.
Our intraday outlook is neutral. Our short-term outlook is neutral, and our medium-term outlook is neutral:
Intraday outlook (next 24 hours): neutral
Short-term outlook (next 1-2 weeks): neutral
Medium-term outlook (next 1-3 months): neutral
The U.S. stock market indexes gained 0.8-1.0% on Monday, accelerating their short-term uptrend, as investors' sentiment remained bullish following the recent advance. The S&P 500 index has reached the new record high at the level of 2,898.25. The Dow Jones Industrial Average gained 1.0% and the technology Nasdaq Composite gained 0.9% yesterday.
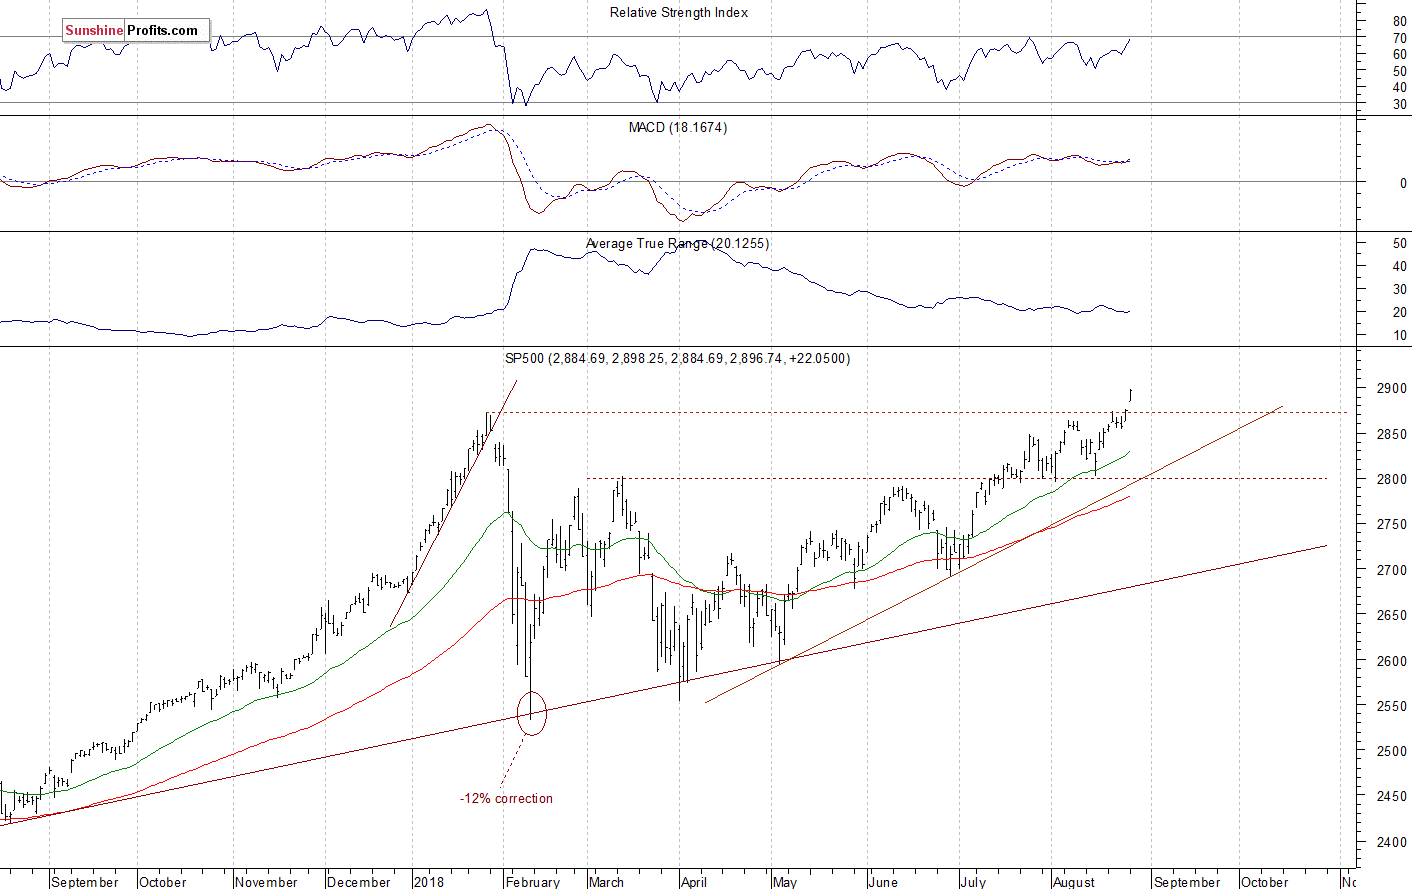
The nearest important level of support of the S&P 500 index is now at around 2,875-2,885, marked by yesterday's daily gap up of 2,876.16-2,884.69. The next support level is at 2,860-2,865, marked by the previous short-term resistance level. The support level is also at 2,850. On the other hand, potential resistance level is at around 2,900.
The broad stock market reached the new record high yesterday, as it got closer to the level of 2,900. We may see some more upward price action in the near term, but some downward correction may be coming. The market has retraced its late January - early February downward correction recently. So will it continue towards 3,000 mark? The index trades above its medium-term upward trend line, as we can see on the daily chart:
Close to New Record High
The index futures contracts trade 0.1-0.2% above their yesterday's closing prices. It means that the expectations before the opening of today's trading session are slightly positive. The European stock market indexes have gained 0.2-0.3% so far. Investors will wait for some economic data announcements today: Trading Balance, Wholesale Inventories at 8:30 a.m., Consumer Confidence number, Richmond Manufacturing Index at 10:00 a.m. The broad stock market will probably open virtually flat to slightly higher today. Then we may see some short-term fluctuations following yesterday's rally. There have been no confirmed negative signals so far. However, we can see some short-term technical overbought conditions.
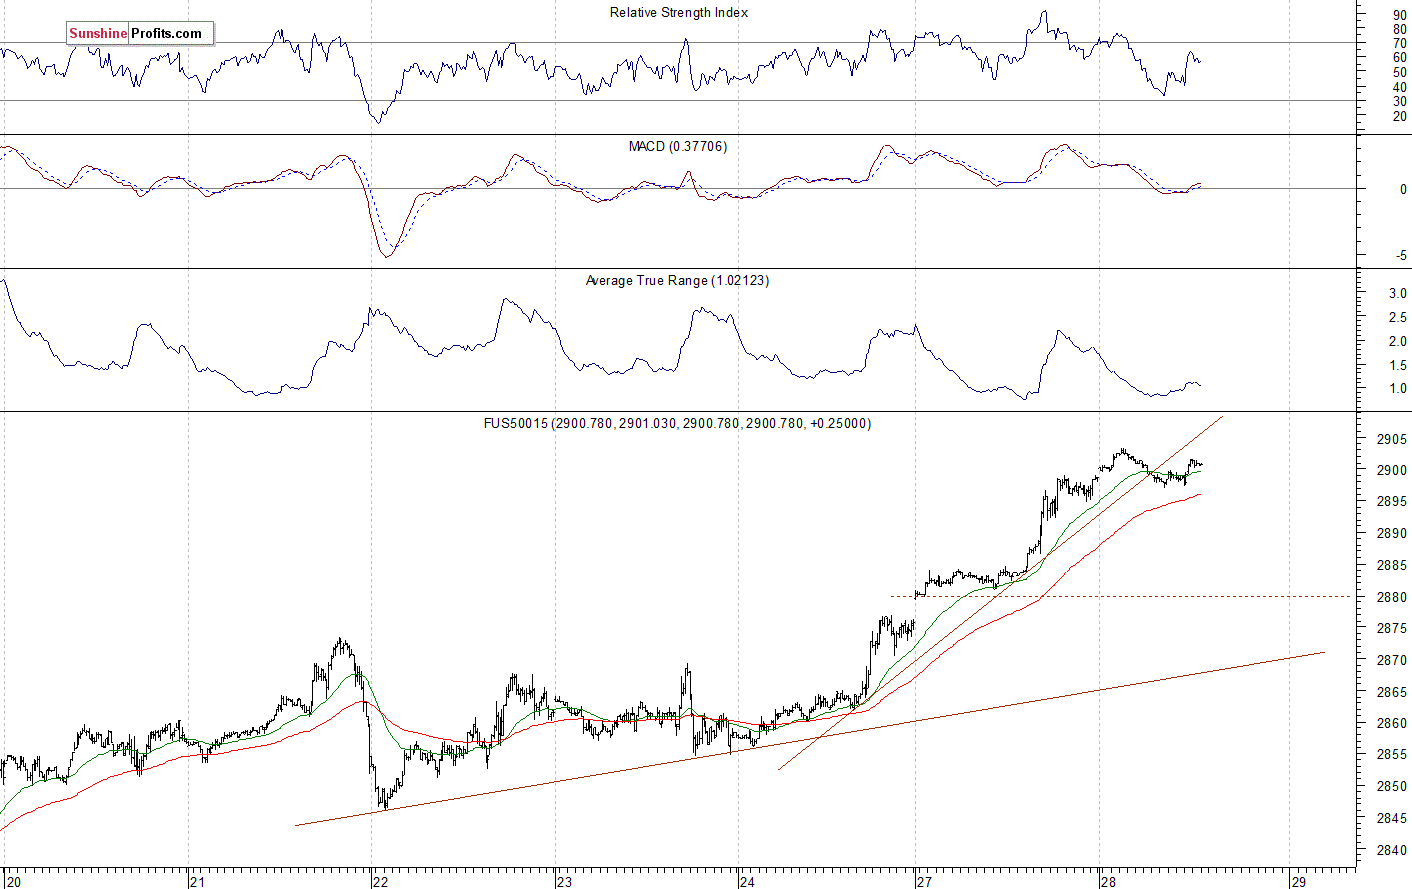
The S&P 500 futures contract trades within an intraday consolidation following its yesterday's run-up. The market remains close to the new record high above the level of 2,900. The nearest important level of support is at around 2,885-2,890, marked by the recent fluctuations. The support level is also at 2,870-2,875. The futures contract trades below its two-day-long upward trend line, as the 15-minute chart shows:
Nasdaq Also Higher
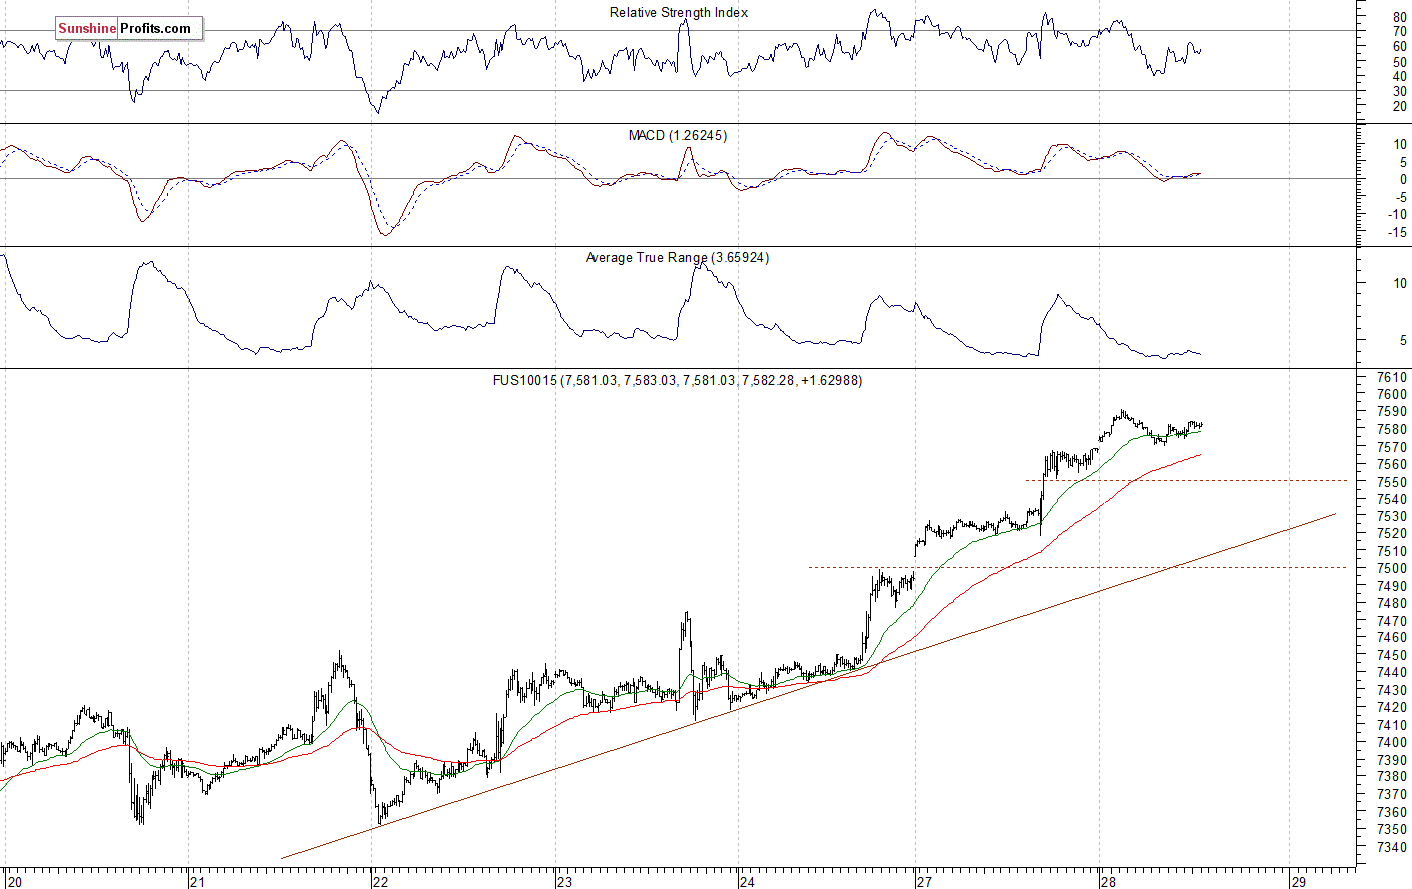
The technology Nasdaq 100 futures contract follows a similar path, as it trades within an intraday consolidation along its new record high. The market trades closer to the level of 7,600. On the other hand, the nearest important level of support is now at around 7,530-7,550, marked by the previous resistance level. The support level is also at the level of 7,500. The Nasdaq futures contract is just below 7,600 mark, as we can see on the 15-minute chart:
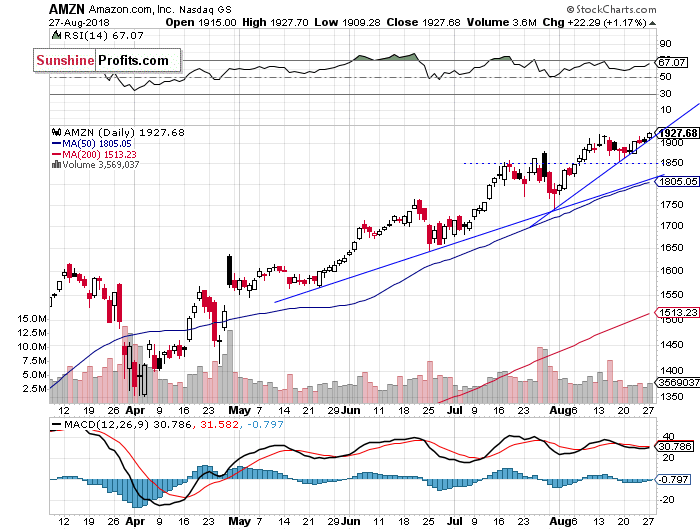
Amazon at new Record, Apple Just Below the Record
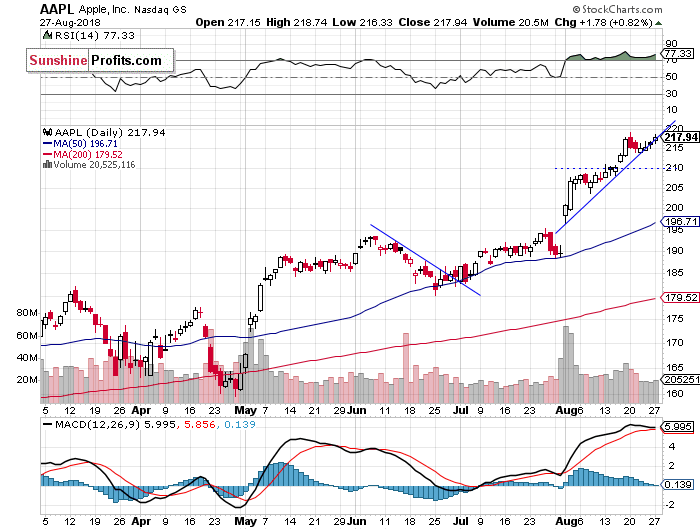
Let's take a look at Apple, Inc. stock (AAPL) daily chart (chart courtesy of http://stockcharts.com). It reached the new record high at the level of $219.18 a week ago on Monday. Since then it fluctuated. There have been no confirmed negative signals so far. However, we may see a downward correction at some point. The nearest important level of support is now at $205-210, marked by the recent consolidation. The price is still at its upward trend line:
Now let's take a look at Amazon.com, Inc. stock (AMZN) daily chart. It has reached the new record high at the price of $1,927.70 yesterday. The stock continues to trade above its month-long upward trend line. Will the uptrend accelerate again? We can see some negative technical divergences. However, there have been no confirmed negative signals so far:
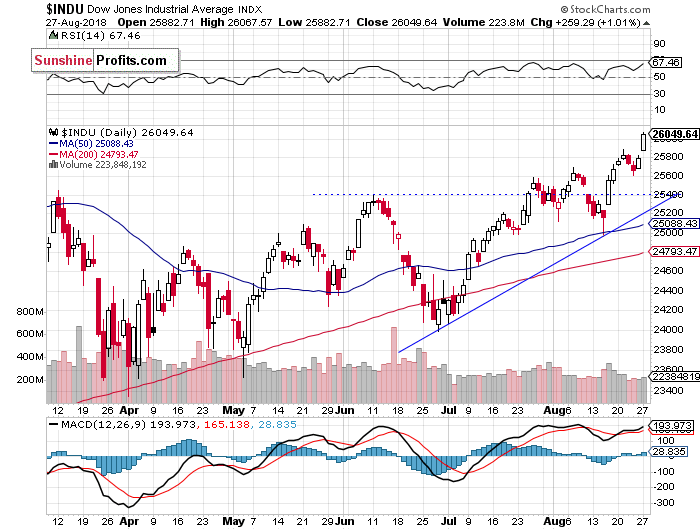
Dow Jones Breaking Higher
The Dow Jones Industrial Average reached the new local high after breaking above its last week's high. The blue-chip stocks' gauge is now slightly above the level of 26,000. But it continues to trade below its late January record high of 26,616.71. The nearest important level of resistance is at 26,340-26,440, marked by the late January daily gap down. The index remains above its two-month long upward trend line, as the daily chart shows:
The S&P 500 index got closer to the level of 2,900 yesterday. We may see some short-term uncertainty following the recent rally. However, there have been no confirmed negative signals so far. The broad stock market will likely continue towards new record highs.
Concluding, the S&P 500 index will likely open slightly higher today. But then we may see some profit-taking action. Investors may take some short-term profits off the table following the recent run-up. Investors will react to the mentioned economic data announcements today.
Intraday trade:
No intraday position is justified from the risk/reward perspective today.
Trading position (short-term; our opinion): no short-term positions are justified from the risk/reward perspective.
Thank you.
Paul Rejczak
Stock Trading Strategist
Stock Trading Alerts

