

Briefly:
Intraday trade: Our yesterday's neutral intraday outlook has proved accurate. The S&P 500 index continued to fluctuate within a relatively narrow trading range following Tuesday's advance. The market may retrace some of its recent rally today, as the S&P 500 index trades close to potential resistance level of 2,500. On the other hand, support level is relatively close, at Tuesday's daily gap up of 2,488.95-2,490.37. Therefore, we still prefer to be out of the market, avoiding low risk/reward ratio trades.
Medium-term trade: In our opinion, short position is favored (opened on June 5 at 2,437.83, with stop-loss at 2,510, and profit target at 2,300, S&P 500 index).
Our intraday outlook remains neutral, and our short-term outlook is bearish, as we expect downward correction. Our medium-term outlook remains bearish:
Intraday outlook (next 24 hours): neutral
Short-term outlook (next 1-2 weeks): bearish
Medium-term outlook (next 1-3 months): bearish
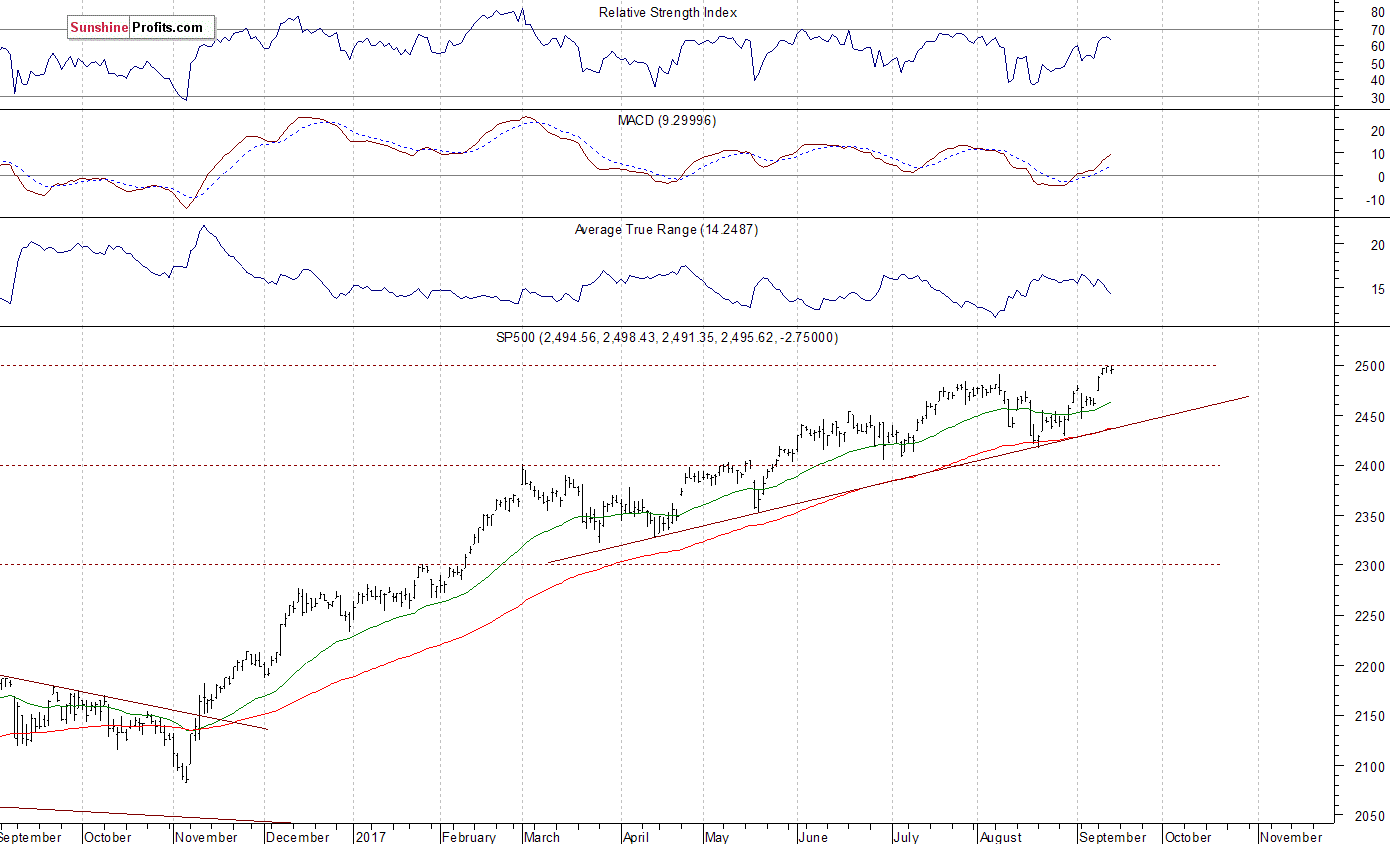
The main U.S. stock market indexes were mixed between -0.5% and +0.2% on Thursday, as investors hesitated following recent move up. The S&P 500 index has reached new all-time high at the level of 2,498.43, slightly above its Wednesday's high and almost 8 points above its previous August 8 high of 2,490.87. The Dow Jones Industrial Average broke above its previous record high of 22,179.1, as it reached the level of 22,216.4 yesterday. The technology Nasdaq Composite index continues to trade very close to record high of 6,460.84. However, it was relatively weaker than the broad stock market following Apple stock move down, among others. Overall, the S&P 500 index remains unchanged since Tuesday. The nearest important level of resistance of this broad stock market index is at around 2,500. On the other hand, support level is at 2,490, marked by Tuesday's daily gap up of 2,488.95-2,490.37. The next support level remains at around 2,465-2,475, marked by Monday's daily gap up of 2,467.11-2,474.52. The level of support is also at 2,460, marked by last week's short-term consolidation. The S&P 500 index resumed its long-term uptrend, as it reached new record high just below 2,500 mark. Will uptrend continue? Or is this a medium-term topping pattern ahead of downward correction? There have been no confirmed negative signals so far. However, we still can see medium-term overbought conditions accompanied by negative technical divergences:
Mixed Expectations
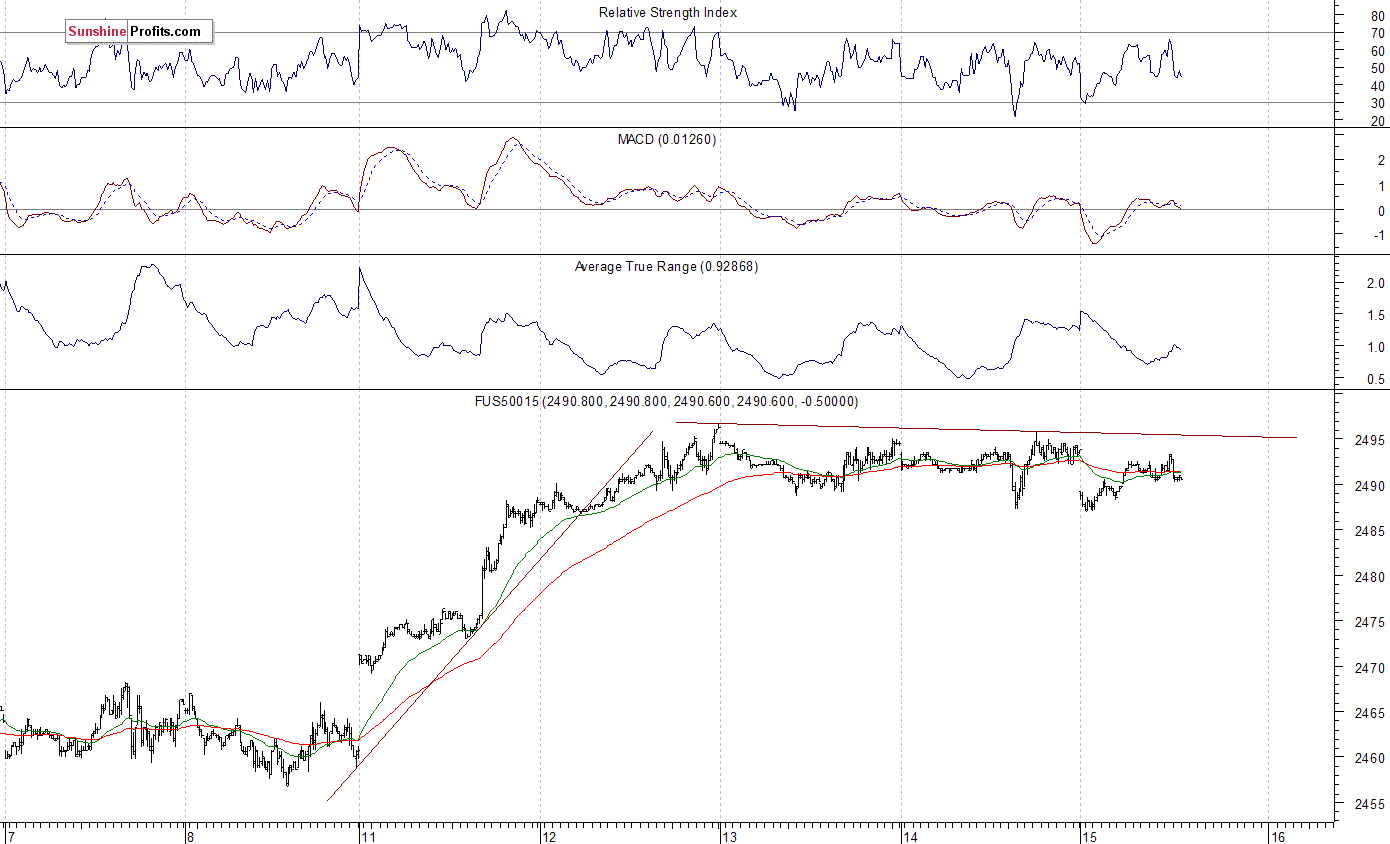
Expectations before the opening of today's trading session are mixed, with index futures currently between -0.2% and +0.1% vs. their Thursday's closing prices. The European stock market indexes have been mixed so far. Investors will now wait for series of economic data announcements: Retail Sales, Empire State Manufacturing at 8:30 a.m., Industrial Production, Capacity Utilization at 9:15 a.m., Michigan Sentiment, Business Inventories at 10:00 a.m. The market expects that Retail Sales grew 0.1% (Core Retail Sales +0.5%), and the Industrial Production output grew 0.1% in August. Investors will also wait for today's futures contracts and options expiration, known as 'Triple Witching'. Will this bring some intraday volatility? The S&P 500 futures contract trades within an intraday consolidation following an overnight move down after North Korea's missile launch news release. The nearest important resistance level is at 2,495-2,500, marked by record high. On the other hand, level of support is at 2,480-2,485, marked by short-term consolidation. The next support level is at 2,465-2,470, among others. The futures contract continues to fluctuate along its new record high, as the 15-minute chart shows:
Nasdaq Relatively Weaker
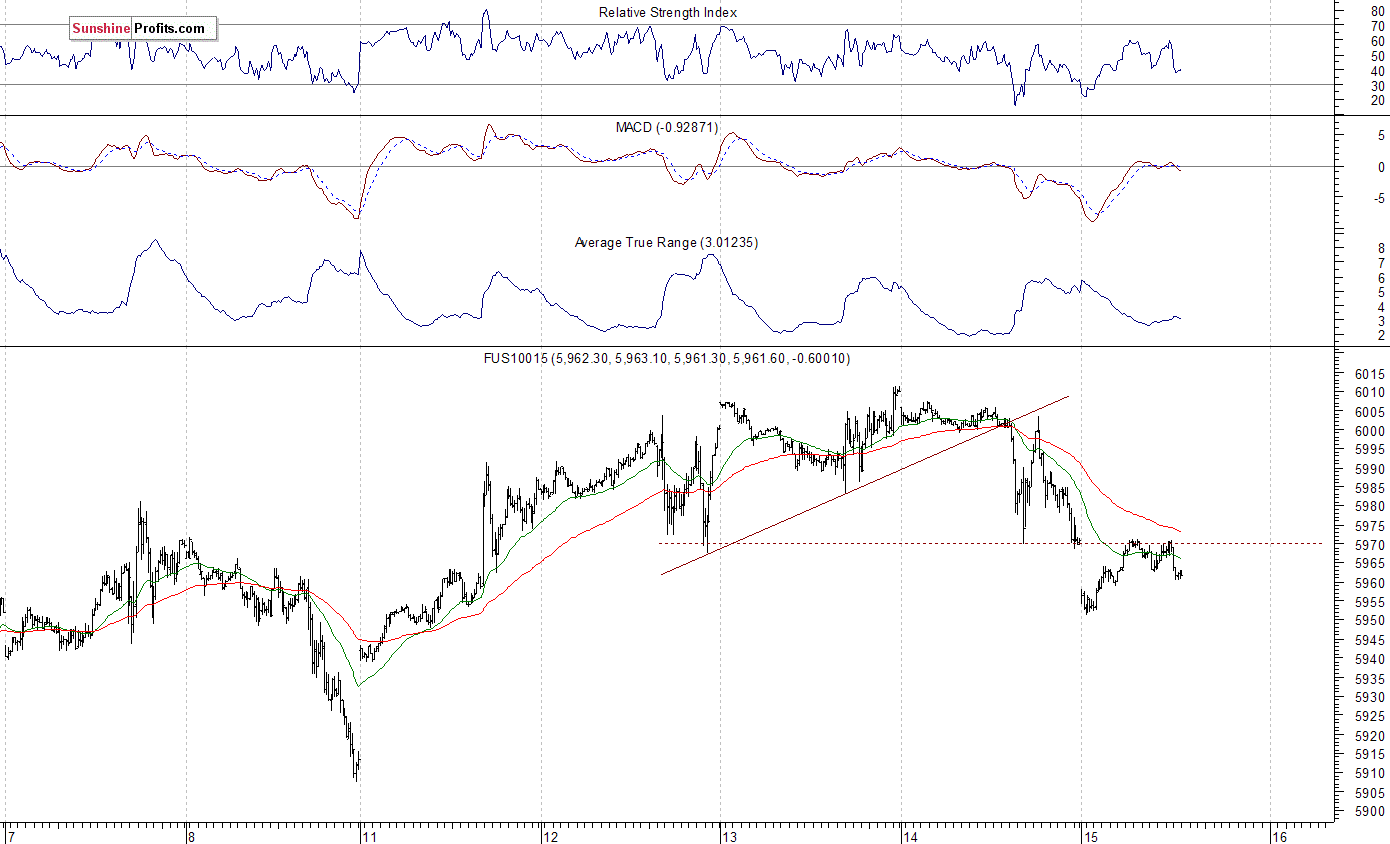
The technology Nasdaq 100 futures contract follows a similar path, as it trades within an intraday consolidation after an overnight move down. It is relatively weaker than the broad stock market after bouncing off resistance level at 6,000-6,020, marked by record high. The nearest important level of support is at 5,950, marked by short-term local low. The next level of support remains at 5,920-5,940, marked by Monday's daily gap up. The Nasdaq futures contract trades below the resistance level of 5,970, as we can see on the 15-minute chart:
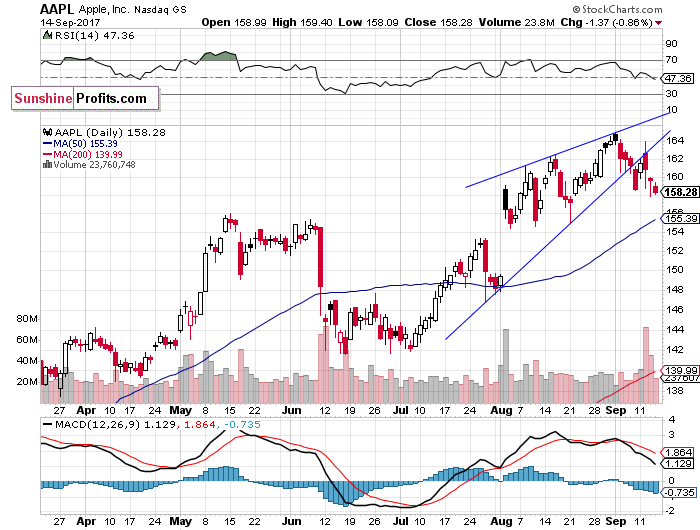
Let's take a look at Apple, Inc. stock (AAPL) daily chart (chart courtesy of http://stockcharts.com). It remains below previously broken upward trend line or a rising wedge pattern. The Apple stock has weighting of around 4.0% in the S&P 500 index. We still can see some relative weakness vs. the broad stock market index here:
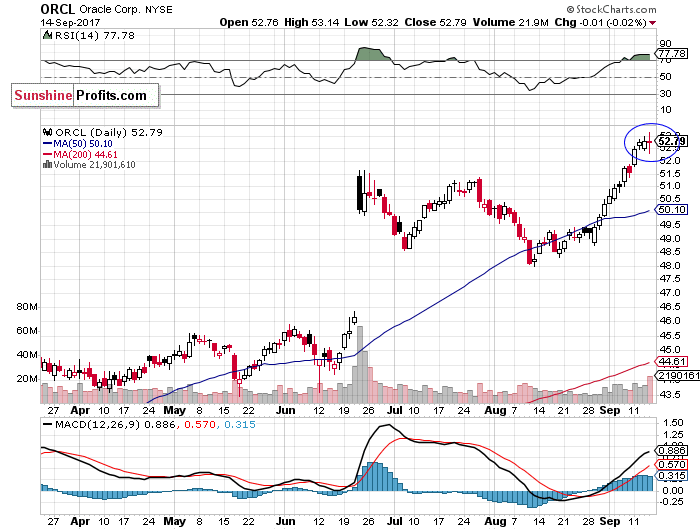
Now, let's take a look at Oracle Corp. stock (ORCL) daily chart (chart courtesy of http://stockcharts.com). The company released its quarterly earnings report yesterday after trading session. The numbers topped market expectations, but the outlook was disappointing and the stock will likely open much lower today - pre-market quotations indicate a drop of 4%. The Oracle stock has weighting of around 0.7% in the S&P 500 index. We can see some some potential topping pattern:
Concluding, the S&P 500 index reached new record high yesterday, as it got slightly above Wednesday's daily high. The market trades close to 2,500 mark. Will it break higher and continue its long-term uptrend? There have been no confirmed short-term negative signals so far. However, we still can see some medium-term overbought conditions along with negative technical divergences. The S&P 500 index gained around 4.1% since reaching its March 1 local local high of 2,400.98 (over six months ago). Will this uptrend accelerate or reverse?
Therefore, we continue to maintain our medium-term short position (opened at 2,437.83 on June 5 - opening price of the S&P 500 index). Stop-loss level is at 2,510 and potential profit target is at 2,300 (S&P 500 index). One can trade S&P 500 index using futures contracts (S&P 500 futures contract - SP, E-mini S&P 500 futures contract - ES) or an ETF like the SPDR S&P 500 ETF - SPY. It is always important to set some exit price level in case some events cause the price to move in the unlikely direction. Having safety measures in place helps limit potential losses while letting the gains grow.
To summarize: medium-term short position in S&P 500 index is justified from the risk/reward perspective with the following entry prices, stop-loss orders and profit target price levels:
Intraday trade:
No intraday position is justified from the risk/reward perspective today.
Medium-term trade:
S&P 500 index - short position: profit target level: 2,300; stop-loss level: 2,510
S&P 500 futures contract (December) - short position: profit target level: 2,297; stop-loss level: 2,507
SPY ETF (SPDR S&P 500, not leveraged) - short position: profit target level: $230; stop-loss level: $251
SDS ETF (ProShares UltraShort S&P500, leveraged: -2x) - long position: opening price: $12.56; profit target level: $13.98; stop-loss level: $11.82
Thank you.
Paul Rejczak
Stock Trading Strategist
Stock Trading Alerts

