

Trading position (short-term, our opinion; levels for S&P 500 continuous futures contract): No positions are currently justified from the risk/reward point of view.
Stocks extended their decline on Friday and the S&P 500 index retraced the whole of its Wednesday’s Fed rally. Is this a new downtrend?
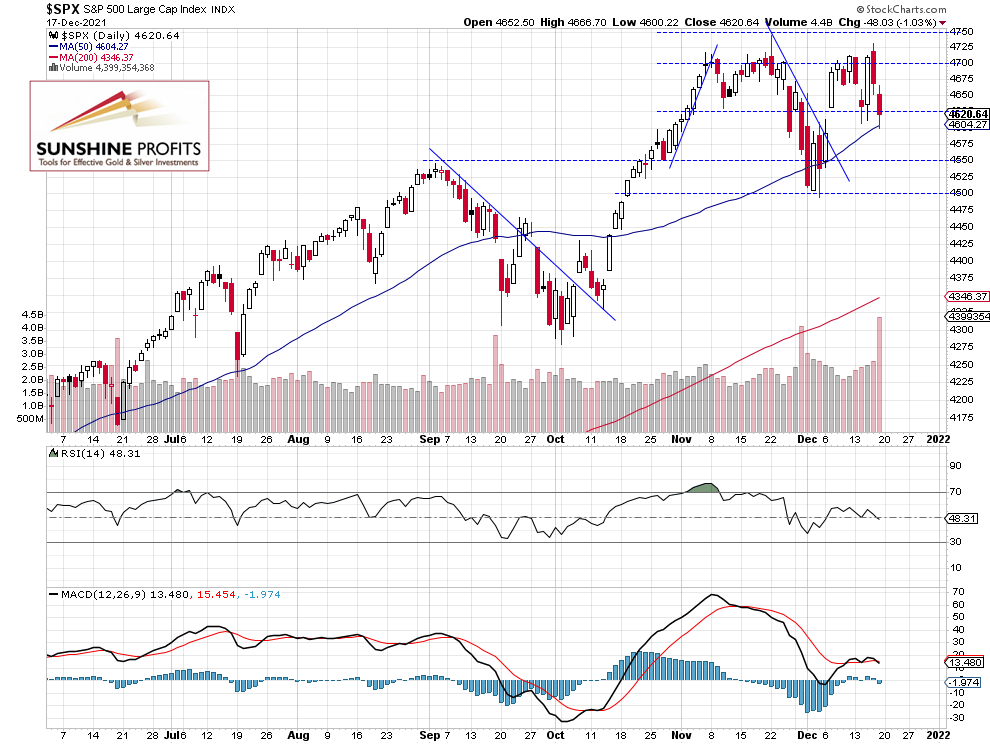
The S&P 500 index lost 1.03% on Friday and it got back below the Wednesday’s daily low. It retraced the whole post-FOMC Wednesday’s advance. On Dec. 3 the index fell to the local low of 4,495.12 and it was 5.24% below the Nov. 22 record high of 4,743.83. Then we saw another attempt at getting back to the all-time high and a week ago on Friday the index closed the highest in history. Then we’ve witnessed another attempt at breaking higher, but since last Thursday the market has been declining again. Today the index is expected to open 1.2% lower but we may see an intraday upward correction at some point
The nearest important resistance level is now at around 4,620-4,630. On the other hand, the support level is at 4,500-4,550, marked by the early December local lows. The S&P 500 continues to trade within a consolidation, as we can see on the daily chart (chart by courtesy of http://stockcharts.com):
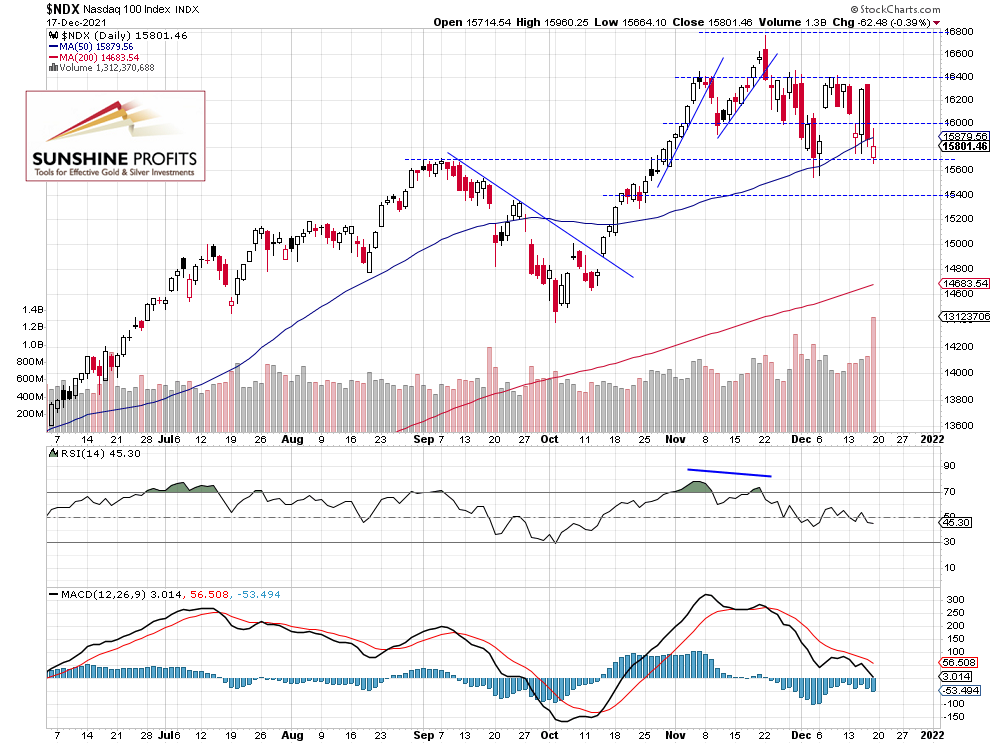
Nasdaq 100 Is Below 16,000 Again
Let’s take a look at the Nasdaq 100 chart. The technology index bounced from the resistance level of 16,400 once again last week. Tech stocks remain relatively weaker, as the Nasdaq 100 is closer to the early December local lows than the broad stock market’s gauge.
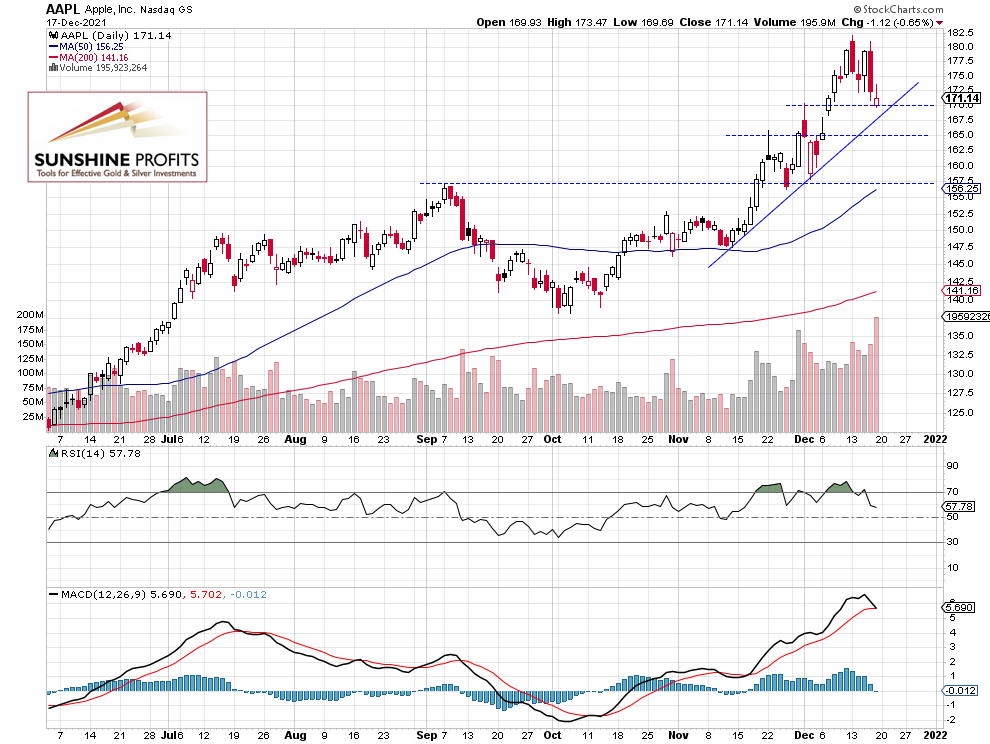
Apple’s Downward Correction
The recent broad stock market’s rally was driven by a handful of mega-cap stocks. Apple was the main driver of that rally, as it reached the new record high of $182.13 (and the market cap of over $2.9 trillion) on Dec. 13. The stock is trading within a downward correction now, and it’s getting closer to an over month-long upward trend line. The support level is at $165-170.
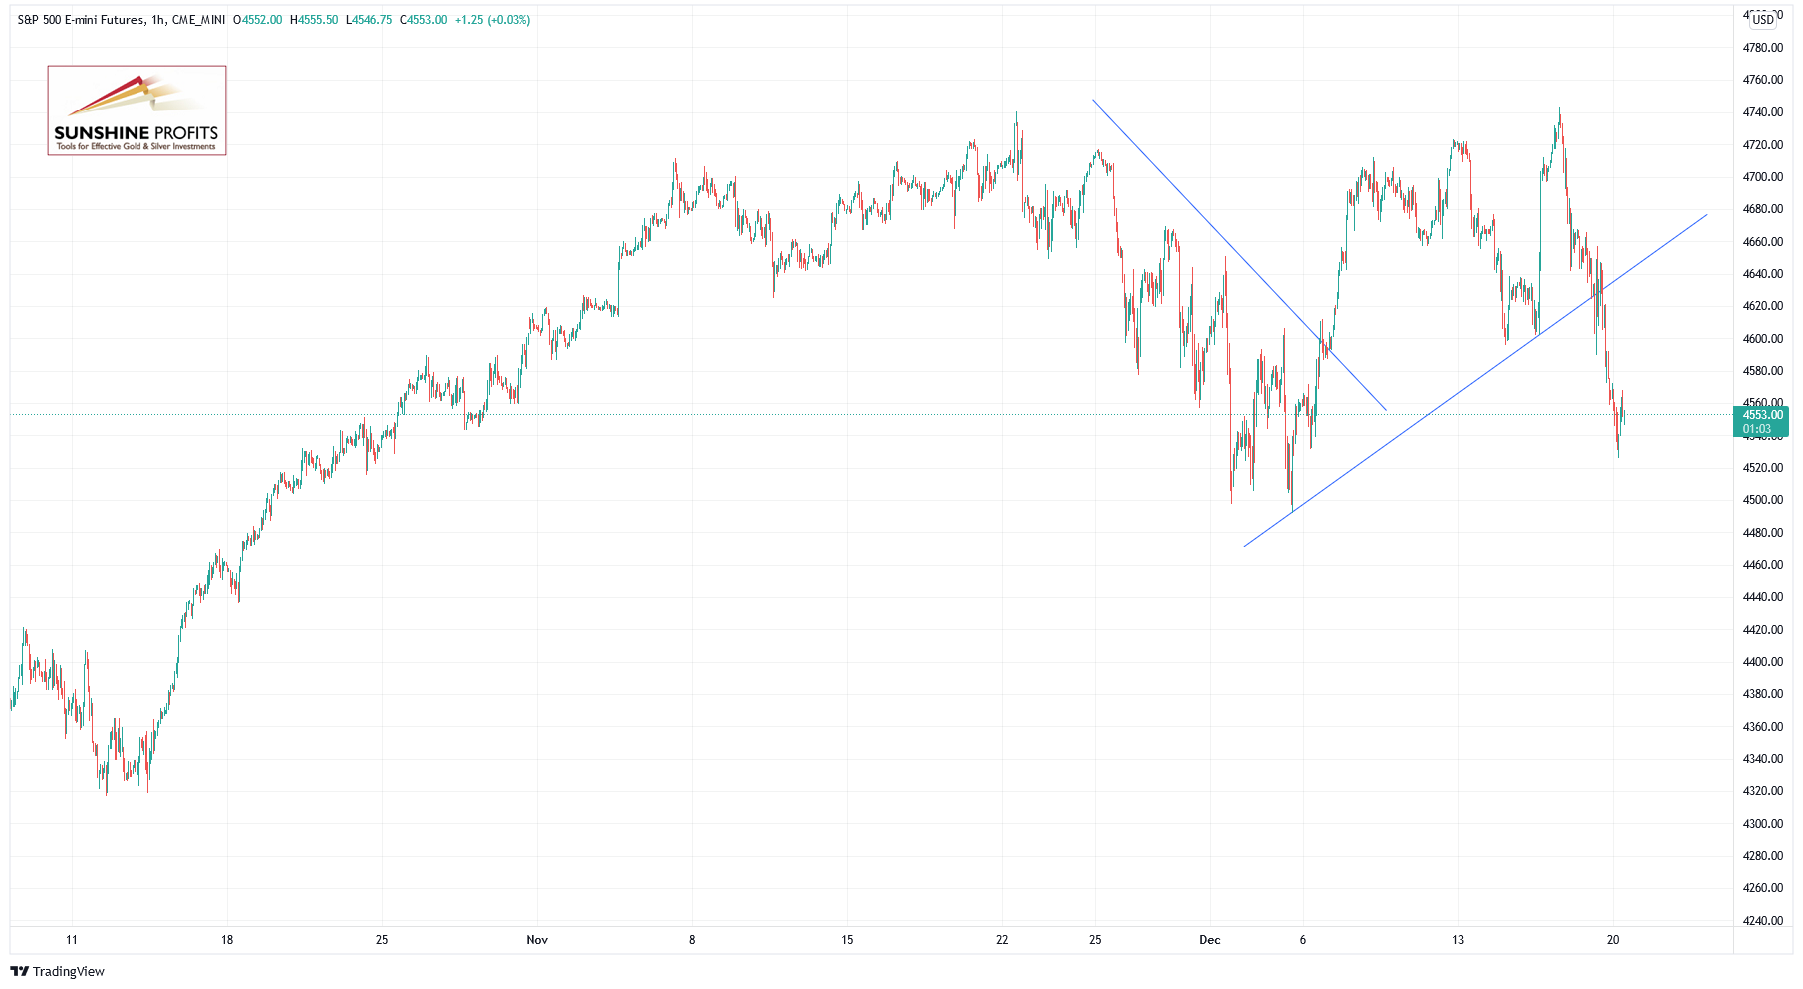
Futures Contract is Also Close to the Previous Low
Let’s take a look at the hourly chart of the S&P 500 futures contract. It reached the new record high on Thursday, Dec. 16., before reversing its uptrend and getting back to the early Dec. lows. For now, it looks like a further consolidation and the market keeps extending its sideways trading action.
Our short position was closed at the stop-loss level of 4,720. In our opinion no positions are currently justified from the risk/reward point of view. (chart by courtesy of http://tradingview.com):
Conclusion
The S&P 500 index is expected to open much lower this morning following an overnight global markets’ sell-off. We will likely see an intraday consolidation and attempts at retracing some of the decline from Thursday’s local high.
Here’s the breakdown:
- The S&P 500 is expected to open lower but we may see a consolidation or an intraday upward correction at some point.
- In our opinion no positions are currently justified from the risk/reward point of view.
As always, we’ll keep you, our subscribers, well-informed.
Trading position (short-term, our opinion; levels for S&P 500 continuous futures contract): No positions are currently justified from the risk/reward point of view.
Thank you.
Paul Rejczak,
Stock Trading Strategist
Sunshine Profits: Effective Investments through Diligence and Care

