

Trading position (short-term, our opinion; levels for S&P 500 continuous futures contract): short positions with an entry at 4,435 price level, with a stop-loss level of 4,550 and 4,200 as a price target.
The S&P 500 index seems to be unstoppable. Will it accelerate its already quite rapid uptrend after today’s NFP release?
The broad stock market index gained 0.28% on Thursday (Sep. 2), as it slightly extended its long-term uptrend. The index reached yet another new record high of 4,545.85. The market remains elevated following the recent run-up, so we may see some more profound profit-taking action at some point.
The nearest important support level of the broad stock market index remains at 4,500, and the next support level is at 4,465-4,470, marked by last Thursday’s low. On the other hand, the nearest important resistance level is at 4,550. The S&P 500 bounced from its four-month-long upward trend line recently, as we can see on the daily chart (chart by courtesy of http://stockcharts.com):
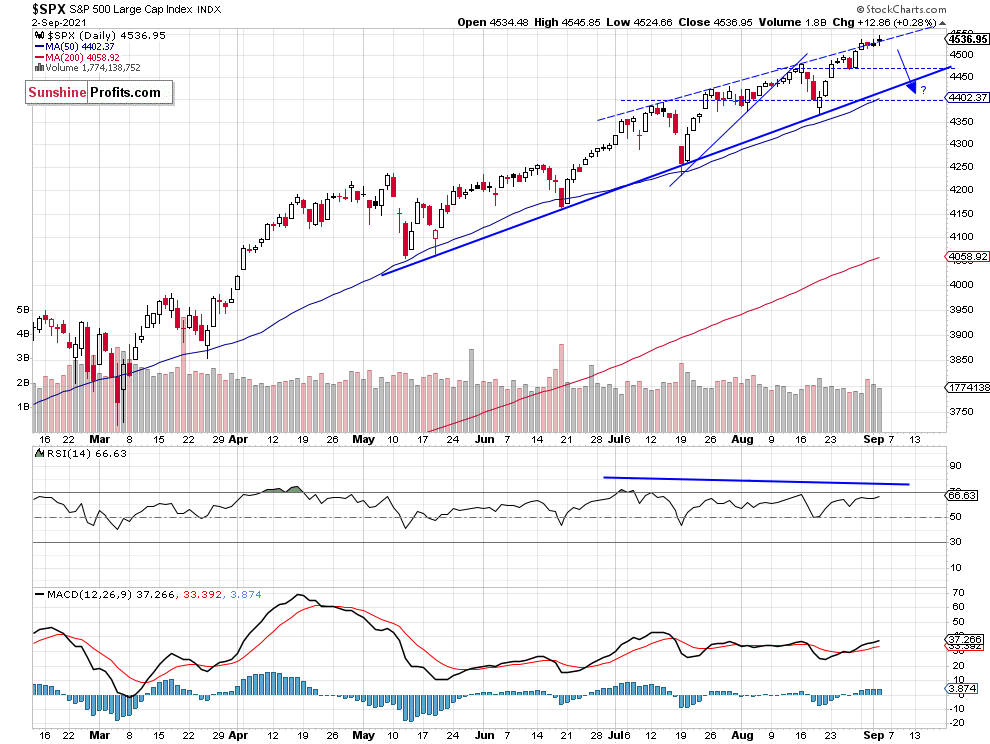
S&P 500 Continues to Climb Along the Trend Line
The S&P 500 index remains close to its almost year-long upward trend line. The nearest important medium-term support level remains at 4,300, as we can see on the weekly chart:

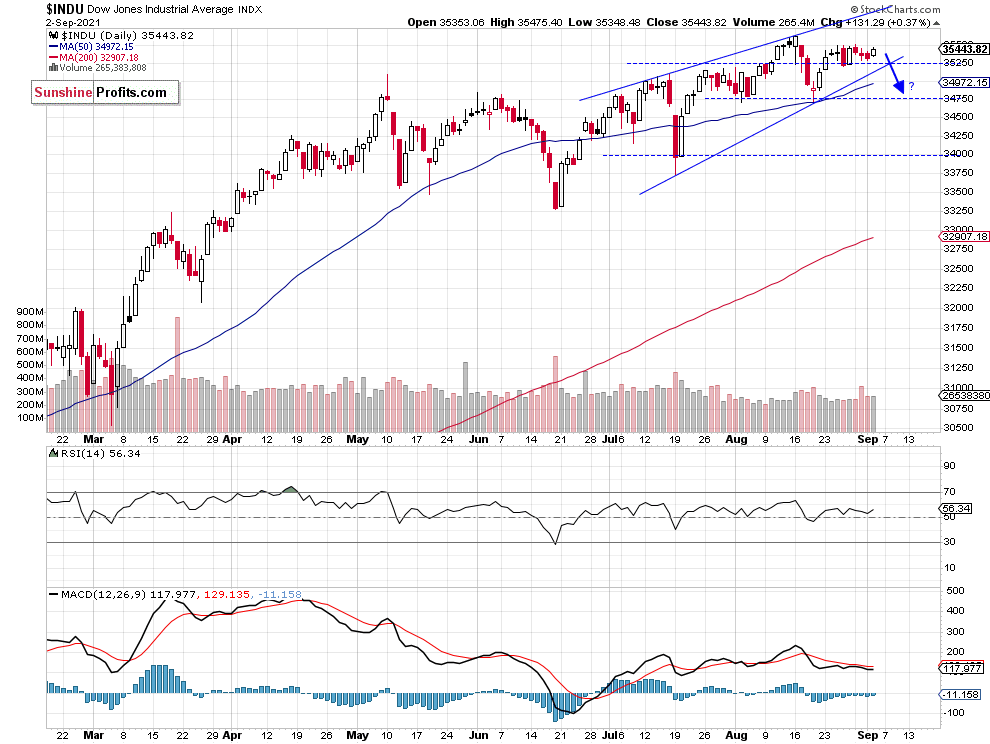
Dow Jones Still Going Sideways
Let’s take a look at the Dow Jones Industrial Average chart. The blue-chip index is still trading within a potential two-month-long rising wedge downward reversal pattern. It remains relatively weaker, as it didn’t reach a new record high like the S&P 500 and the Nasdaq. The support level remains at around 35,000, as we can see on the daily chart:
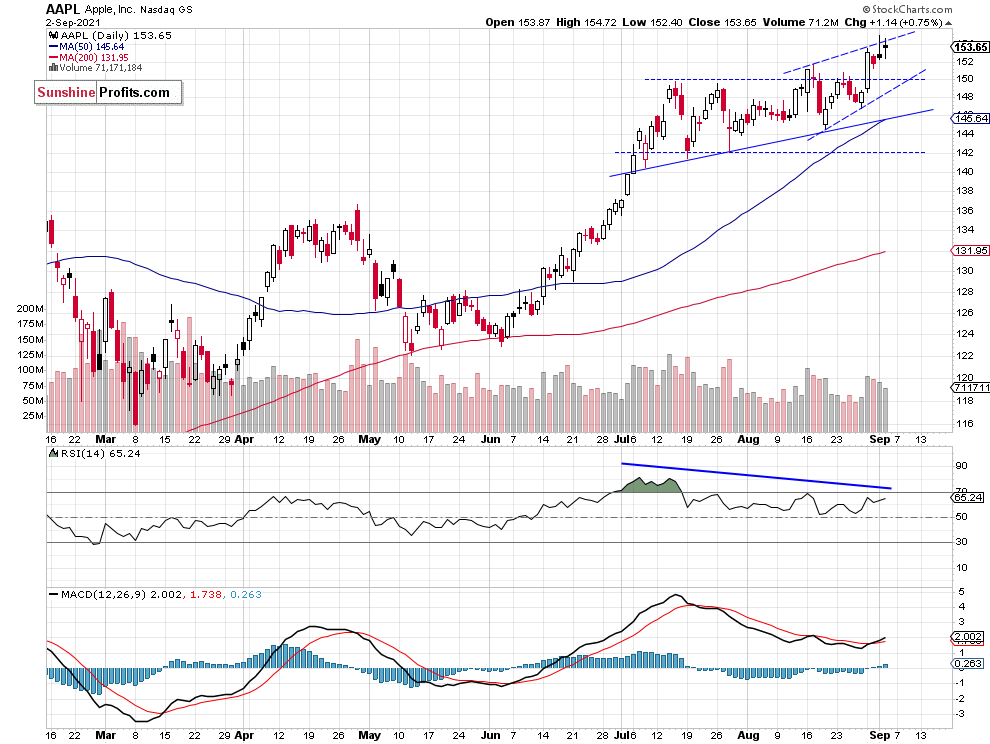
Apple May Be Finally Topping
Apple stock weighs around 6.3% in the S&P 500 index, so it is important for the whole broad stock market picture. It broke above the previous high of around $151.7 this week. That move has driven the whole stock market higher. However, we can still see negative technical divergences between the price and indicators and a potential two-week-long bearish rising wedge pattern.
Overall, it looks like a medium-term topping pattern. The two-month-long upward trend line remains at around $145, and the nearest important support level is now at $150.
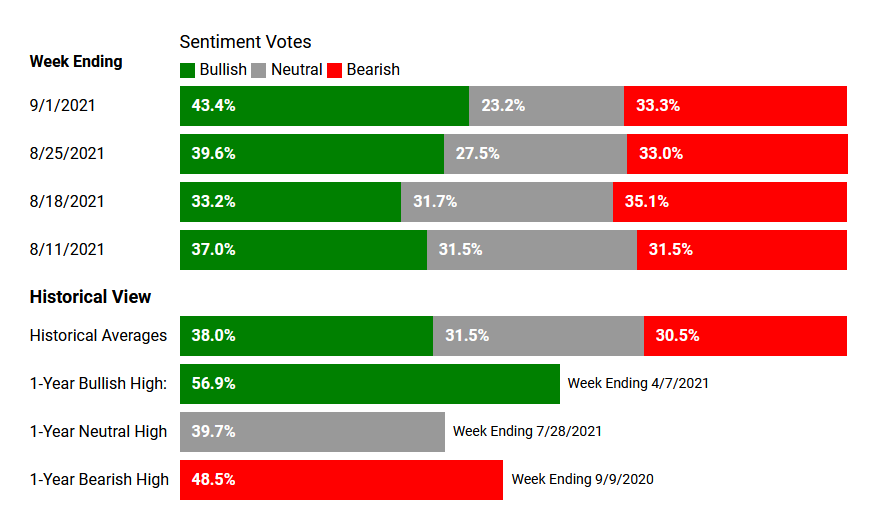
Jump in AAII’s Bullish Sentiment!
One more thing. On Wednesday we got the latest reading of the American Association of Individual Investors’ Sentiment Survey. There was a big jump in bullish sentiment last week and an accompanying drop of neutral votes. So, individual investors are very bullish right now - that may be a sign of a topping action of the stock market. (chart by courtesy of http://www.aaii.com)
Our Short Position
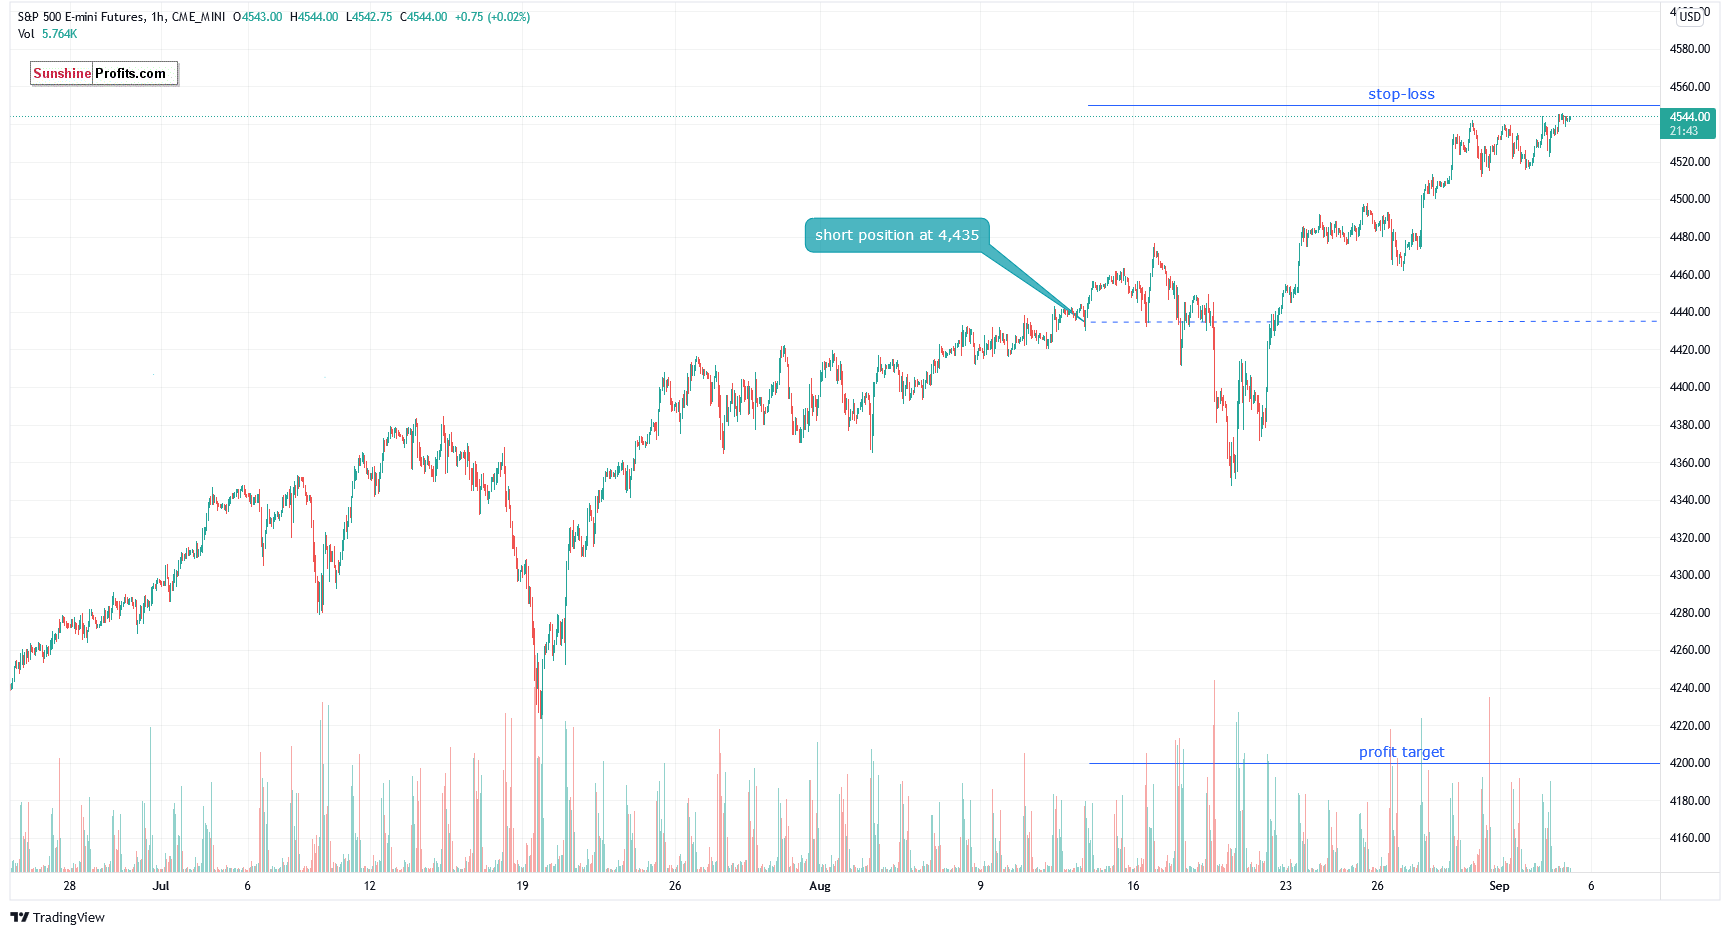
Let’s take a look at the hourly chart of the S&P 500 futures contract. We opened a short position on August 12 at the level of 4,435. The position was profitable before the recent run-up. We still think that a speculative short position is justified from the risk/reward perspective. (chart by courtesy of http://tradingview.com):
Conclusion
The S&P 500 index reached a new record high yesterday, as it gained 0.3%. Investors are waiting for today’s monthly jobs data release. Wednesday’s ADP Non-Farm Employment Change number came in worse than expected, but the Non-Farm Payrolls will lift the market’s volatility again.
The market seems short-term overbought, and we may see some profit-taking action soon. Therefore, we think that the short position is justified from the risk/reward perspective.
Here’s the breakdown:
- The market extended its advance this week, as the S&P 500 index broke above the 4,500 level.
- Our speculative short position is still justified from the risk/reward perspective.
- We are expecting a 5% or bigger correction from the new record high.
As always, we’ll keep you, our subscribers, well-informed.
Trading position (short-term, our opinion; levels for S&P 500 continuous futures contract): short positions with an entry at 4,435 price level, with a stop-loss level of 4,550 and 4,200 as a price target.
Thank you.
Paul Rejczak,
Stock Trading Strategist
Sunshine Profits: Effective Investments through Diligence and Care

