

Trading position (short-term, our opinion; levels for S&P 500 continuous futures contract): short positions with an entry at 4,435 price level, with a stop-loss level of 4,550 and 4,200 as a price target.
The S&P 500 index was little changed on Tuesday, as it remained relatively close to Monday’s record high. So, is this still a topping pattern?
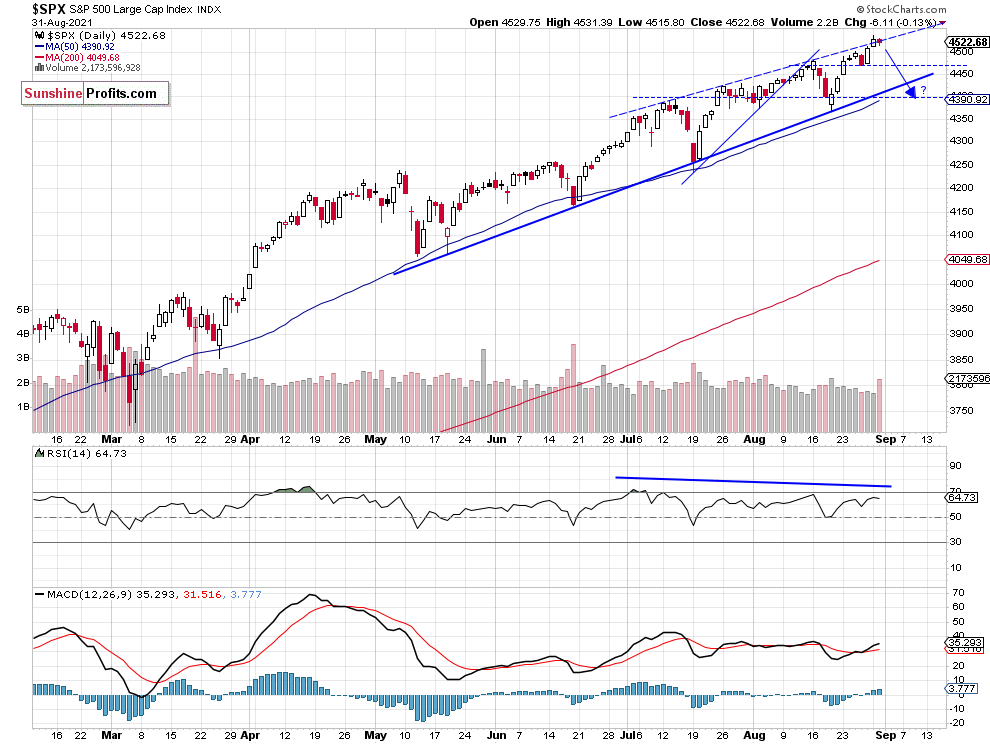
The broad stock market index lost 0.13% on Tuesday (Aug. 31) as it fluctuated within a short-term consolidation. The S&P 500 further extended its short-term uptrend after some dovish remarks from Fed Chair Powell at the Jackson Hole Symposium on Friday (Aug. 27). The index reached yet another new record high of 4,537.36 on Monday. The market remains elevated following the recent run-up, so we may see some more profound profit-taking action at some point.
The nearest important support level of the broad stock market index is now at 4,500, and the next support level is at 4,465-4,470, marked by last Thursday’s low. On the other hand, the nearest important resistance level is at 4,550. The S&P 500 bounced from its four-month-long upward trend line recently, as we can see on the daily chart (chart by courtesy of http://stockcharts.com):
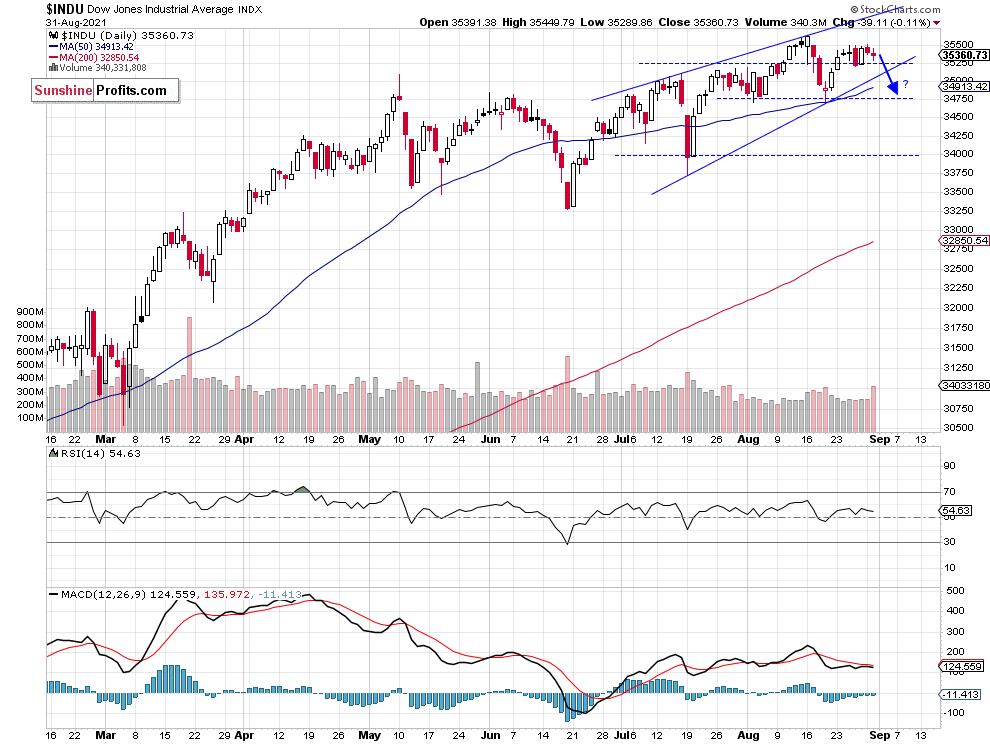
Dow Jones is Trading Sideways
Let’s take a look at the Dow Jones Industrial Average chart. The blue-chip index is trading within a potential two-month-long rising wedge downward reversal pattern. It remains relatively weaker, as it didn’t reach a new record high like the S&P 500 and the Nasdaq. The support level remains at around 35,000, as we can see on the daily chart:
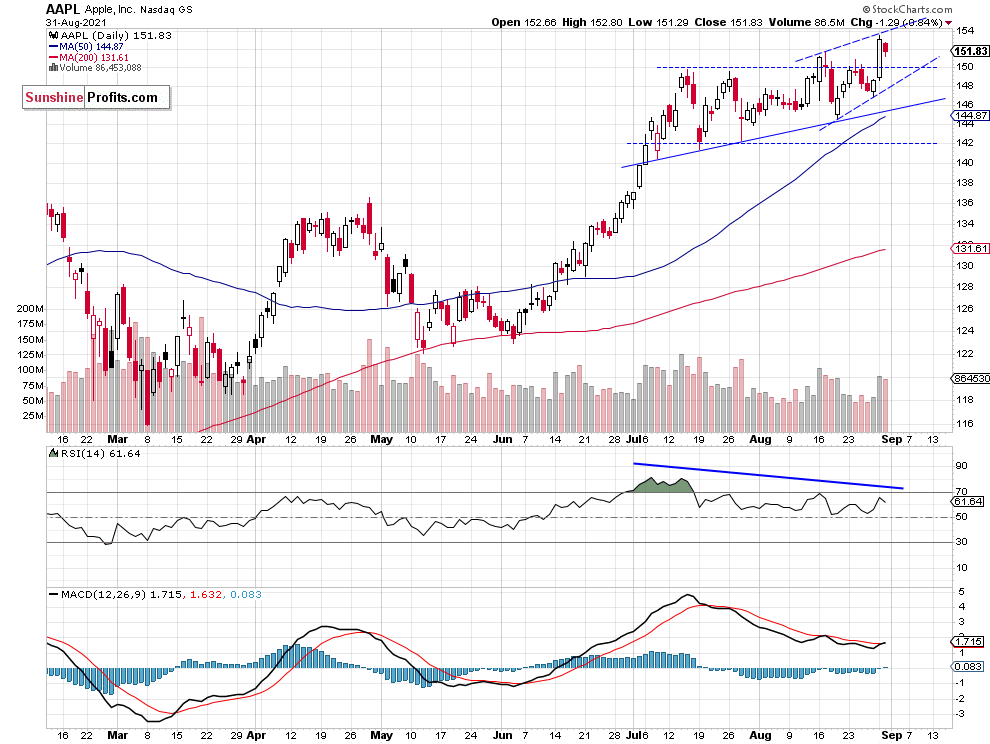
Apple’s Breakout – Where Will That $2.5 Trillion Stock Go?
Apple stock weighs around 6.3% in the S&P 500 index, so it is important for the whole broad stock market picture. It broke above the previous high of around $151.7 on Monday. That move has driven the whole stock market higher. But we can still see negative technical divergences between the price and indicators and a potential two-week-long bearish rising wedge pattern.
Overall, it looks like a medium-term topping pattern. The two-month-long upward trend line remains at around $145, and the nearest important support level is now at $150.
Short Position Still Justified
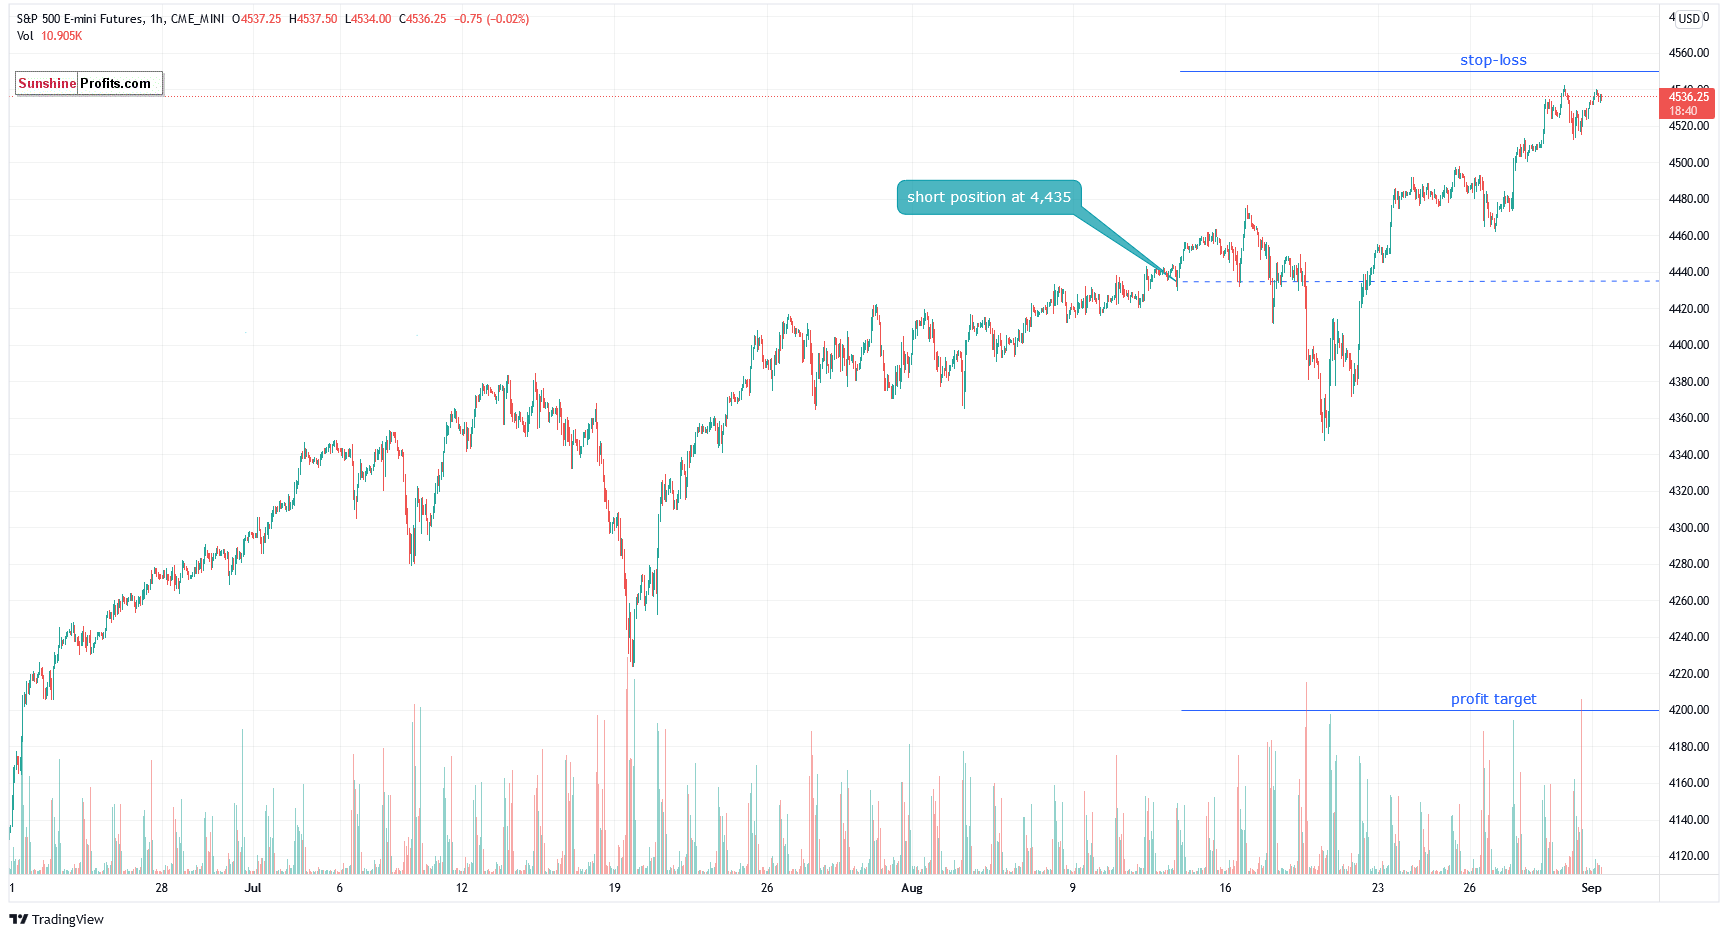
Let’s take a look at the hourly chart of the S&P 500 futures contract. We opened a short position on August 12 at the level of 4,435. The position was profitable before the recent run-up. We still think that a speculative short position is justified from the risk/reward perspective. (chart by courtesy of http://tradingview.com):
Conclusion
The S&P 500 index reached a new record high on Monday, but yesterday it remained within a relatively narrow daily trading range. The market seems short-term overbought, and we may see some profit-taking action soon. Therefore, we think that the short position is justified from the risk/reward perspective.
Here’s the breakdown:
- The market extended its advance on Monday, as the S&P 500 index broke above 4,500 level.
- Our speculative short position is still justified from the risk/reward perspective.
- We are expecting a 5% or bigger correction from the new record high.
As always, we’ll keep you, our subscribers, well-informed.
Trading position (short-term, our opinion; levels for S&P 500 continuous futures contract): short positions with an entry at 4,435 price level, with a stop-loss level of 4,550 and 4,200 as a price target.
Thank you.
Paul Rejczak,
Stock Trading Strategist
Sunshine Profits: Effective Investments through Diligence and Care

