

Briefly:
Intraday trade: The S&P 500 gained 0.9% on Thursday, after opening 0.1% higher. The market will probably open lower today. We may see a consolidation along the medium-term resistance level of around 2,700.
Trading position (short-term; our opinion): no positions are justified from the risk/reward perspective.
Our short-term outlook is neutral, and our medium-term outlook is neutral:
Short-term outlook (next 1-2 weeks): neutral
Medium-term outlook (next 1-3 months): neutral
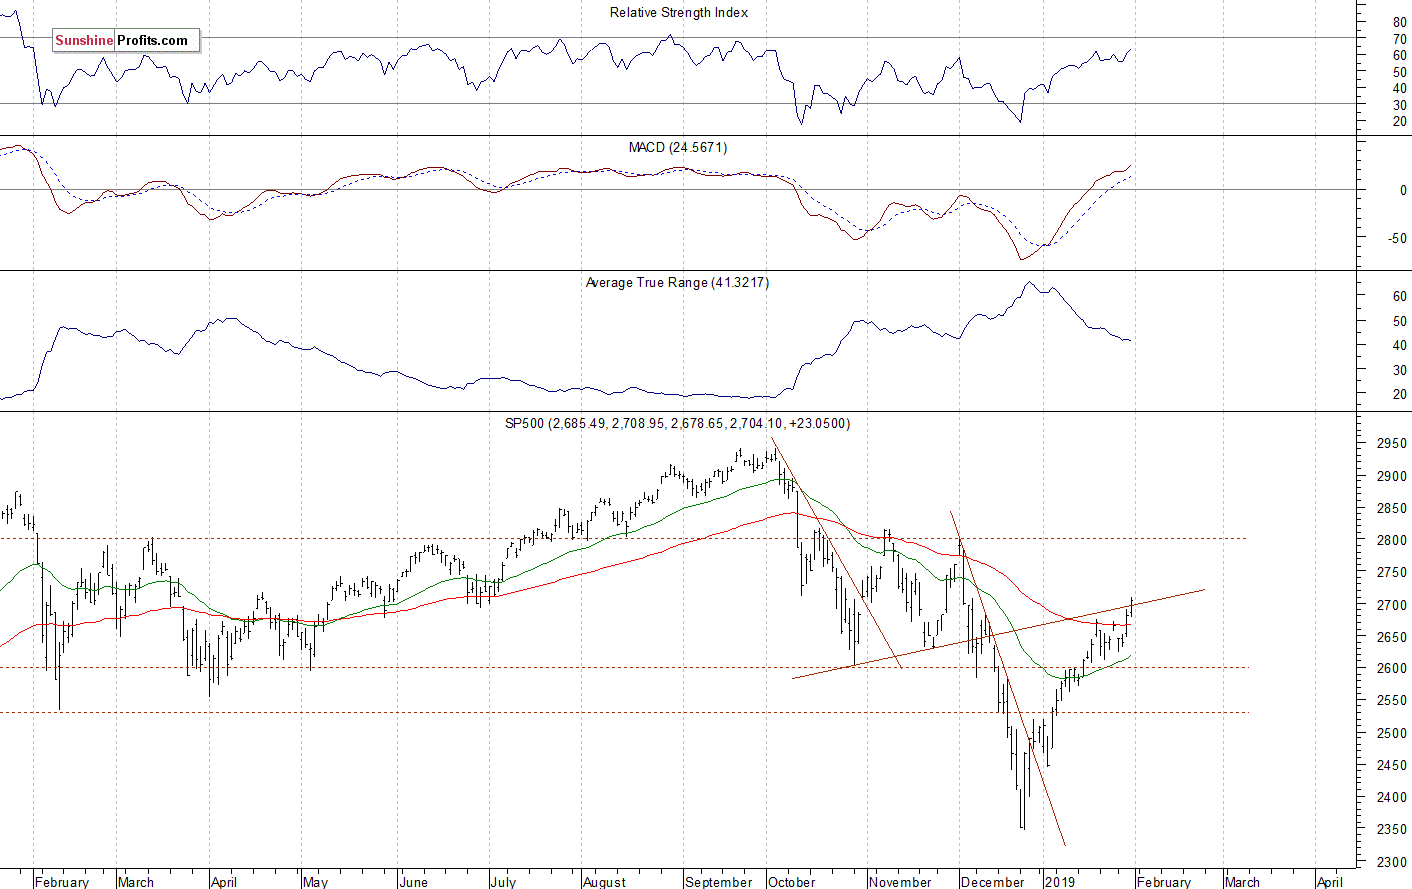
The U.S. stock market indexes were mixed between -0.1% and +1.4% on Thursday, as investors hesitated following the recent advance, economic data, quarterly earnings releases. The S&P 500 index broke above its short-term consolidation on Wednesday and it continued higher yesterday. The market is now close to the 61.8% Fibonacci retracement of its October-December downward correction of 20.2% (2,713.88). It has gained more than 360 points from the late December medium-term low, but it is still around 240 points below the September 21st record high of 2,940.91. The Dow Jones Industrial Average lost 0.1% and the Nasdaq Composite gained 1.4% yesterday.
The nearest important resistance level of the S&P 500 index is at 2,710-2,720, marked by the mentioned 61.8% Fibonacci retracement and yesterday's daily high. The resistance level is also at 2,750-2,760. On the other hand, the support level is at 2,650, marked by the recent fluctuations. The support level is also at 2,615-2,625, marked by the short-term local lows.
The broad stock market broke below its two-month-long trading range in the mid-December, as the S&P 500 index fell below the level of 2,600. Then the market accelerated lower and it broke below the 2,400 mark. Since then, the market has retraced more than 50% of the whole decline off the September high. The index trades at a possible resistance level of its previously broken upward trend line, as we can see on the daily chart:
Uncertainty Ahead of Economic Data Releases
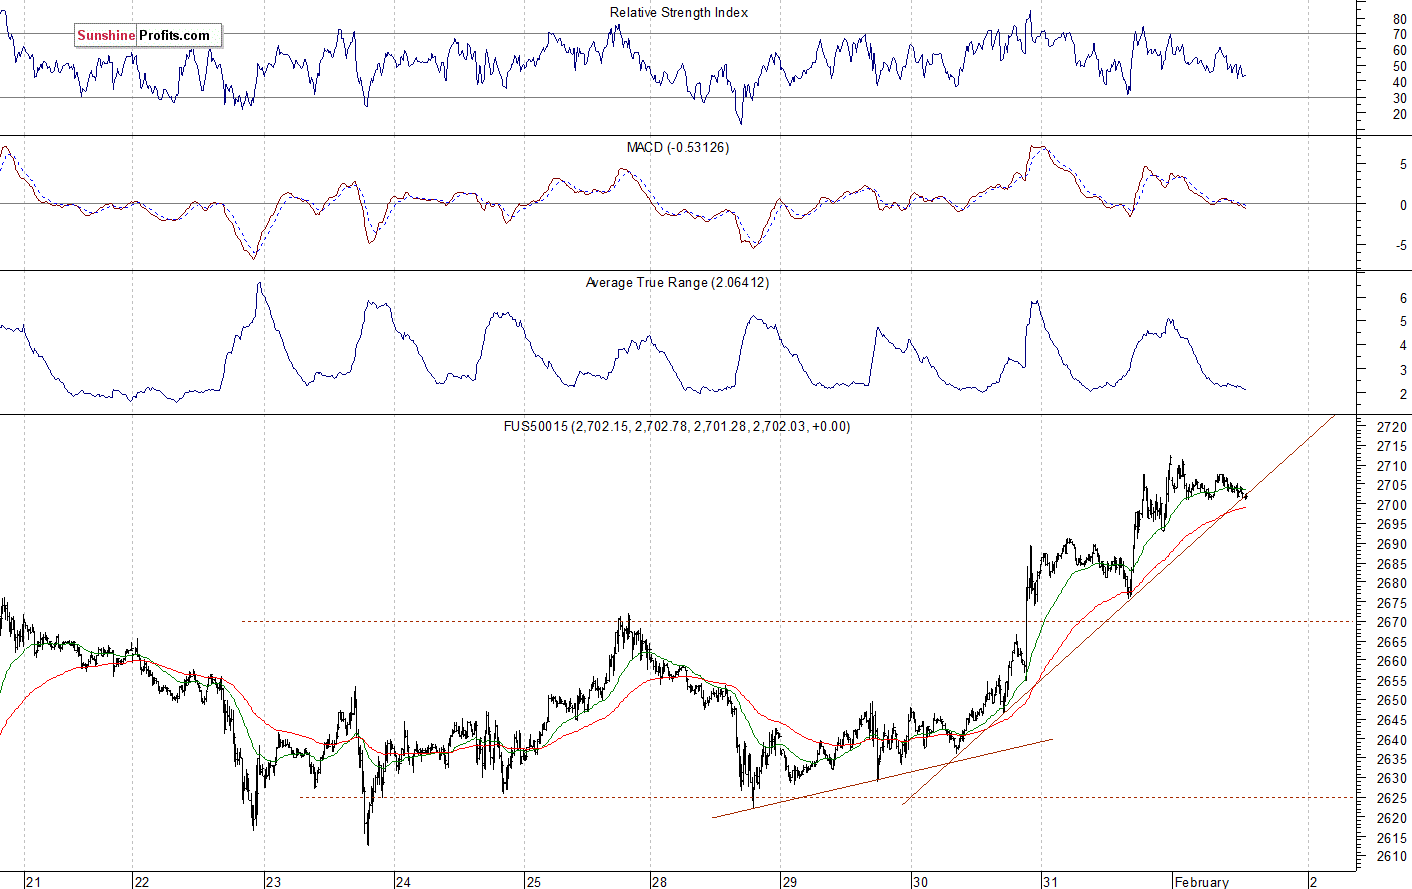
The index futures contracts trade 0.1-0.5% below their yesterday's closing prices. So expectations before the opening of today's trading session are negative. The European stock market indexes have been mixed so far. Investors will wait for series of important economic data announcements today: Non-Farm Payrolls number, Unemployment Rate at 8:30 a.m., ISM Manufacturing PMI, Michigan Sentiment, Construction Spending, Wholesale Inventories at 10:00 a.m. The broad stock market will likely fluctuate along the mentioned resistance level following the recent rally. There have been no confirmed negative signals so far. However, we can see some short-term technical overbought conditions.
The S&P 500 futures contract trades within an intraday consolidation following yesterday's advance. The nearest important resistance level is at around 2,710. On the other hand, the support level is now at 2,675-2,690, among others. The futures contract remains slightly above the 2,700 mark this morning, as the 15-minute chart shows:
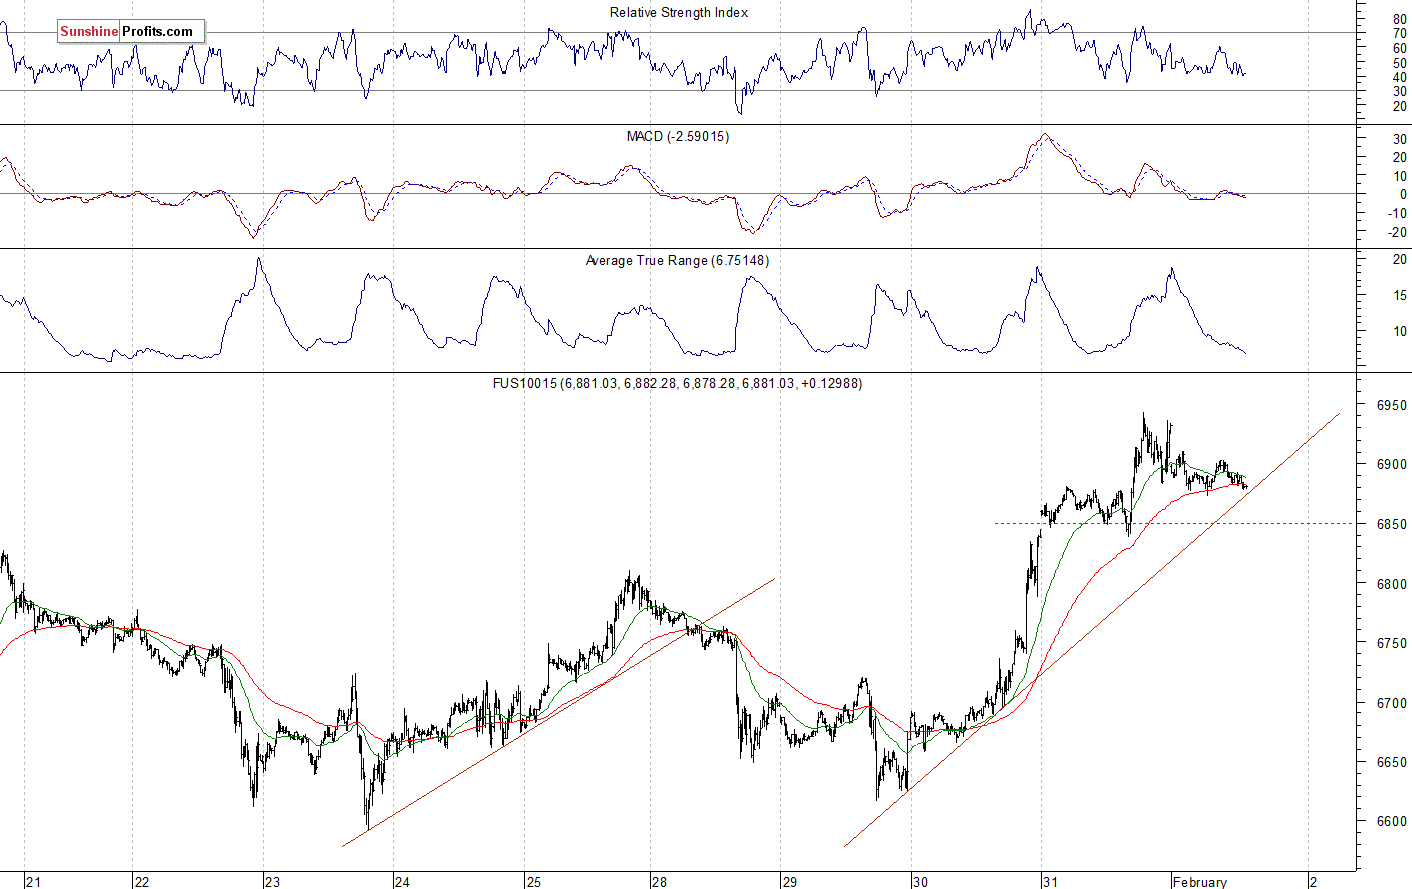
Nasdaq Also Going Sideways
The technology Nasdaq 100 futures contract follows a similar path, as it trades within an intraday consolidation after the recent advance. The market gained over 1,100 points from December the 26th local low of around 5,820 in the recent weeks. The nearest important resistance level is now at 6,950-7,000. The support level is at 6,800-6,850, marked by the recent consolidation. The Nasdaq futures contract is close to the short-term upward trend line, as we can see on the 15-minute chart:
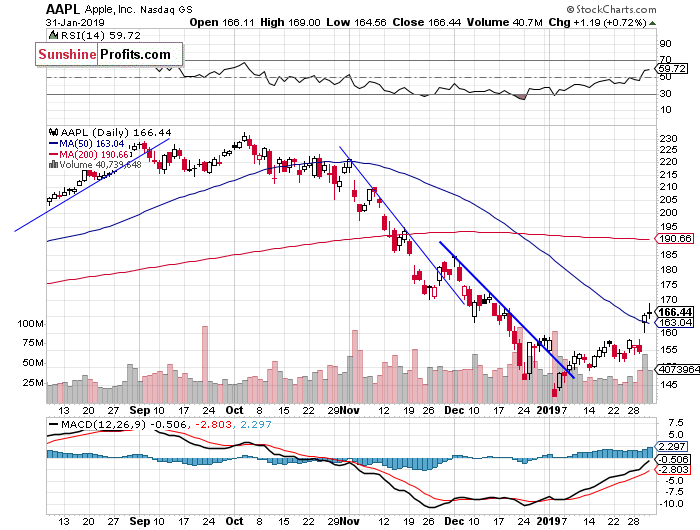
Big Cap Tech Stocks - More Bullish Picture
Let's take a look at the Apple, Inc. stock (AAPL) daily chart (chart courtesy of http://stockcharts.com). Apple released its quarterly earnings on Tuesday after the trading session's close. Then the stock broke above its recent trading range and the resistance level of $155-160. It retraced some more of its November-December sell-off. The next possible resistance level is at $170:
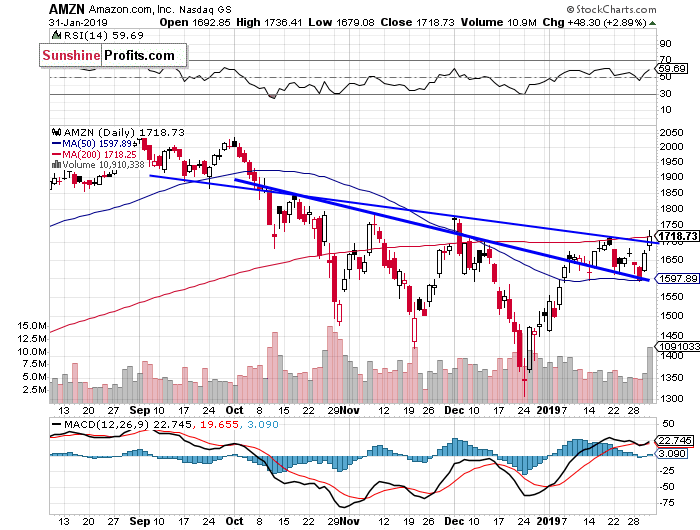
Now let's take a look at the daily chart of Amazon.com, Inc. (AMZN). The market broke above one of its three-month-long downward trend lines recently. Since then it goes sideways. There is a resistance level at around $1,700-1,750. And the market is taking an attempt breaking higher here:
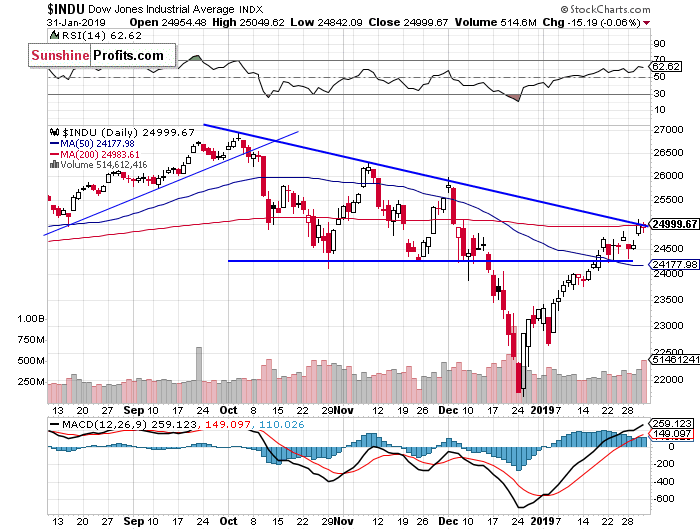
Dow Jones Remains at the Downward Trend Line
The Dow Jones Industrial Average extended its short-term uptrend on Wednesday and it got closer to the medium-term downward trend line. So will it continue higher and reach the record high again? Or reverse lower in the near term? There have been no confirmed negative signals so far. However, the resistance level remains at around 25,000:
The S&P 500 index broke above its short-term consolidation on Wednesday, as investors reacted to the Fed's Rate Decision release. Is this a new medium-term uptrend or still just upward correction before another medium-term leg lower? The market trades close to the 61.8% Fibonacci retracement of the whole medium-term decline. There have been no confirmed negative signals so far. But we can see some short-term technical overbought conditions.
Concluding, the S&P 500 index will likely open lower today. We may see some profit-taking action. However, the sentiment could change following the mentioned monthly jobs data release at 8:30 a.m.
Trading position (short-term; our opinion): no positions are justified from the risk/reward perspective.
Thank you.
Paul Rejczak
Stock Trading Strategist
Sunshine Profits - Effective Investments through Diligence and Care

