

Briefly:
Intraday trade: The S&P 500 index lost 0.2% on Wednesday, after opening 0.2% lower. The broad stock market will probably open lower today. We may see some more short-term fluctuations.
Trading position (short-term; our opinion): no positions are justified from the risk/reward perspective.
Our short-term outlook is neutral, and our medium-term outlook is neutral:
Short-term outlook (next 1-2 weeks): neutral
Medium-term outlook (next 1-3 months): neutral
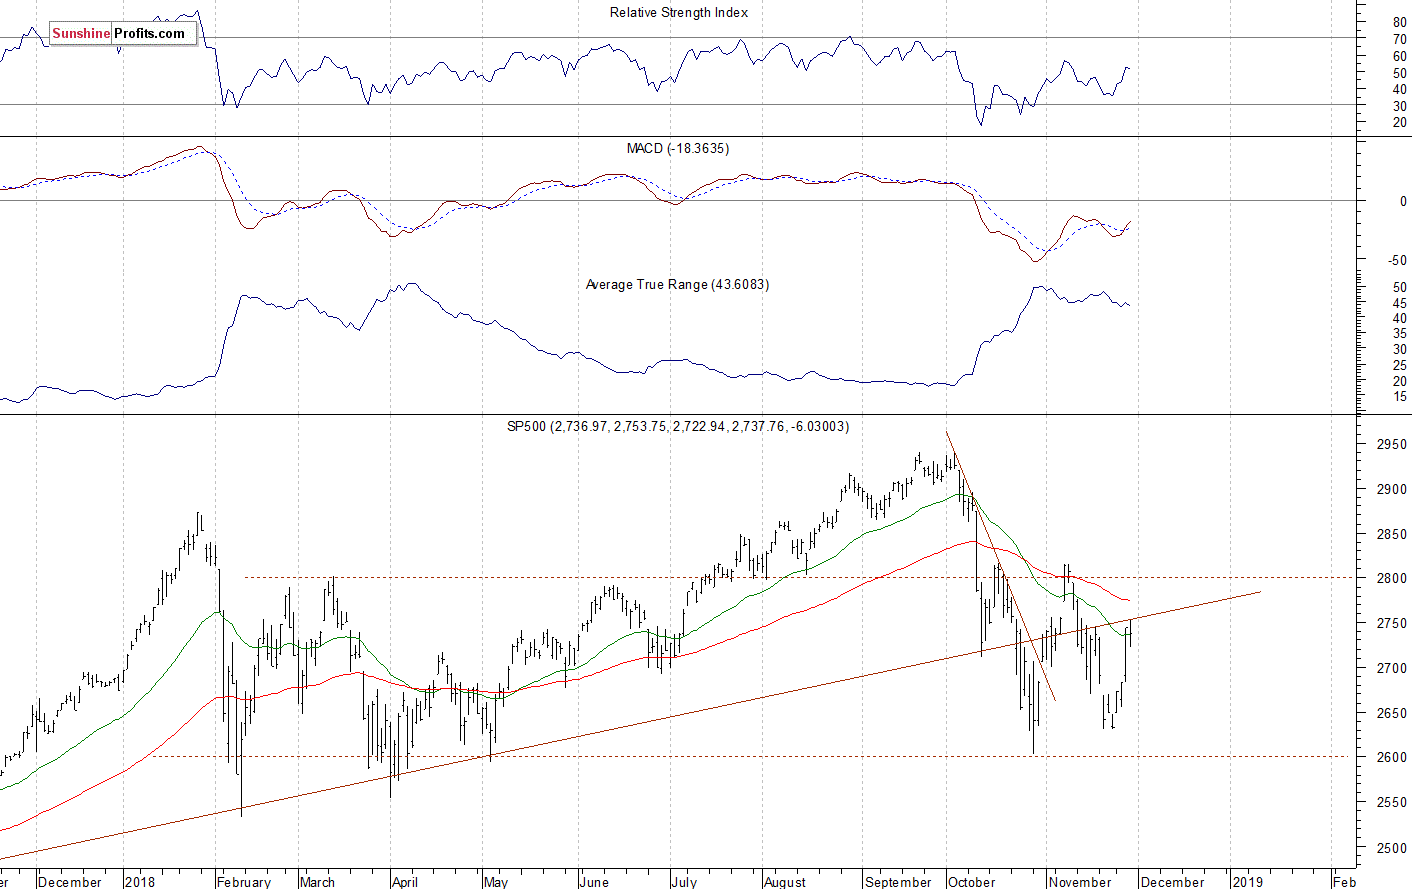
The U.S. stock market indexes lost 0.1-0.3% on Thursday, as investors hesitated following Wednesday's rally. The S&P 500 index continues to trade above the level of 2,700. It is currently 6.9% below September the 21st record high of 2,940.91. The Dow Jones Industrial Average lost 0.1% and the Nasdaq Composite lost 0.3% on Thursday.
The nearest important level of resistance of the S&P 500 index is at 2,750, marked by some previous local highs. The resistance level is also at 2,780-2,800, among others. On the other hand, the nearest important level of support is at around 2,720, marked by yesterday's low. The support level is also at 2,680-2,700, marked by the recent resistance level.
The broad stock market got closer to its late October low recently. The S&P 500 index traded more than 10% below the record high. It was a bottoming pattern before an upward reversal. The market is now at the long-term upward trend line again. So will the short-term uptrend continue? For now, it looks like a two-month-long consolidation following the October rout:
Short-Term Fluctuations
Expectations before the opening of today's trading session are negative again, because the index futures contracts trade 0.5-0.6% below their yesterday's closing prices. The European stock market indexes have lost 0.5-0.8% so far. Investors will wait for the Chicago PMI number release at 9:45 a.m. The broad stock market will likely extend its short-term fluctuations today. We can see some short-term overbought conditions. However, there have been no confirmed negative signals so far.
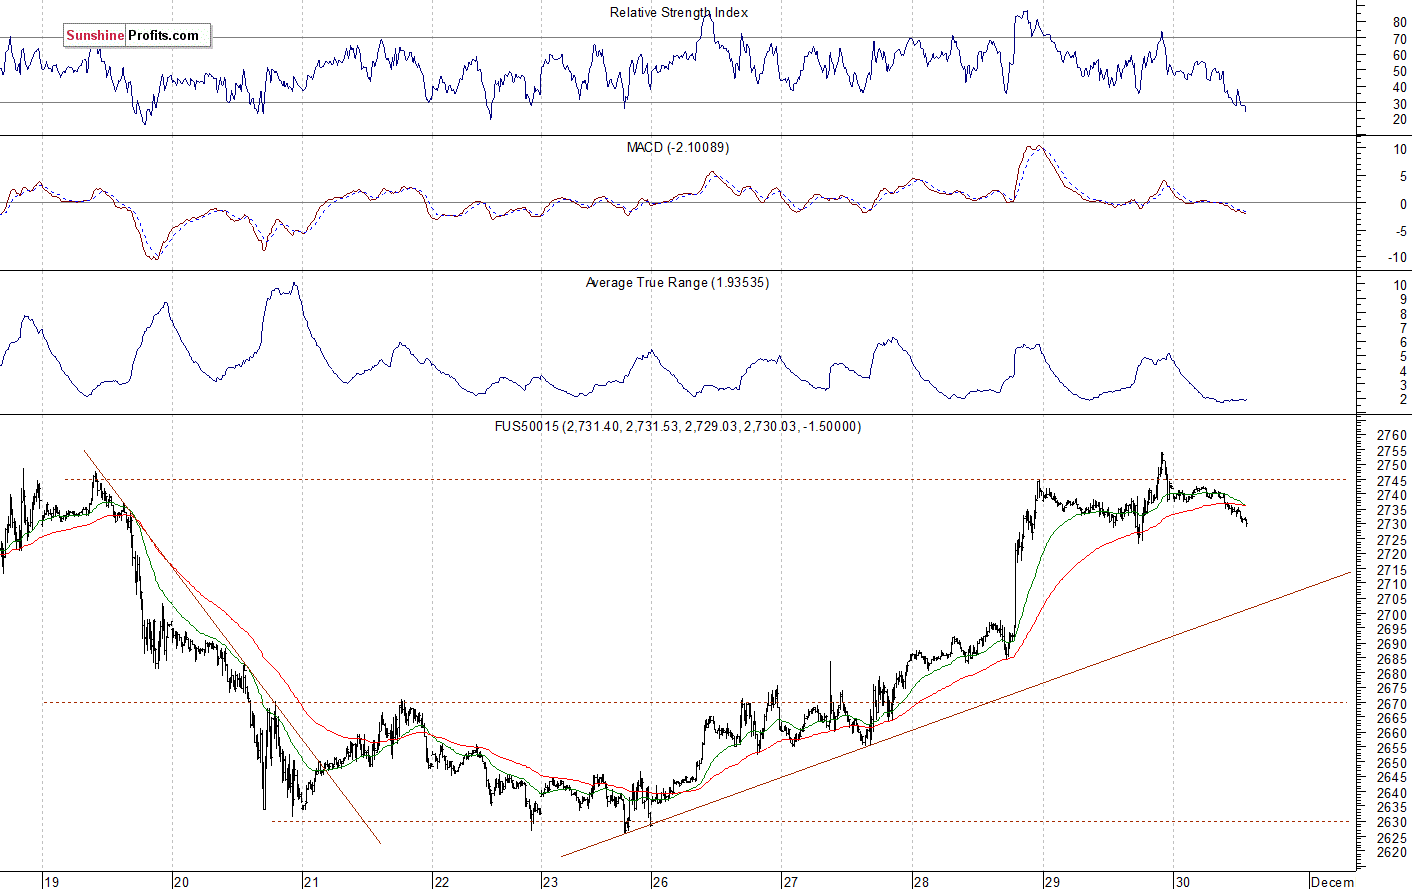
The S&P 500 futures contract trades within an intraday downtrend, as it extends its yesterday decline off the daily high. The market bounced off the resistance level of around 2,740-2,750. The nearest important support level is at 2,700-2,720. The futures contract continues to trade along its previous local highs, as we can see on the 15-minute chart:
Nasdaq Also Slightly Lower
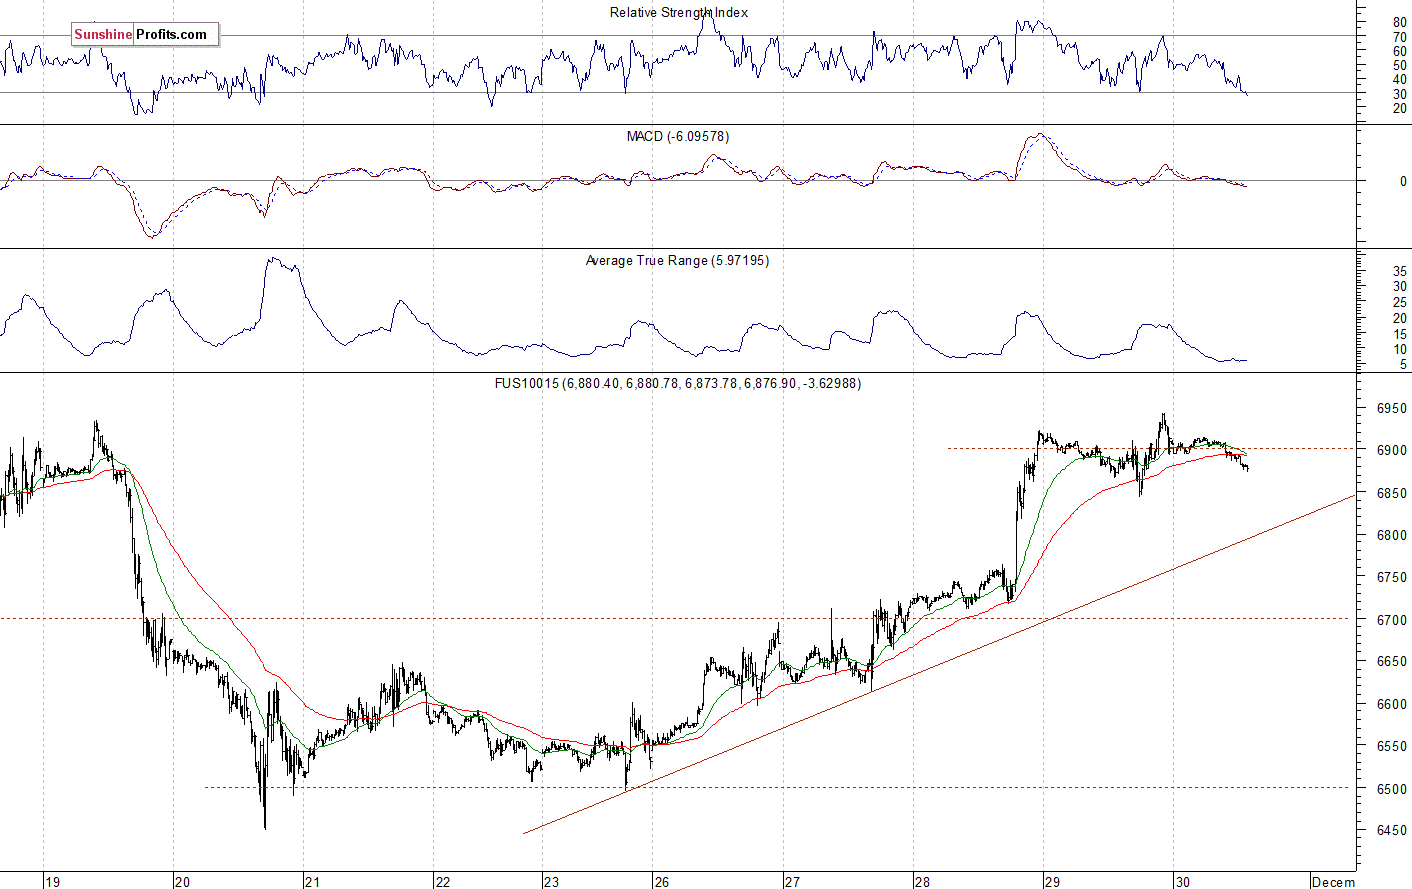
The technology Nasdaq 100 futures contract follows a similar path, as it extends its yesterday's decline. The nearest important level of resistance remains at 6,900-6,950, marked by the local high. On the other hand, the support level is at 6,800-6,850, marked by the previous resistance level. The tech stocks' gauge accelerated its downtrend on Tuesday a week ago and it reached the new low of around 6,450. It was the lowest since the late April. Then the market fluctuated along the level of 6,500-6,550. And now it is trading close to 6,900 mark. We could see more short-term volatility. The Nasdaq futures contract extends its short-term consolidation along the level of 6,900, as the 15-minute chart shows:
Apple, Amazon - Pause Before Another Leg Higher?
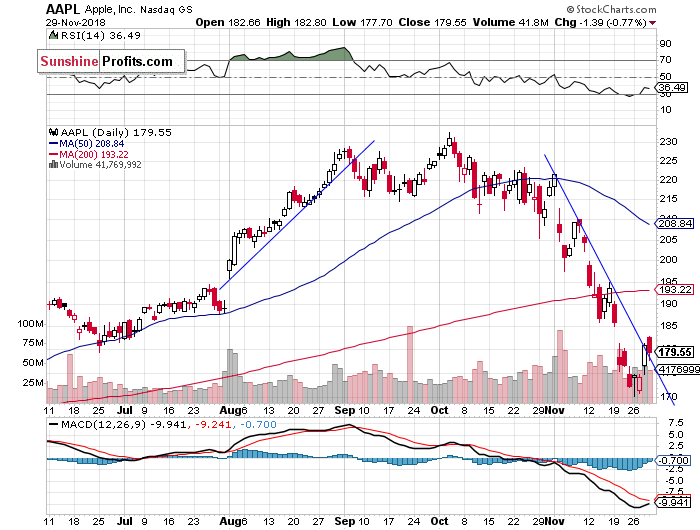
Let's take a look at Apple, Inc. stock (AAPL) daily chart (chart courtesy of http://stockcharts.com). The stock accelerated its sell-off a week ago following the earlier breakdown below the support level of $185-190. It fell closer to $170 at the beginning of this week. The market has reached a temporary bottom of around $170-175. It rallied on Wednesday, and it closed at the month-long downward trend line. We may see some short-term uncertainty here:
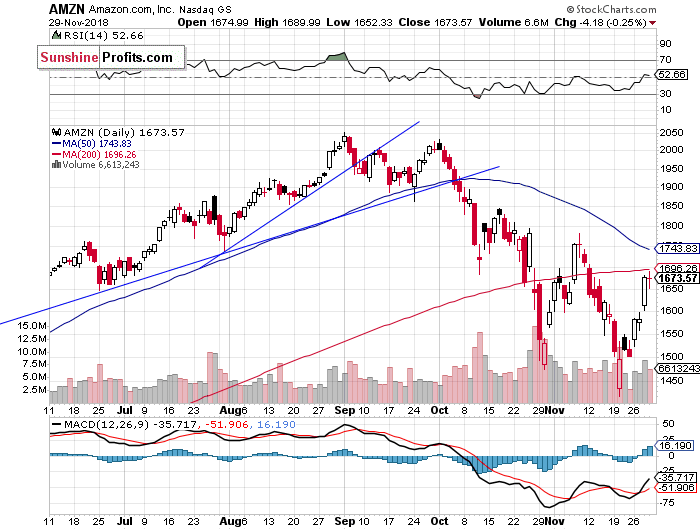
Now let's take a look at Amazon.com, Inc. stock (AMZN) daily chart. It was relatively stronger recently, as it retraced some more of the recent sell-off. On Tuesday a week ago, the stock fell closer to the price of $1,400, before rebounding off the support level. Then the market got back above the resistance level of $1,500, and it accelerated higher on Wednesday. The nearest important resistance level is now at $1,700-1,800, marked by some previous local highs:
Dow Jones Remains Above 25,000 Mark
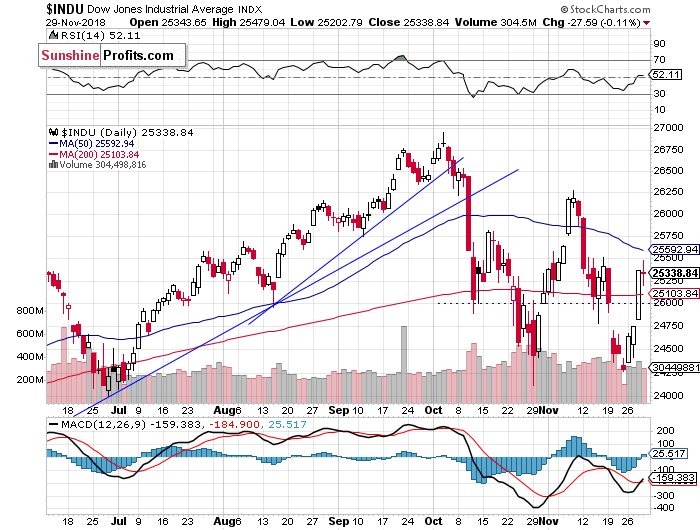
The Dow Jones Industrial Average broke above 25,000 mark on Wednesday, as it accelerated its short-term uptrend. The market got back to the resistance level of around 25,500, marked by the mid-November local highs. Will it continue towards the early November highs of 26,000-26,250? For now, it looks like a volatile consolidation following the October sell-off:
The S&P 500 index accelerated its short-term uptrend on Wednesday after breaking above its week-long trading range and the resistance level of 2,700. For now it looks like an upward correction or an advance within almost two-month long consolidation. There have been no confirmed short-term negative signals so far. However we can see some technical overbought conditions.
Concluding, the S&P 500 index will likely open lower today. The market continues to fluctuate following the recent rally. For now, it doesn't look like a topping pattern, but we could see some more short-term volatility.
Trading position (short-term; our opinion): no positions are justified from the risk/reward perspective.
Thank you.
Paul Rejczak
Stock Trading Strategist
Stock Trading Alerts

