

Briefly:
Intraday trade: The S&P 500 lost 0.1% on Friday, after opening 0.4% higher. The market will probably open higher today. We may see some short-term volatility following the recent sell-off.
Trading position (short-term; our opinion): no positions are justified from the risk/reward perspective.
Our short-term outlook is neutral, and our medium-term outlook is neutral:
Short-term outlook (next 1-2 weeks): neutral
Medium-term outlook (next 1-3 months): neutral
Today's Stock Trading Alert will be shortened. We apologize for inconvenience.
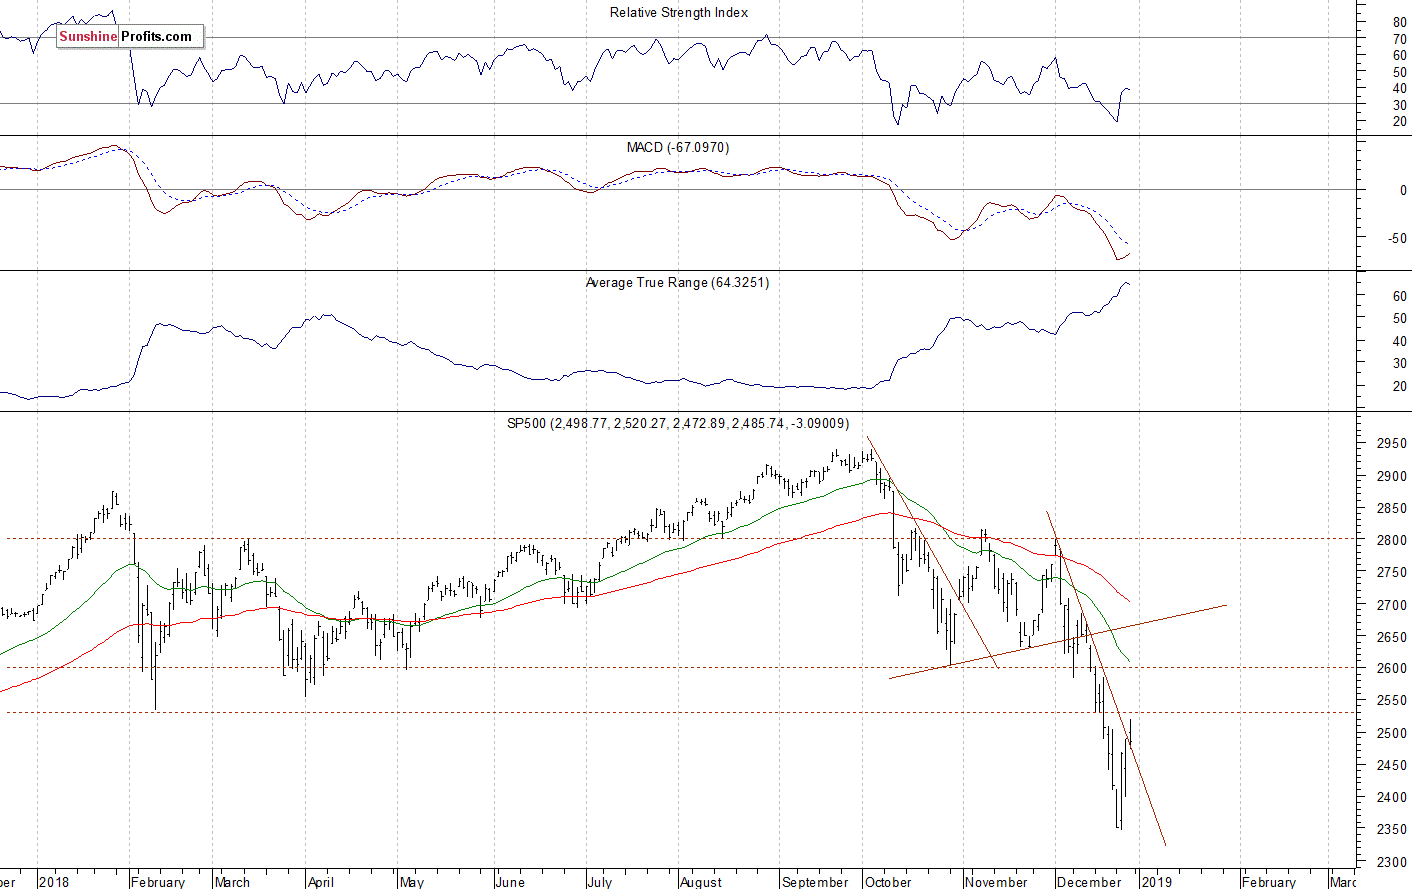
The U.S. stock market indexes were mixed between -0.3% and +0.1% on Friday, after retracing some more of their recent sell-off. The S&P 500 index fell the lowest since the late April of 2017 and it traded 20.2% below September the 21st record high of 2,940.91 on Wednesday when it reached the new medium-term low of 2,346.58. Then the market rallied and got close to 2,500 mark. The Dow Jones Industrial Average lost 0.3% and the Nasdaq Composite gained 0.1% on Friday.
The broad stock market broke below its two-month-long trading range recently, as the S&P 500 index fell below the level of 2,600. Then the market accelerated lower and it broke below the level of 2,400 on Monday a week ago. The downward correction reached 20.2% from the September all-time high, surpassing January-February correction of around 12%. Is this a long-term bear market? It still looks like a medium-term downward correction, but the index remains below the recent consolidation, as we can see on the daily chart:
Positive Expectations Again
Expectations before the opening of today's trading session are positive, because the index futures contracts trade 0.8-0.9% above their Friday's closing prices. The European stock market indexes have gained 0.1-1.3% so far. There will be no new important economic data announcements today. The broad stock market may slightly extend its short-term advance again. For now, it still looks like an upward correction within a downtrend.
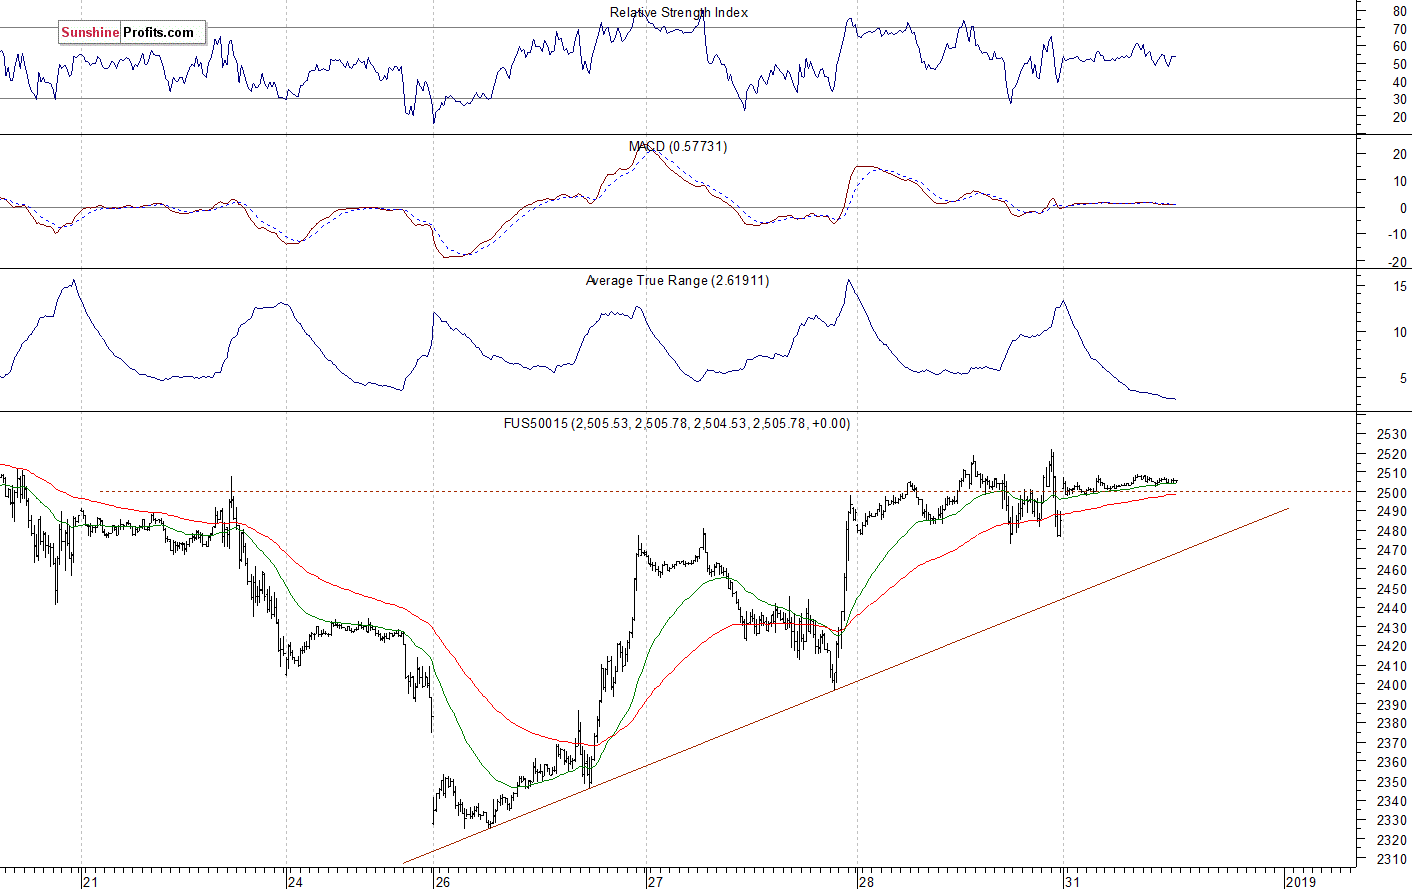
The S&P 500 futures contract trades within an intraday consolidation, as it continues to fluctuate along the level of 2,500. The nearest important level of resistance remains at around 2,510-2,520, marked by the short-term local highs. On the other hand, the support level is at 2,470-2,480, among others. The futures contract remains above its short-term upward trend line, as the 15-minute chart shows:
Nasdaq Going Sideways
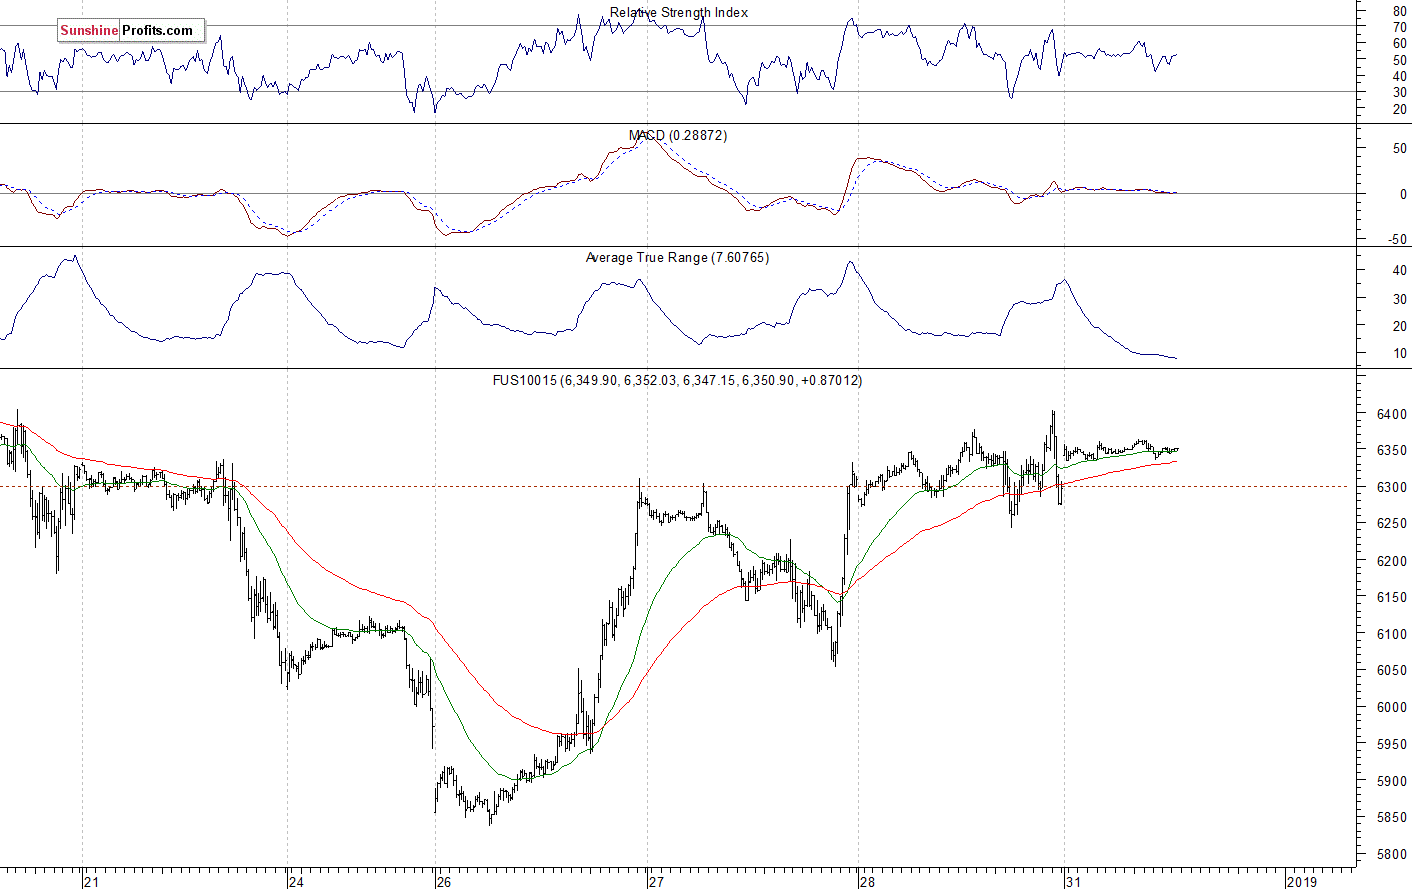
The technology Nasdaq 100 futures contract follows a similar path, as it trades within an intraday consolidation. The market fell below the level of 6,000 a week ago on Monday and it continued lower on Wednesday. It traded 24.7% below the early October record high, before reversing higher. The nearest important level of resistance is now at around 6,400-6,500. On the other hand, the support level is at 6,150-6,200, among others. The Nasdaq futures contract extends its short-term fluctuations, as we can see on the 15-minute chart:
The S&P 500 index extended its downtrend on Wednesday, before reversing higher and gaining 5%. The broad stock market was more than 20% below its September's record high. Is this a new long-term bear market or just medium-term downward correction? For now, it looks like a correction. However, there have been no confirmed medium-term positive signals so far.
Concluding, the S&P 500 index will likely open higher today. We may see more short-term volatility after last week's Monday's panic-selling climax followed by Wednesday's rally.
Trading position (short-term; our opinion): no positions are justified from the risk/reward perspective.
Thank you.
Paul Rejczak
Stock Trading Strategist
Stock Trading Alerts

