

Briefly:
Intraday trade: The S&P 500 index lost 0.6% on Tuesday, after opening 1.3% lower. The broad stock market will probably open lower today. We may see another attempt at breaking below the support level. However, the index will likely extend its short-term consolidation along the level of 2,700.
Trading position (short-term; our opinion): no positions are justified from the risk/reward perspective.
Our short-term outlook is neutral, and our medium-term outlook is neutral:
Short-term outlook (next 1-2 weeks): neutral
Medium-term outlook (next 1-3 months): neutral
The U.S. stock market indexes lost between 0.4% and 0.6% on Tuesday, extending their short-term downtrend, as investors' sentiment worsened following global stocks markets' weakness. The S&P 500 index is currently 6.8% below its September the 21st record high of 2,940.91. The Dow Jones Industrial Average lost 0.5% and the Nasdaq Composite lost 0.4% on Tuesday.
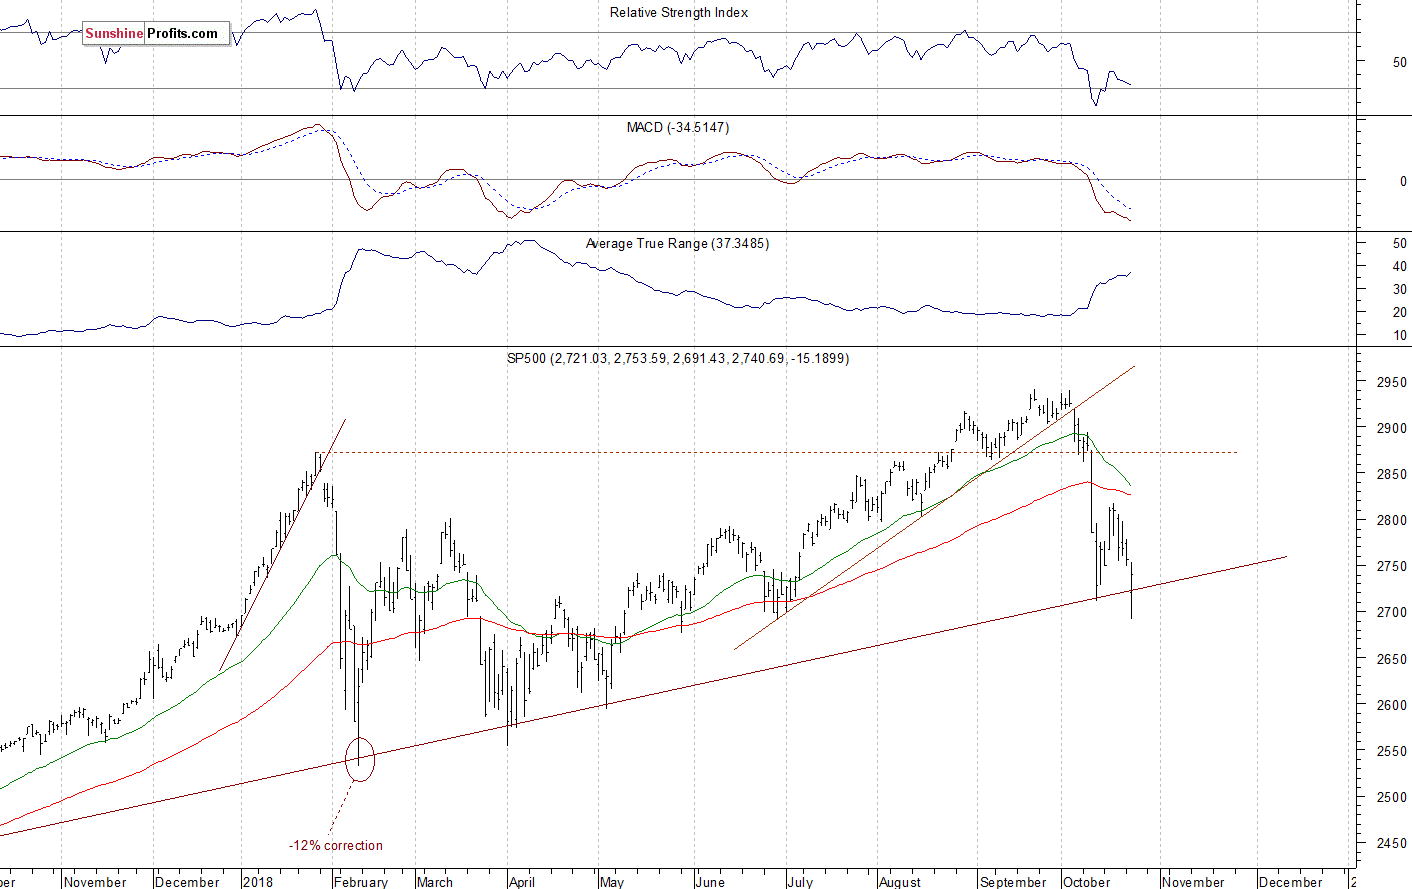
The nearest important level of resistance of the S&P 500 index is now at around 2,750-2,755, marked by the yesterday's daily high and Monday's daily low. The resistance level is also at 2,780-2,800, marked by the recent fluctuations. On the other hand, the nearest important level of support is at 2,690-2,710, marked by the recent local lows. The support level is also at around 2,675.
The broad stock market continued retracing its medium-term advance yesterday, as it broke slightly below 2,700 mark, before reversing higher. On Tuesday a week ago the index broke above the resistance level of around 2,800. On Wednesday we saw a short-term consolidation. On Thursday stocks sold off again and then they accelerated lower yesterday. The market resumed its downtrend and broke slightly below the long-term trend line. However, it continues to act as a support level, as the daily chart shows:
Negative Expectations Again
Expectations before the opening of today's trading session are negative this morning, because the index futures contracts trade 0.5-0.7% below their yesterday's closing prices. The European stock market indexes have gained 0.4-0.8% so far. Investors will wait for some economic data announcements today: Flash Manufacturing PMI, Flash Services PMI at 9:45 a.m., Crude Oil Inventories at 10:30 a.m., the Beige Book release at 2:00 p.m. Investors will also wait for some quarterly earnings releases. The broad stock market will likely extend its short-term fluctuations following yesterday's sell-off. For now, it still looks like a consolidation or a flat correction. If the S&P 500 breaks below the support level of 2,700, we could see more selling pressure.
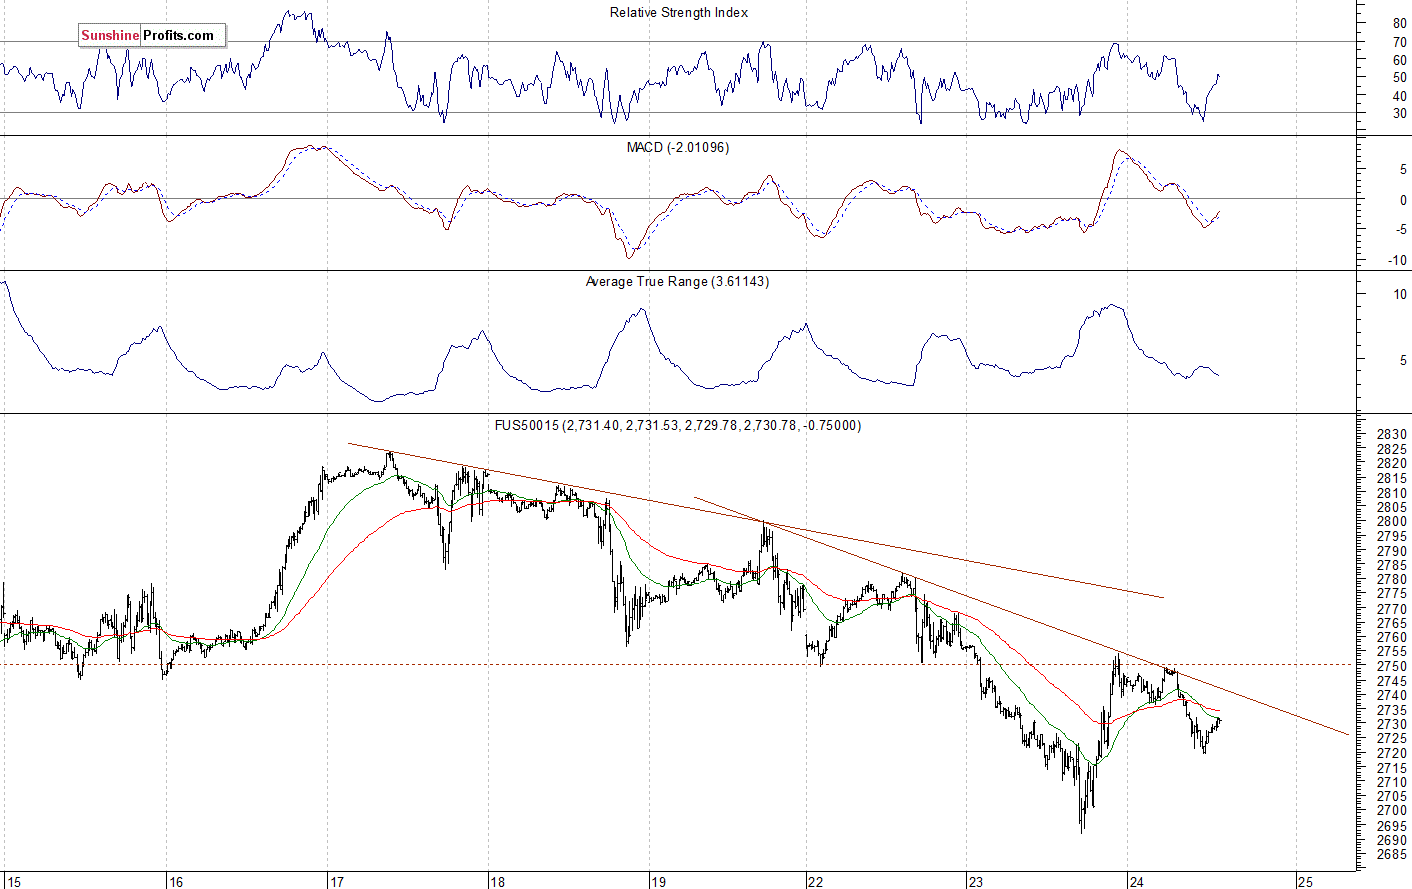
The S&P 500 futures contract trades within an intraday downtrend, following an overnight decline. The nearest important level of support is now at around 2,715-2,720, marked by a local low. The next support level is at 2,690-2,700. On the other hand, the level of resistance is at 2,740-2,750, among others. The futures contract trades below its short-term downward trend lines, as we can see on the 15-minute chart:
Nasdaq Above 7,000 Mark
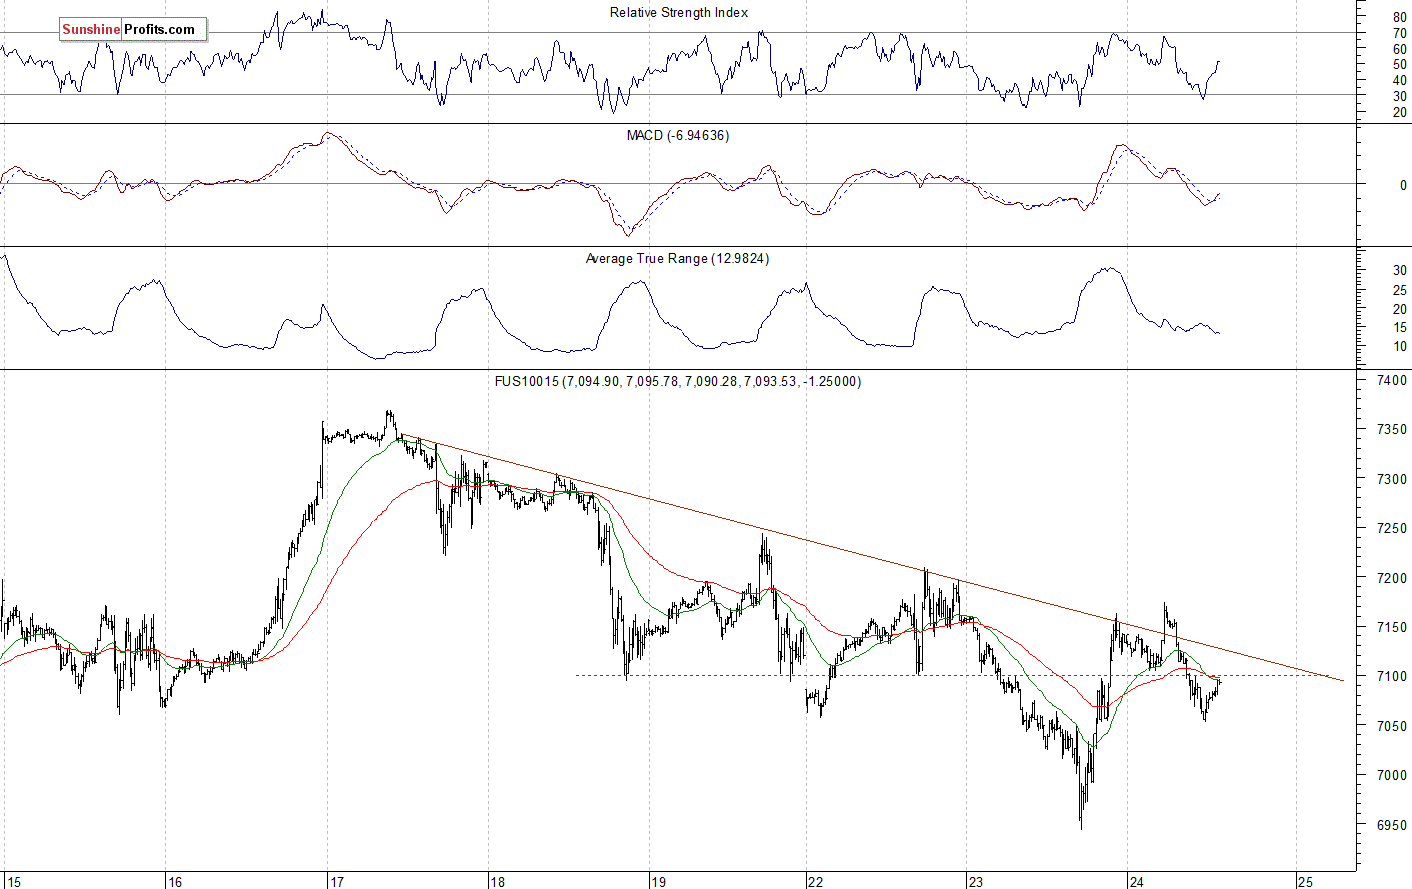
The technology Nasdaq 100 futures contract follows a similar path, as it trades within an intraday consolidation. The tech stocks' gauge got back below 7,000 mark yesterday, before reversing higher. It fell over 800 points off its October the 1st record high above the level of 7,700 recently. We could see more short-term volatility. The nearest important level of resistance is now at around 7,100-7,150. On the other hand, the support level is at 6,900-7,000. The Nasdaq futures contract continues to trade along the level of 7,100, as the 15-minute chart shows:
Big Cap Tech Stocks Bouncing Up Again
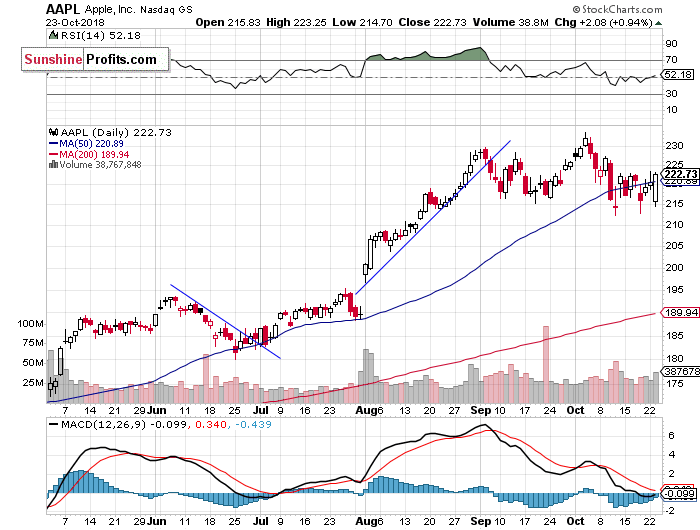
Let's take a look at Apple, Inc. stock (AAPL) daily chart (chart courtesy of http://stockcharts.com). It reached the new record high at the level of $233.47 in the early October, as it continued to act relatively strong. Then the stock retraced its rally. Apple trades within an almost two-month-long consolidation, and the support level remains at around $215. Yesterday, the stock bounced off that support level:
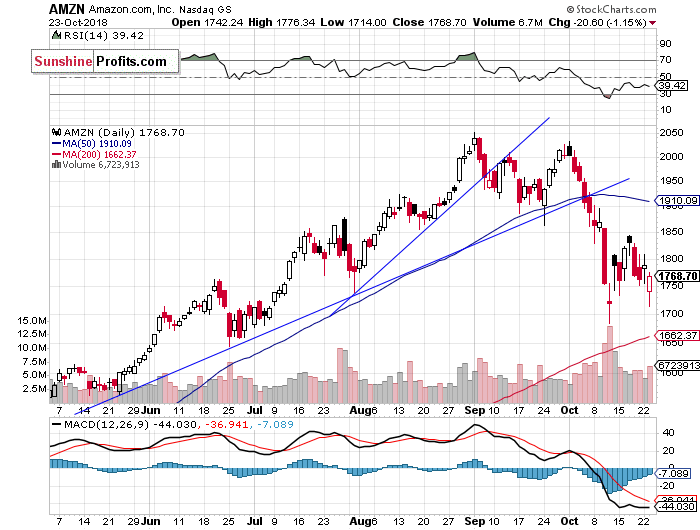
Now let's take a look at Amazon.com, Inc. stock (AMZN) daily chart. It traded within a clear short-term downtrend following breaking down below its upward trend lines recently. Then it bounced off the support level of around $1,700. Was it an upward reversal or just a correction within an uptrend? For now it looks like a correction. However, yesterday's intraday advance may have marked some short-term bottom:
Dow Jones Got Back Above 25,000 Mark Again
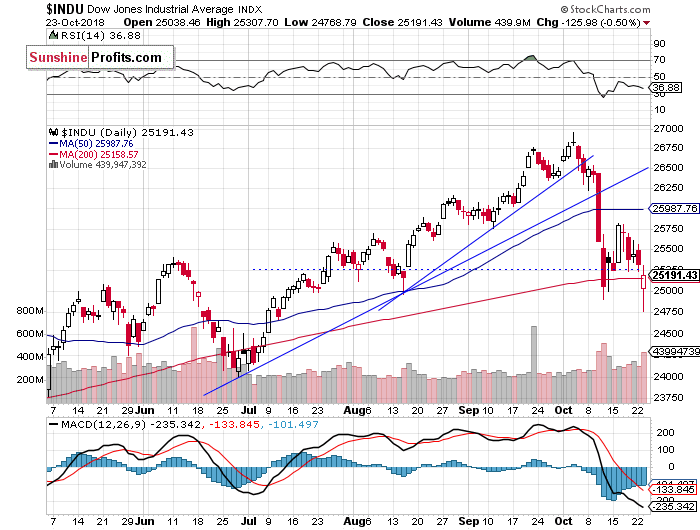
The Dow Jones Industrial Average reached its new all-time high at the level of 26,951.81 on October the 3rd. Then the blue-chip stocks' gauge broke below its medium-term upward trend lines and the support level of around 26,000. Then the market bounced off the support level of around 25,000, but it failed to contiue higher at the resistance level of 26,000. Yesterday it fell below the level of 25,000 reaching the new short-term low, before bouncing up above the level of 25,000 again:
The S&P 500 index sold off below the level of 2,700 yesterday. However, it bounced off that support level and managed to stay above its long-term upward trend line. For now, it still looks like a consolidation following October the 10th-11th sell-off. And there have been no confirmed positive signals so far.
Concluding, the S&P 500 index will probably open lower again. The market may extend its short-term consolidation along the level of 2,700 and the long-term upward trend line. We may see more volatility ahead of some major quarterly corporate earnings releases.
Trading position (short-term; our opinion): no positions are justified from the risk/reward perspective.
Thank you.
Paul Rejczak
Stock Trading Strategist
Stock Trading Alerts

