

Briefly:
Intraday trade: The S&P 500 index lost 2.1% after opening 0.3% lower on Thursday. The broad stock market will probably higher today. Then we may see some more volatile fluctuations following the recent sell-off.
The S&P 500 index sold off slightly (considering the recent volatility) below our stop-loss level of 2,720 yesterday. It reached the daily low of around 2,710, but it quickly bounced off the support level. So we still think that the speculative long position in the S&P 500 index is justified from the risk/reward perspective, because the market may have reached the panic bottom of a downward correction.
Trading position (short-term; our opinion): long positions in the S&P 500 index with a stop-loss order at 2,720 and the profit target of 2,860 are justified from the risk/reward perspective.
Our short-term outlook is bullish, and our medium-term outlook is neutral:
Short-term outlook (next 1-2 weeks): bullish
Medium-term outlook (next 1-3 months): neutral
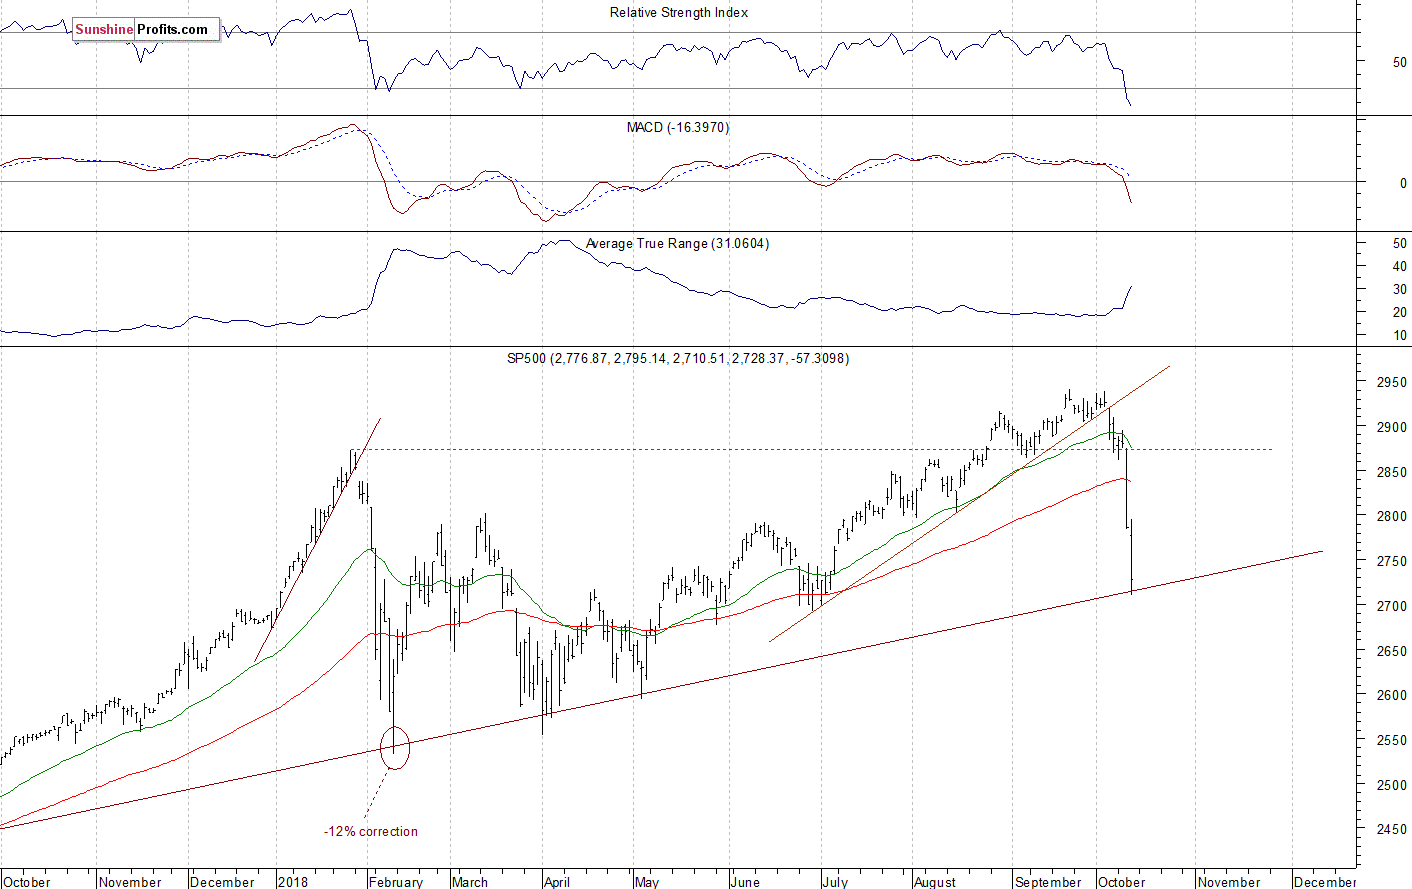
The U.S. stock market indexes lost 1.3-2.1% on Thursday, extending their short-term downtrend, as investors sentiment remained bearish following Wednesday's rout. The S&P 500 index got close to the level of 2,700, before slightly bouncing off its long-term trend line. It currently trades 7.2% below September the 21st record high of 2,940.91. The Dow Jones Industrial Average lost 2.1% and the Nasdaq Composite lost 1.3% yesterday.
The nearest important level of resistance of the S&P 500 index is now at around 2,750-2,770, marked by the recent level of support. The resistance level is also at 2,800. On the other hand, the level of support is now at 2,700-2,720, marked by the late June - early July local lows and the long-term upward trend line. The support level is also at 2,630-2,650.
The broad stock market continued retracing its medium-term advance yesterday, as it got closer to 2,700 mark. We may see a bounce at the opening of today's trading session. So will the downtrend reverse? It's hard to say. For now, it looks like some relatively flat correction following the recent decline. If the index breaks below the long-term trend line and the support level of around 2,700, we could see some more selling pressure:
Positive Expectations, but...
The index futures contracts trade 0.9-1.6% above their yesterday's closing prices. So expectations before the opening of today's trading session are very positive. The European stock market indexes have gained 0.4-0.8% so far. Investors will now wait for the Michigan Sentiment number release at 10:00 a.m. The broad stock market will probably extend its yesterday's bounce off the new short-term low slightly. But is this an upward reversal? There have been no confirmed positive signals so far. However, we still can see some short-term oversold conditions.
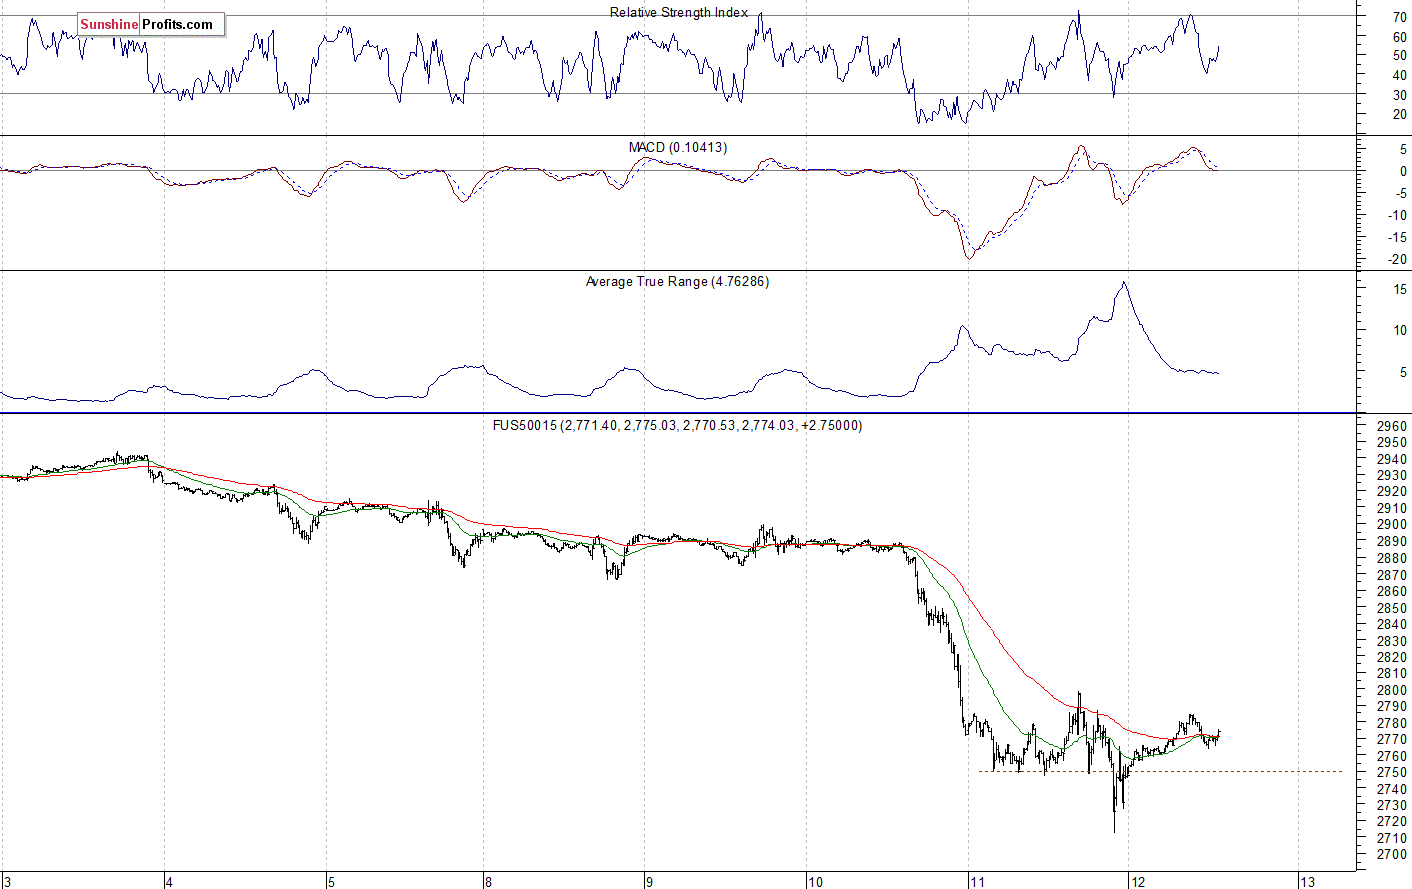
The S&P 500 futures contract trades within an intraday consolidation following an overnight advance. The nearest important level of resistance is at around 2,780-2,800, marked by the short-term local highs. The resistance level is also at 2,820-2,830. On the other hand, the support level is at 2,740-2,750, marked by the local lows. The next level of support is at 2,700-2,720. The futures contract continues to trade above the level of 2,750 following its yesterday' intraday dip below that support level, as we can see on the 15-minute chart:
Nasdaq Also Higher
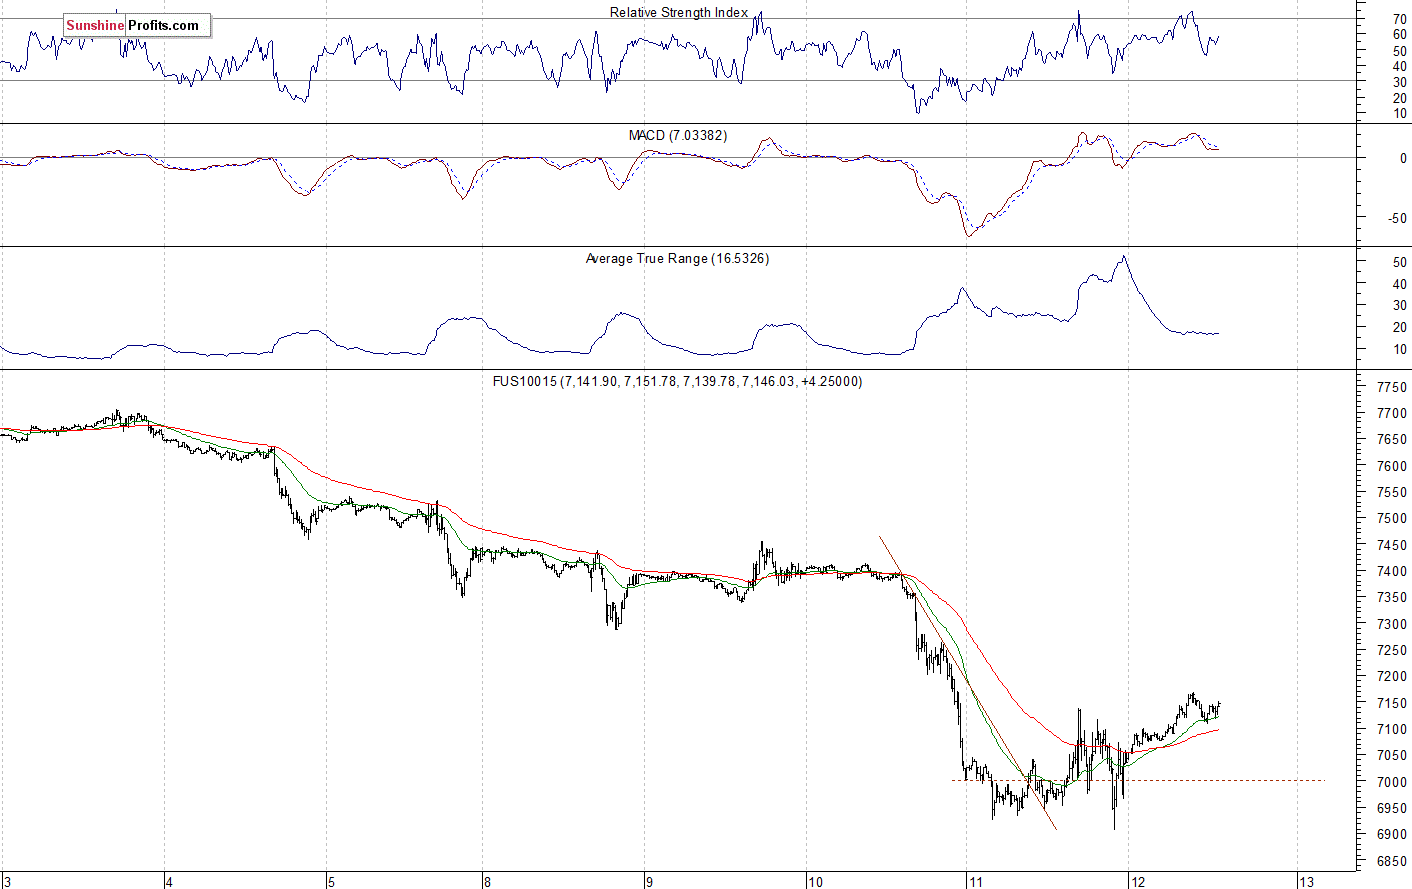
The technology Nasdaq 100 futures contract follows a similar path, as it trades within an intraday consolidation following an overnight advance. The tech stocks' gauge broke below 7,000 mark recently, and it traded closer to the level of 6,900 yesterday. So it fell over 800 points off its October the 1st record high above the level of 7,700. The nearest important support level is now at around 6,900-7,000, marked by the recent fluctuations. On the other hand, the resistance level is now at 7,200-7,250, among others. The Nasdaq futures contract retraces some of its Wednesday's sell-off, as the 15-minute chart shows:
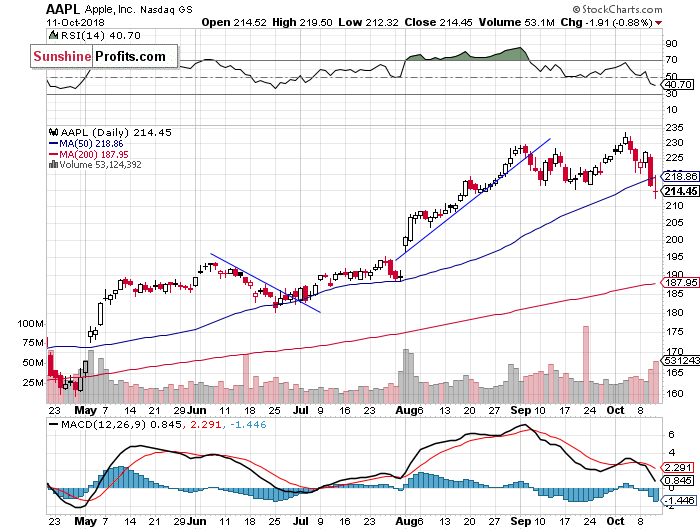
Big Cap Tech Stocks - Short-Term Bottom or Just Pause?
Let's take a look at Apple, Inc. stock (AAPL) daily chart (chart courtesy of http://stockcharts.com). It reached the new record high at the level of $233.47 in the early October, as it continued to act relatively strong. Then the stock retraced most of its recent rally. Tuesday's trading session was pretty bullish, as the price bounced off the support level. But then it sold off on Wednesday, as it got close to the support level of around $215 again. Is this a new downtrend or just a consolidation? The stock still seems relatively stronger than the broad stock market:
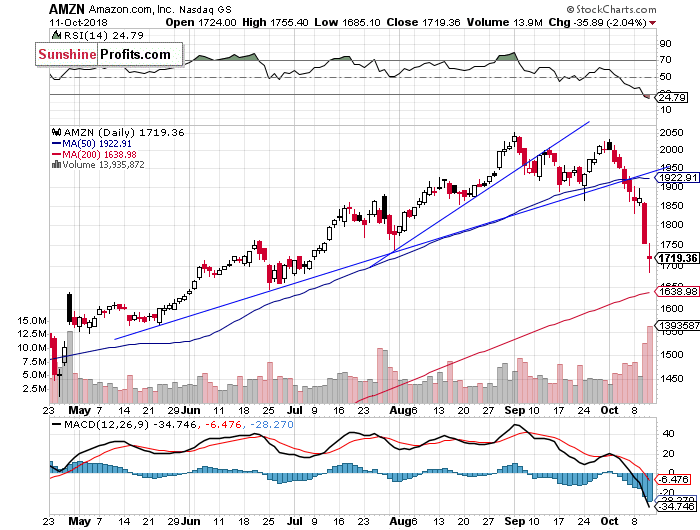
Now let's take a look at Amazon.com, Inc. stock (AMZN) daily chart. It trades within a clear short-term downtrend following breaking down below its upward trend lines. The downtrend accelerated on Wednesday, and the stock continued lower yesterday. However, we can see an attempt at bouncing off the support level of around $1,700:
Dow Jones Closer to 25,000 Mark
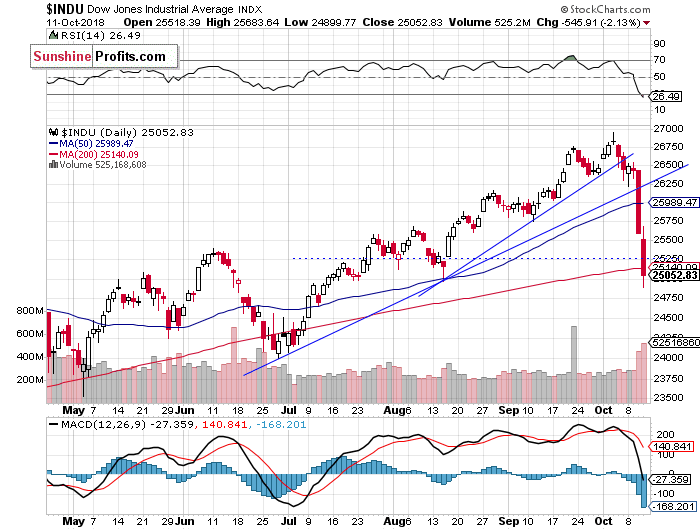
The Dow Jones Industrial Average reached its new all-time high at the level of 26,951.81 on Wednesday a week ago. Then the blue-chip stocks' gauge broke below its two-month-long upward trend line on Friday. It looked like a downward correction, but the market fell below its medium-term upward trend line and the support level of around 26,000. Then it accelerated much lower. Yesterday we wrote that "the decline may extend towards the support level of around 25,000-25,250" And it did. Will the market bounce off that support level? We may see some short-term fluctuaions, maybe a bottoming pattern:
The S&P 500 index sold off on Wednesday, following breaking down below its recent local lows. The market sharply reversed its medium-term uptrend. Then it fell closer to 2,700 mark yesterday. But will it continue much lower from here? We may see an attempt at bouncing off the mentioned medium-term support levels. There is the "October Effect" theory. It says that stocks tend to decline or crash during the month of October. Well, we can see a very sharp decline this month. So it is some kind of a stock seasonality pattern.
Concluding, the S&P 500 index will probably open higher today. The market trades within a short-term consolidation following the recent sell-off. There have been no confirmed short-term positive signals so far. However, we still can see some technical oversold conditions.
Trading position (short-term; our opinion): long positions in the S&P 500 Index with a stop-loss order at 2,720 and the profit target of 2,860 are justified from the risk/reward perspective.
Thank you.
Paul Rejczak
Stock Trading Strategist
Stock Trading Alerts

