

What a difference a couple of days makes, right? As the week started out, the broader indices seemed reluctant to trickle lower in the slightest. It was up, up, up. Now, we are dealing with the Colonial Pipeline debacle in the US, Gaza Strip battles, and a huge inflation print in the US courtesy of Wednesday’s CPI data.
All of this equated to continued selling in the major US averages on Wednesday (May 12). In case you missed it, Wednesday’s US Consumer Price Index data surged far beyond market expectations, resulting in a 13-year high reading. I think this exceeding the 0.2% forecast was expected by many market participants. However, the print of 0.8% was four times the expectations, and this created some follow-through downside volatility across the board in US equities, as the US Dollar and bond yields surged.
Since we are approaching some key levels in some of the instruments that we are following, let’s recap where we sit across several of them.
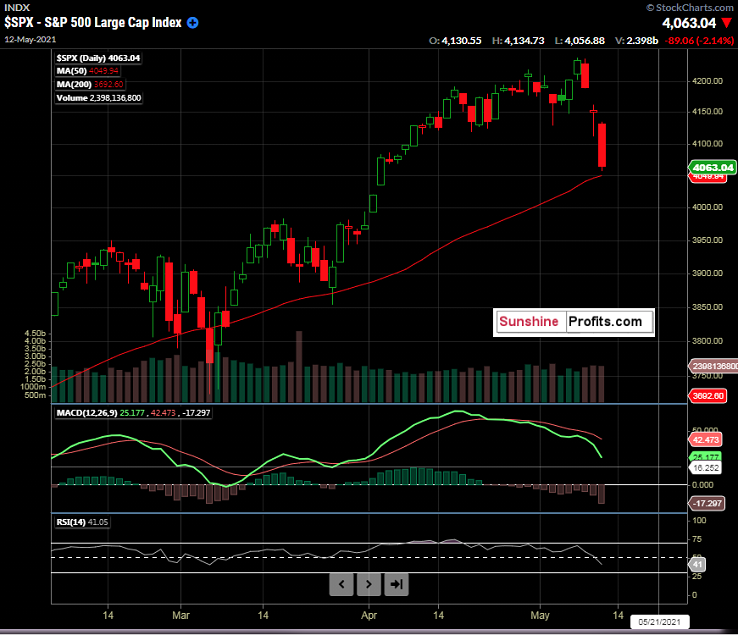
Figure 1 -S&P 500 Index Daily Candles ($SPX) February 4, 2021 - May 12, 2021. Source stockcharts.com
If you like large red candlesticks, yesterday was your day. We saw the S&P 500 ($SPX) move lower by 2.14% on the session, closing at 4063.04. Prices came very close to the 50-day moving average that we have been monitoring, but it did not pierce or close below it.
Next, as we were discussing yesterday, we have the Volatility Index ($VIX):
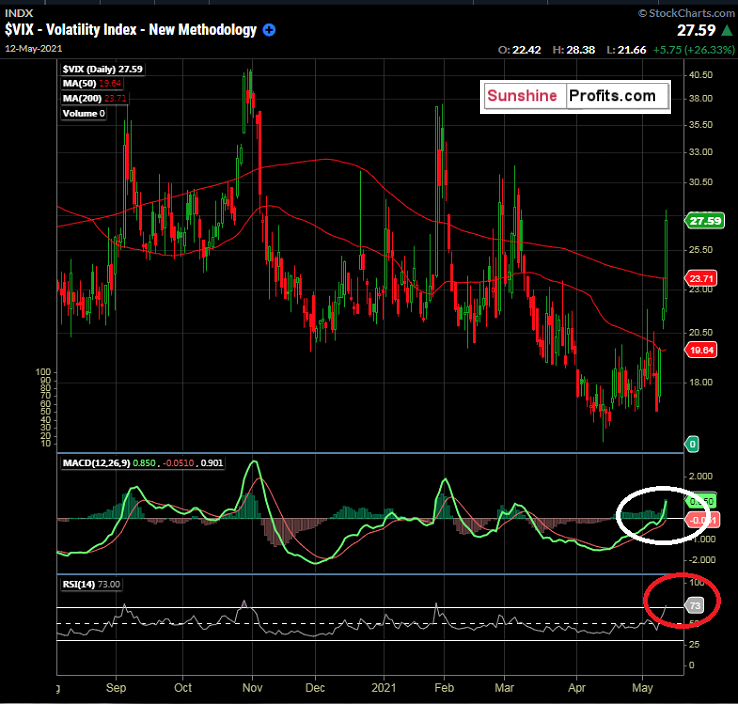 Figure 2 - $VIX Volatility Index Daily Candles August 5, 2020 - May 10, 2021. Source stockcharts.com
S&P 500 Index put buyers had a glorious day, with the $VIX surging 26.33% on the session and closing well above its 200-day moving average, as we can see above. This has been the case of the last several selloffs in the S&P 500, as we outlined yesterday. Other notes of importance on this chart include the RSI(14) nearing overbought levels with a close around 73 on the day. The MACD (12,26,9) crossed the zero line as well. Wednesday was a great session for folks long S&P puts, as the implied volatility of the options along with the options delta exploded for those trading at or near-the-money options.
As we outlined yesterday, we are still monitoring for some pattern repetition in $VIX and $SPX that we have seen in the past.
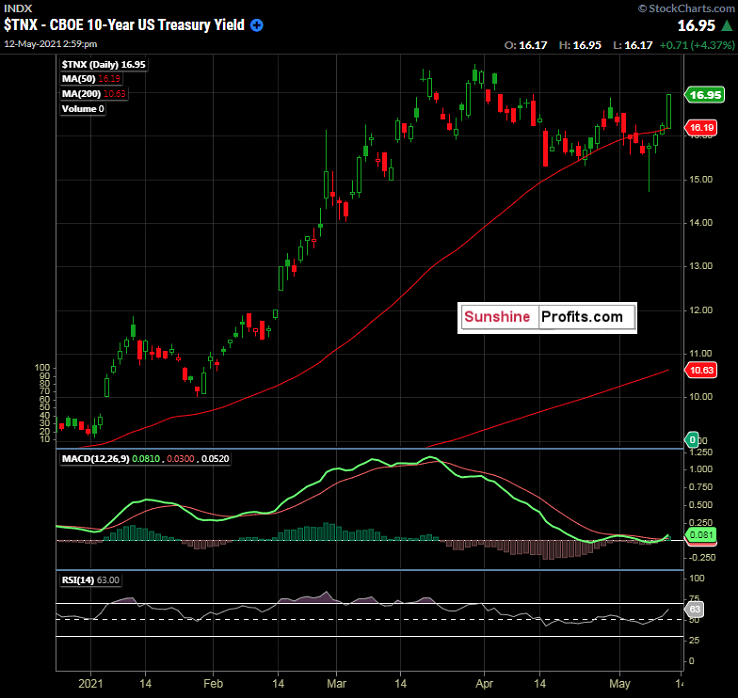
Figure 3 -CBOE 10-year US Treasury Yield Daily Candles January 12, 2021 - May 10, 2021. Source stockcharts.com
As the US Dollar rose, so did bond yields. The 10-year yield is something that we have been monitoring closely, as it can be a valuable indicator.
What will the US equity market have in store for us for the remainder of the week?
Referencing Wednesday’s publication, I would like to revisit the gathered data, as we are now nearing some potentially critical levels.
- $SPX found support around the 50-day moving average on 2 of its last 3 attempts.
- When $SPX broke the 50-day on 1 of the last 3 attempts, it traded below it for 2 sessions.
- When $SPX broke the 50-day in September 2020 & October 2020, it closed below it between 7 - 9 sessions.
- The $VIX doesn’t seem to like being above its 200-day moving average for long (2 - 7 sessions) before going back below it.
A quick note about the 50-day moving average: it is dynamic in nature. So, it adjusts each trading day. The 50-day moving average will differ the following day, and I suggest using it on your charting software/charting platform so that you have the most up-to-date information in real-time.
We approached but did not break or close below the 50-day moving average of the $SPX on Wednesday. The 50-day moving average is 4049.94 (let’s call it 4050) as of Wednesday’s market close, and the low made on Wednesday was 4056.88. Note, the 50-day moving average level will be a different number on Thursday.
I love the concept of buying into the fear caused by geopolitics and bearish US economic data, using unemotional discipline.
I want to reiterate a BUY in the $SPX but ONLY on a pullback to; or below the 50-day moving average (currently 4049.94), making the suggested range for entry 3990 - 4049.94. For traders using SPY, the current 50-day moving average is 403.69 (yesterday’s low was 404.00), so a range of approximately 398 - 403.69 would line up rather well should you decide to buy at or below the current 50-day moving average. Will we breach the 50-day moving average?
If the 50-day moving average is broken, and the $SPX closes below it, let's keep in mind the 2 - 7/9 day duration that we have seen in the previous price action, as described above. You can adjust your entries / scaling process accordingly.
Again, if you are using the 50-day moving average as a potential trigger, make sure you have real-time data to identify the level on any given day.
To sum up the current viewpoint and opinion:
I have BUY calls for:
- Invesco MSCI Sustainable Future ETF (ERTH) between $67.76 - $68.74.
Update 05/13 (pre-open): After trading down to $69.17 on Tuesday, ERTH held up rather well on Wednesday, given its tendency for volatility. It was lower by 2.51% as the $SPX shed 2.14%. I like that and find it encouraging. This one is close to the idea range, so let’s keep our eyes peeled today. Always use a stop loss level that caters to your individual risk tolerance.
- S&P 500 ($SPX): but ONLY on a pullback to; or below the 50-day moving average (currently 4049.94), making the suggested idea range for entry 3990 - 4049.94. For traders using SPY, the current 50-day moving average is 403.69, so a range of approximately 398 - 403.69 would line up rather well. Always use a stop loss level that caters to your individual risk tolerance.
I have a SELL call for:
June 10-year notes (ZNM2021) 132'22 - 132'24'5 with a tight stop. Target 131’27’5. If you are not familiar with interest rate futures, do not take the trade.
Update 05/13: We were on the beam here and had the correct outlook. The direction was correct, but we just missed the entry zone by a matter of hours. Since the outlook has changed with the equity market volatility, I am taking this idea off the board. The opportunity doesn’t seem to be there anymore. It missed the entry target by just 4 ticks! We may not want to be short bonds if the equities rally and reverse sharply.
I have a HOLD call for:
- First Trust NASDAQ Clean Edge Smart Grid Infrastructure Index Fund (GRID.
- Update 05/13 (pre-open): Grid has traded through our idea range and has traded similarly to the $SPX over the last two sessions. Let’s see how this trades compared to the broader indices, should we get an upside pop shortly. Short-term traders can look at the 52-week high of $90.96 and high $90.00’s to the psychological $100.00 level as take profit level ideas. Always use a stop loss level that caters to your individual risk tolerance.
Have a great remainder of the week, and be emotionless out there!
Thank you,
Rafael Zorabedian
Stock Trading Strategist

