

As commodities have been on the rise, do they provide us with any clues about the direction of the broader US markets? Measuring correlations can help to spot trends (or changes in such trends) across asset classes.
As we head into the new week, we want to be aware of the impending data releases that can affect timing and sentiment. This week is a mild to moderate week on the US economic data side of things, with the largest market impact event happening on Thursday, May 27th, in the form of Preliminary GDP q/q (quarter over quarter). This number is reported in an annualized fashion (so it is the quarterly change x4). Market participants are forecasting a print of 6.4%. Also, bear in mind that this is the Preliminary GDP number. There are three different GDP data releases, the Advance GDP (earliest indication and usually most impactful on markets), Preliminary GDP (this one), and then Final. A bullish print usually strengthens the US Dollar (not always, but usually).
Other than the GDP print, FOMC members Brainard, and Bostic speak on Monday morning, FOMC member Evans speaks on Tuesday morning, and we have Consumer Confidence data on Tuesday, as well. More Fedspeak is in store for Wednesday, with FOMC member Quarles speaking, leading up to the GDP print on Thursday. Thursday also features US Unemployment Claims and Pending Home Sales. Finally, on Friday, we get the Core PCE Price Index which measures the price of services and goods (ex-food and energy) purchased by consumers (not businesses). This data release could warrant some attention due to the inflationary pressure that has been present in the markets as of late.
Overall, it will be a moderate economic data release in the US. I always like to know what data will be coming out, and when, as a trading week begins.
Correlations. Traders love them. They tell a story that really cannot be quantified unless studying the raw data. As we have had so much attention going to inflation lately, it is a good time to review the broader market S&P 500 vs. commodities to get an idea of the relationship between them.
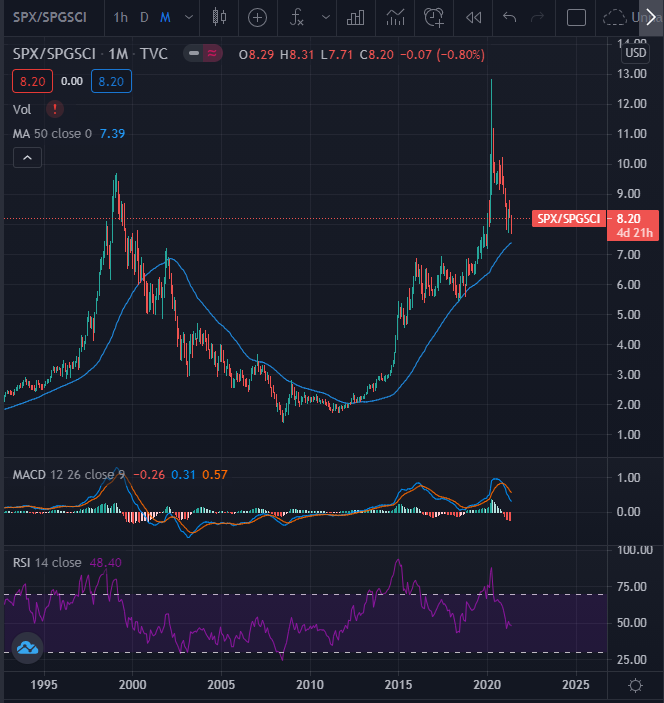
Figure 1 - SPX/SPGSCI TVC Monthly Candles November 1992 - May 2021. Source tradingview.com
Here we have a long-term chart of the SPX (S&P500) divided by the SPGSCI (S&P Goldman Sachs Commodity Index). So, we have the ratio between the two instruments to inspect. We can see the large blowoff top price action that occurred in this ratio in Q1 2020 as a result of the pandemic (Crude trading negative, anyone?). There is a nice pullback from the blowoff top levels of the pandemic. The question becomes, is that the top or is it time to be long equities and short commodities? Friday’s PCE data could give us another clue. If buying pullbacks tickles one’s fancy in a contrarian fashion, this could be some food for thought.
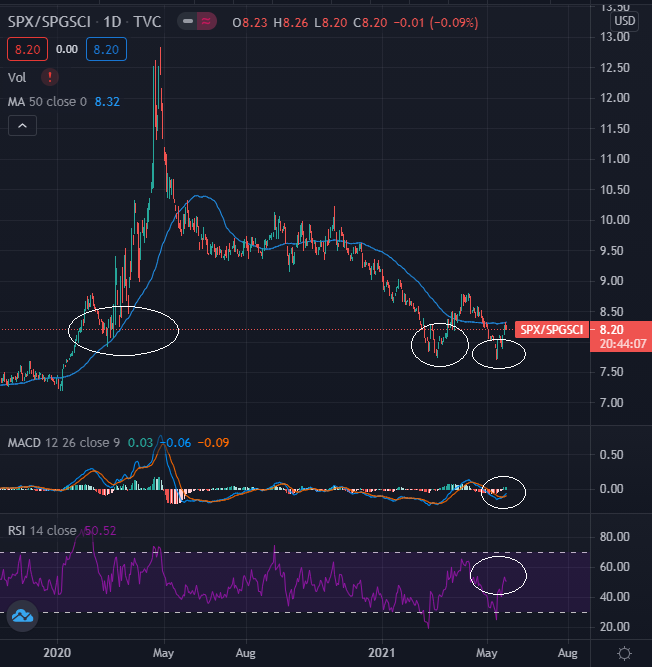
Figure 2 - SPX/SPGSCI TVC Daily Candles October 28, 2019 - May 21, 2021. Source tradingview.com
Drilling down to the daily candles, we do see an interesting formation that could potentially indicate support of this trade between the 7.70-8.00 levels. The level has been key on the last three tries. Notice the horizontal price support and the MACD (12,26,9) starting to look bullish here. In addition, we have the RSI(14) crossing the 50 line.
So, what does all of this mean? Trading ratios does require some knowledge and arithmetic. A trader would need to be long an identical X dollars worth of one instrument and short X dollars of the other to make it work. Do you have experience with this type of pairs trading?
For now, let’s just explore the potential that the S&P 500 could be inexpensive compared to the commodity basket that the SPGSCI measures. Is one of them “cheap” or is the other “expensive”? Or both? Given the S&P 500 earnings multiple, money printing, and other policy directives from the new US administration, it may be simple to conclude that stocks are overpriced, and commodities will go up in a straight line. However, is trading really that easy? Bull markets, such as the one in the S&P 500, do not tend to go out in a whimper. Instead, they tend to go out with a bang.
In the May 10th publication, we were examining the Invesco MSCI Sustainable Future ETF (ERTH) given the US infrastructure bill, new administration, and other factors.
Our initial analysis of ERTH gave us a long idea/opinion range between the key 61.8% Fibonacci retracement level of $67.76 and the 200-day moving average, which was $68.49 on that day. Remember, moving averages change daily, so keep an eye on them in real-time!
Let’s take a look at the ERTH price action since May 10th.
On May 13th, we can see the successful test and support that held up at the 200-day moving average on this day ($68.82). Since that day, ERTH has increased, with the last trade of $72.18 on May 21st. Not bad indeed, a ~ 4.88% pop in 7 trading days. However, what now? It takes quickness and precision to catch these levels even when there is a plan in place. I encourage everyone to track moving averages on a daily basis. This way, if a dynamic moving average is touched, action can be taken, if that is indeed someone’s intention. I use moving averages frequently in my opinion pieces.
Not everyone would have caught this brief dip, so let’s get caught up:
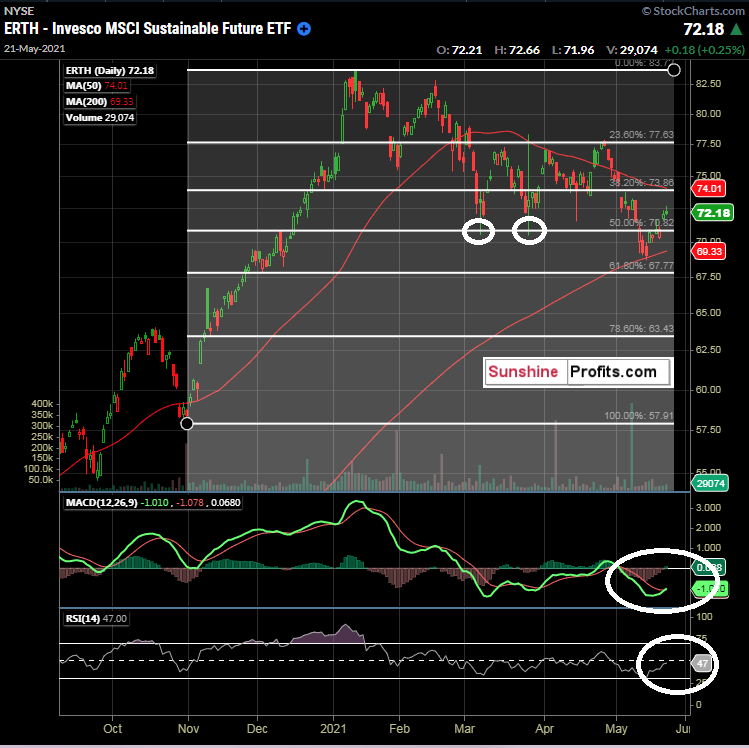
Figure 3 - ERTH Daily Candles September 9, 2020 - May 21, 2021. Source stockcharts.com
As the picture unfolds, I do like the technicals that I see. First, we had the support at the 200-day moving average. Now, we see a MACD (12,26,9) fast line crossing or about to cross the slow line. RSI is still under 50, and this trade could have legs. I prefer to enter long positions on pullbacks, and the next level I see is $70.82 and then the spike lows in March of $70.46 and $70.82. It is possible that we could take those levels out or that they could become support, so keep an eye out for these pullbacks!
As the picture unfolds, I do like the technicals that I see. First, we had the support at the 200-day moving average. Now, we see a MACD (12,26,9) fast line crossing or about to cross the slow line. RSI is still under 50, and this trade could have legs. I prefer to enter long positions on pullbacks, and the next level I see is $70.82 and then the spike lows in March of $70.46 and $70.82. It is possible that ERTH could test those levels or take them out. They could become support, so keep an eye out for pullbacks!
To sum up the current viewpoint and opinion:
I have BUY opinions for:
- Amplify Transformational Data Sharing ETF (BLOK) between $37.68 - $37.91. BLOK has a history of high volatility, so proceed with caution. Always use a stop loss level that caters to your individual risk tolerance.
- Invesco MSCI Sustainable Future ETF (ERTH) between $67.76 - $70.82. Always use a stop loss level that caters to your individual risk tolerance.
I have a SELL opinion for:
- June 10-Year Notes (ZNM2021) between 132’06 - 132’17. Always use a stop loss level that caters to your individual risk tolerance.
- Invesco DB Commodity Index Tracking Fund (DBC) $18.50 - $18.75. Target 17.50 (old highs) to $17.75. Always use a stop loss level that caters to your individual risk tolerance.
I have a HOLD opinion for:
- First Trust NASDAQ Clean Edge Smart Grid Infrastructure Index Fund (GRID). GRID has traded through our idea range of between $86.91 and $88.17. It is not suggested to chase it, if not already long, in my opinion.
- Short-term traders can look at the 52-week high of $90.96 and high $90.00’s to the psychological $100.00 level as take profit level ideas. Always use a stop loss level that caters to your individual risk tolerance.
Have a great week out there, everybody!
Thank you,
Rafael Zorabedian
Stock Trading Strategist

