
With the summer solstice just behind us we would like to review the first half of 2011 and look at what is ahead. Last year gold gained 26%, its third double-digit gain of the last four years. So far this year has been choppy. The yellow metal has risen 19.5 per cent this year to trade at about $1,500 a troy ounce on Friday, buoyed by the emergence of sovereign debt concerns in the US as well as Eurozone debt woes. Since 2011 has begun, gold prices got hit with double-digit selloffs and rallies. The common culprit is the so-called “rebalancing", which is when traders who bought gold at the end of the year to show they owned it, dumped it in 2011 to take a profit. The same traders jumped back into the gold trade in February and March as violence exploded throughout the Middle East and North Africa region and Japan contended with its worst disaster since World War II.
Last year Eurozone concerns dominated the gold trade in the first half of the year. We once wrote that if we got an ounce of gold for every time we wrote the word “Greece” we would have a nice pile by now and would seriously consider retiring (just kidding, we like what we do too much). This week Greece dominated the financial news again as it pulled back from the brink of default and averted a larger Eurozone crisis after passing sweeping austerity measures. However, the possibility of a default remains a fear that troubles the sleep of many investors (for sure, those who don’t own gold.) Europe’s debt crisis, along with fear of natural disasters and political uprisings and upheavals, are prompting investors to seek out investments that promise to protect their portfolios in the event of economic meltdown.
All the factors that drove gold higher last year – fear, uncertainties, lack of confidence in the dollar, gold as the ultimate currency, buying by newly wealthy Chinese families, sovereign troubles in the euro zone, central bank purchases, high unemployment in the U.S. – are still in place. Has anything really changed?
The US dollar has slid 5 per cent so far this year and is trading close to its lowest ever level against a basket of the world’s major currencies. This is biting into its status as the global reserve currency. Holders of large dollar reserves, notably China, have been diversifying away from the dollar. In the first four months of this year, three quarters of the $200 billion expansion in China’s foreign exchange reserves was invested in non-US dollar assets. We recently read about an interesting survey by the Swiss Bank UBS that polled more than 80 central bank reserve managers and sovereign wealth funds that collectively control more than $8,000 billion.
More than half the managers in this annual survey predicted that the dollar would be replaced by a portfolio of currencies within the next 25 years. This is in contrast to the previous years when they said the dollar would retain its status.
This is hardly surprising when you consider the concerns over the US government’s inability to rein in spending and the Federal Reserve’s huge expansion of its balance sheet.
If you recall this is exactly what Robert Zoellick, president of the World Bank, proposed last year; a new monetary system involving a number of major global currencies, including the dollar, euro, yen, pound and Chinese renminbi.
The part that we remember best about Zoellick’s proposal was his statement that the system should also make use of gold.
The reserve managers polled by UBS poll also point to a growing role for gold, with 6 per cent saying the biggest change in their reserves over the next decade would be the addition of more gold. None indicated an intention to sell gold in the next decade.
In fact, central banks have bought about 151 tons of gold so far this year, led by Russia and Mexico, according to the World Gold Council, and are on track to make even larger purchases of bullion. The reserve managers were enthusiastic about gold and predicted it would be the best performing asset class over the next year, citing sovereign defaults as the chief risk to the global economy.
So, being at the half-way point of the year, what is the prognosis for precious metals?
Believe it or not, despite rising food prices, riots, inflation, conflict between North and South Korea, U.S. stimulus, devastation in Japan and high unemployment, there are some gold bears out there.
Jon Nadler, senior analyst at Kitco.com, has been warning of a fast exit by traders and hedge funds, which could pummel the gold price before the end of 2011. He thinks gold could slip to $1,150 an ounce. Then again, Mr. Nadler is known for being bearish on gold many times when it rallied…
Goldman Sachs, in a recent research note, said that gold could rally to $1,480 an ounce through June but that once the U.S. economy improves and the Fed raises interest rates, gold prices will top out with a peak in prices in 2012.
Jim Rogers is still standing firmly behind his long term $2,000 gold price prediction.
Morgan Stanley (MS) has a 2011 gold price target of $1,512 an ounce while JPMorgan Chase (JPM) will now accept gold as collateral. Bank of America Merrill Lynch forecasts gold will top at $1,500 in the near-term.
Gold mining executives have a range of predictions:
- Chuck Jeannes, CEO of Goldcorp (GG) -- $1,500 an ounce is "easily achievable,
- Sean Boyd, CEO of Agnico-Eagle (AEM) -- about $1,600 this year,
- Mark Cutifani, CEO of AngloGold Ashanti (AU) -- between $1,300 and $1,500,
- Aaron Regent, CEO of Barrick Gold (ABX) -- the $1,500 range,
- Rob McEwen, CEO of U.S. Gold (UXG) --gold prices will hit $5,000 an ounce in 4-5 years.
As far as we’re concerned, we view gold above $5,000 and silver being well above $100 (possibly $200) as quite likely in the coming years. Gold may have moved to new nominal highs weeks ago, but it is not even close to the real-inflation adjusted highs of 1980. However, before gold and silver move to these levels there will be many corrections along the way - such as the one we have right now.
The one thing we can safely predict is that the rest of 2011 will be as unpredictable as the first half. We will hope for the best and at the same time be prepared for the worst by tracking the price of gold and silver and making detailed analysis. So, let’s begin this week's technical part with the analysis of the Euro Index. We will start with the long-term chart (charts courtesy by http://stockcharts.com.)
Euro - USD Indices
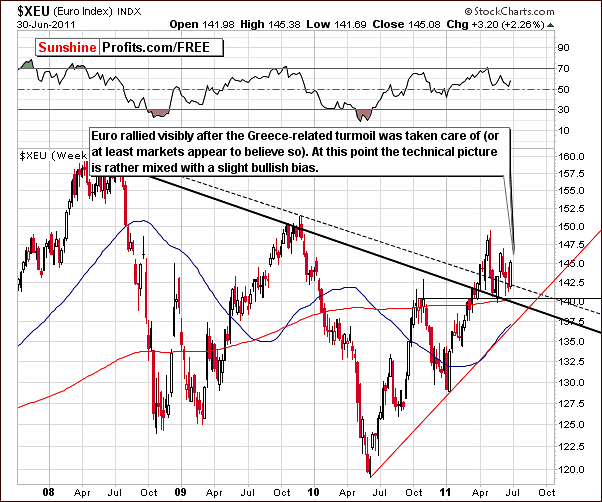
We begin this week with the long-term Euro Index chart. This week, the euro has rallied and this can most likely be attributed to the situation in Greece. The Greek Parliament agreed to cut spending and take a measured approach towards the economy. Investors cheered this news and appear to have bought euros which they had previously sold during a time of uncertainty. Optimism has now increased significantly and the result can be seen with the Euro Index recording more than a 2% gain this week. The medium-term picture is now slightly bullish.
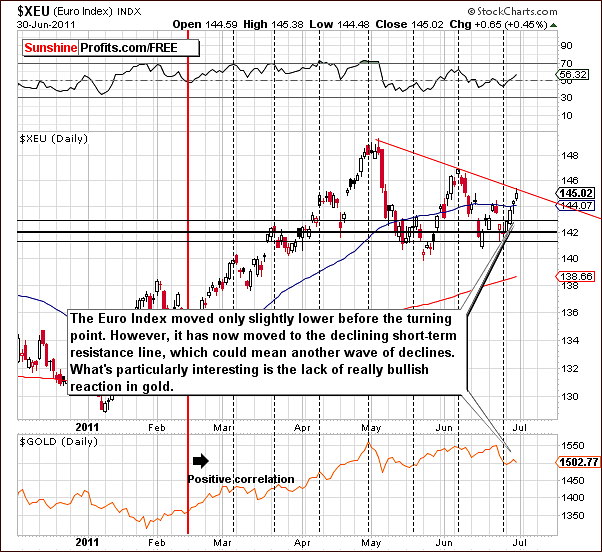
In this week’s short-term Euro Index chart, we still have not seen a breakout above the declining resistance line which is shown in red in our chart. Until such a breakout is seen, the short-term trend remains down. Consequently, this provides a bullish implication for the dollar and bearish sentiment for gold.
The yellow metal had a rather mild reaction this week towards the strength of the euro. In fact, its reaction was so weak that it was rather surprising. Thursday, gold even declined when the euro moved higher. This was seemingly unheard of just a few weeks ago. It is likely that there will be many more changes of this type reflected in this week’s Correlation Matrix.
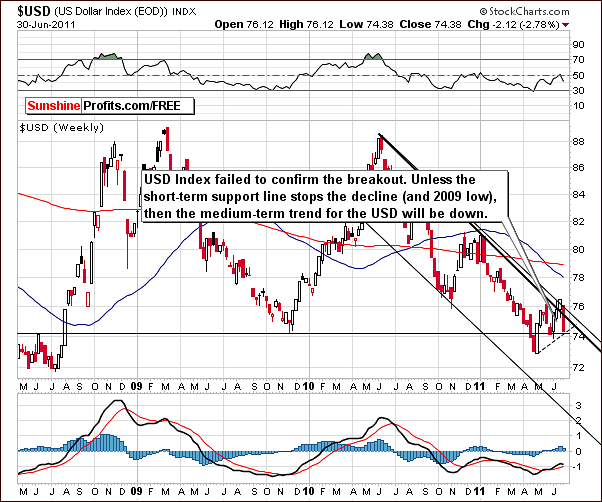
In this week’s long-term USD Index chart, we see that there was still no breakout above the declining medium-term trading channel. Instead, we have seen a move lower after the index touched the upper border, but this decline was stopped by the short-term rising support line and the 2009 lows.
The situation here is mixed, and whichever way the USD Index breaks is likely to determine the next big move for the dollar. The implications for gold are not obvious at this time. The situation for gold, however, is clearer than it is for the currencies at this time.
Summing up, the situation for the Euro Index is more bullish than it has been in previous weeks. The opposite is true for the USD Index. There is little bullish news at this time for gold which simply is not reacting to the euro strength.
General Stock Market
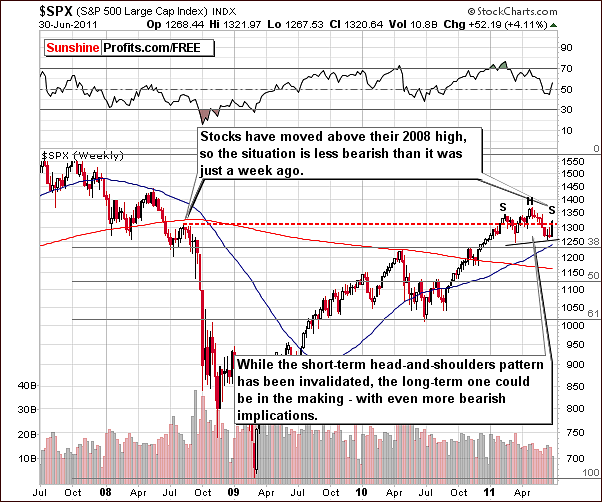
In the long-term general stock market chart this week, we see that a significant move higher has brought the S&P 500 Index above the level of the August 2008 highs. This is a bullish development. We may however, be seeing the beginning of a long-term head-and-shoulders pattern which, if completed, could lead to significantly lower prices for stocks. The S&P 500 Index could move to 1,200 or even lower if this bearish pattern fully develops and is completed. Indications are that this may be in the cards.
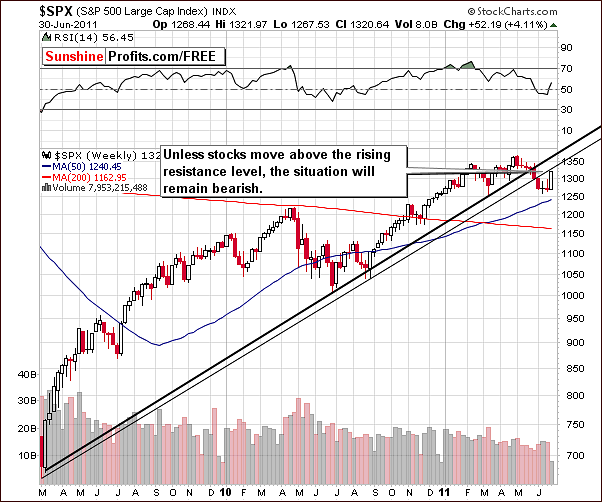
In the medium-term S&P 500 Index chart this week, we have not seen a breakout above the resistance line which previously provided support. We have seen a move towards it but no breakout has been seen. The situation is mixed overall with a slightly bearish bias based on the above chart and the financials which will be discussed next.
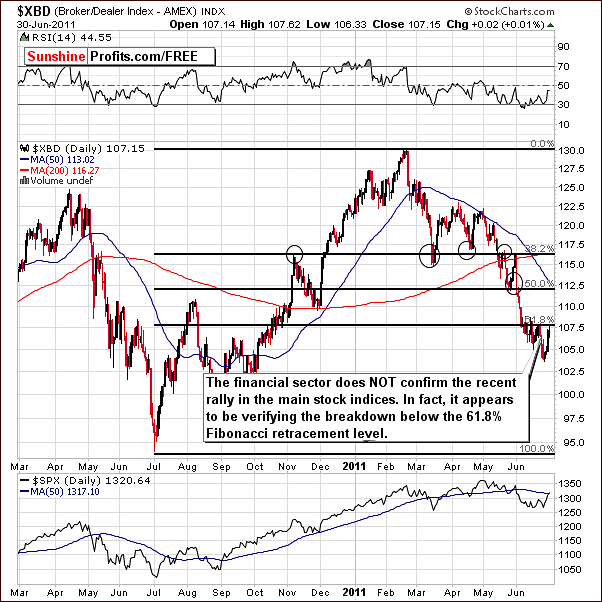
In this week’s XBD Broker-Dealer Index chart, we see that the recent rally stopped at the 61.8% Fibonacci retracement level. This is a sign of significant weakness. Since the financials have normally led stocks (at least in the previous 3 years or so), the recent rally seen in the general stock market could very well be nothing more than an insignificant contra-trend move.
Summing up, the outlook for the general stock market is slightly bearish based on the financials. The rally seen this week could simply be a contra-trend move and should not be taken too seriously at this point. Signals are mixed for stocks overall and the week ahead will likely clarify the direction for the general stock market.
Correlation Matrix
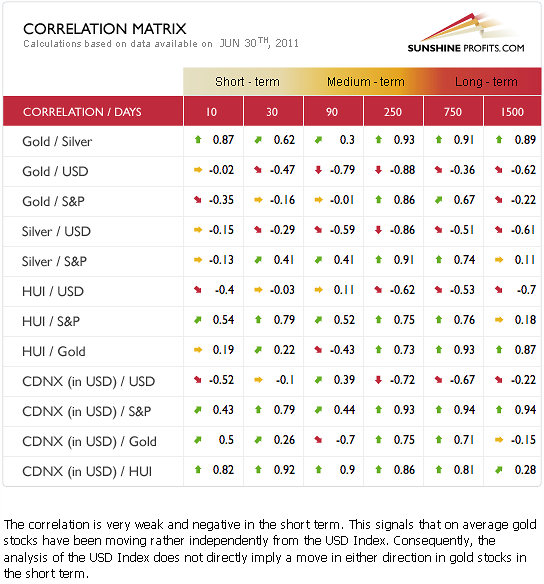
In this week’s Correlation Matrix, we have a number of interesting readings, most of which are generally weak. The most significant coefficient this week is between stocks and gold stocks with 0.54 and 0.79 values in the 10 and 30 day columns respectively.
Gold stocks only rallied slightly although the general stock market moved significantly higher this week. This is a sign of weakness for the precious metals sector and suggests that declines could very well be seen soon. There has been a general weakening in the relationships between precious metals and currencies and stocks. It seems that the precious metals have stopped reacting to the positive influence of the other markets.
Much of this could be due to the situation in Greece. Tensions have decreased greatly with their government accepting a plan to improve their financial situation. Investor optimism has increased while many of their fears have subsided. Stocks and euro have consequently become more appealing this week. Many investors appear to have purchased euros with their dollars and there is less of an appetite for gold and silver. The safe haven of precious metals seems less important as tensions have decreased.
By seeing these developments fundamentally in the numbers and the technical implications from charts, it now appears to be more important to utilize these tools for the precious metals market than to watch for developments in either the currency markets or the general stock market. Having said that, let’s move to the analysis of gold.
Gold
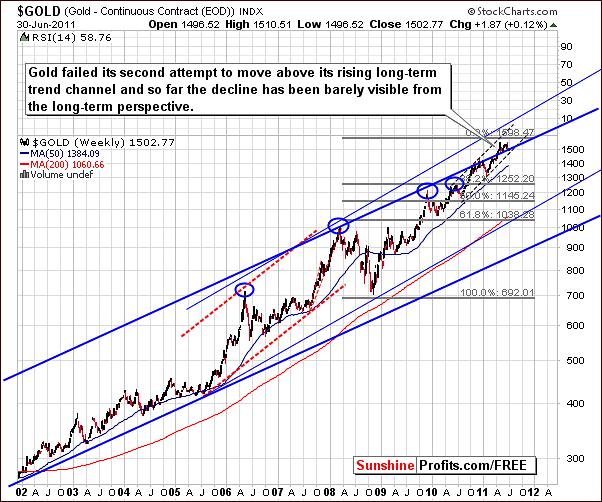
In this week’s very long-term chart for gold, once again we see a failed attempt to move above the rising, long-term trend channel. The situation is similar to what was seen in late 2010 and it appears quite likely that the decline will continue from here.
While a breakout out of the rising trend channel is expected eventually, it does not appear that the time is now for such a move. In all likelihood, a correction will be seen first and at this time it appears that the correction could indeed be significant – which implies that it’s not over yet, as what we’ve seen so far is not yet truly significant from the long-term perspective.
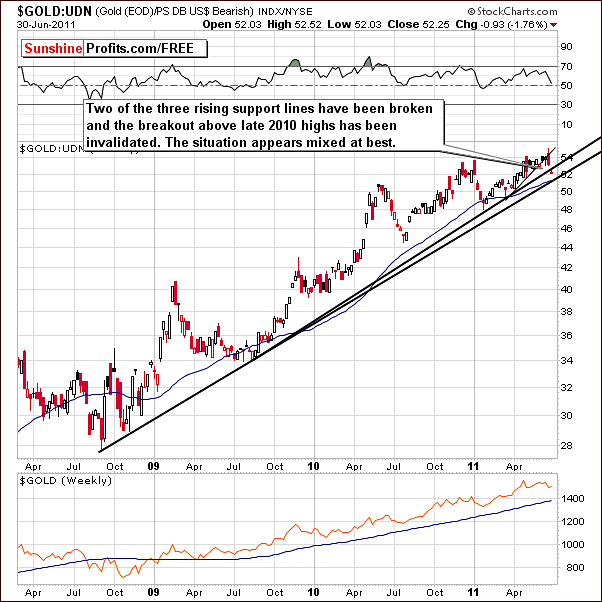
In gold’s long-term chart from a non-USD perspective, the index level has declined below two support lines and the breakout above the highs seen late in 2010 has been invalidated. One rising support line remains below current index levels. It appears likely that any move below this final support line will open the door to additional declines which would quite likely be severe.
The Greece plan which was approved this week appears to have made gold less attractive to European investors and prices have consequently dropped in non-USD terms (most of the USD Index is driven by the EUR:USD currency exchange rate). The technical picture has deteriorated and now can be described as “mixed” at best.
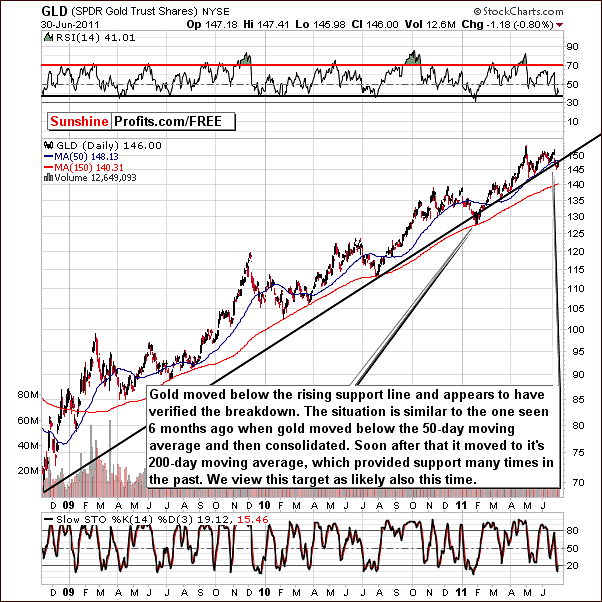
Now we turn to the long-term GLD ETF chart where we can take a look at what has been described in last week’s messages. Notice that gold has moved below the long-term rising support line. When this happened earlier this year, a decline was seen down to the level of the 150-day moving average (marked with red). If this takes place once again, the GLD ETF could move to around the $140 level which corresponds to $1,440 for spot gold.
Gold has seen significant declines twice within the past year after breaking below the 50-day moving average. This was the case in early 2011 and also around the middle of 2010. More examples of these declines can be seen in prior years and it appears that we are now in yet another of these situations with the recent move below the 50-day moving average. Virtually each time when gold moved below the 50-day moving average it bottomed at the 150-day one.
Based on these factors, it seems that the red sloping line in the long-term chart, the 150-day moving average is a likely target level for such a decline. RSI levels have been oversold recently but not to any extreme at this time. This supports the premise that there is room for a move to the downside.
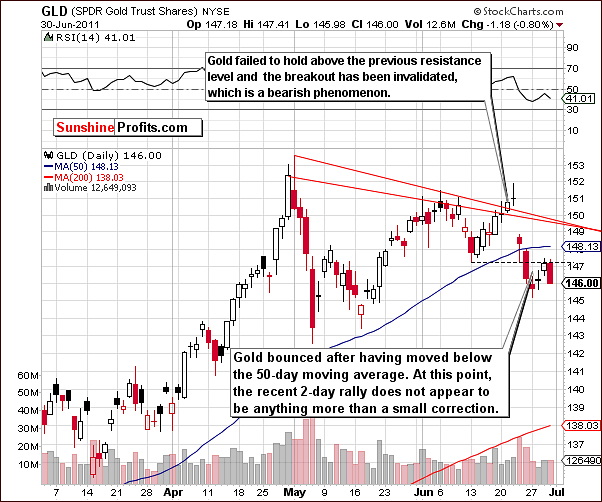
In this week’s short term GLD ETF chart, we see that gold moved higher on Tuesday and Wednesday. On closer inspection, this appears to be quite insignificant. The index level did not move above the level of the June lows and it appears to have been nothing more than a small, contra-trend rally. With the invalidation of the recent breakout and no real signs of strength seen this week, declines are likely to continue.
Summing up, lower prices will probably be seen for gold in the coming weeks. It seems that the events seen this week in Greece have calmed the metals markets somewhat and gold seems to have lost some of its appeal and lower prices have resulted.
Silver
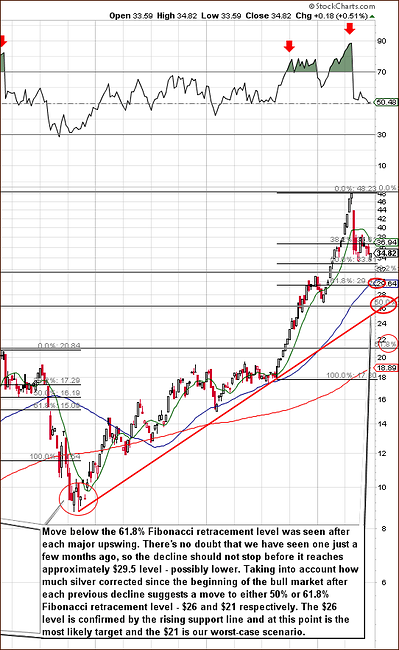
In this week’s very long-term chart for silver (please click the above chart to enlarge), the main point obtained from our analysis is that the decline is likely not over yet. The reason is really quite simple. The decline does not appear to be large enough when compared to those which have followed previous major rallies.
We have indeed seen a major rally recently. In the past, at least 61.8% or more of the previous rally was given back before the final bottom was in (please click on the above chart for details). Our current decline corresponds to barely one-half of the upside amount of the recent rally. We expect the coming declines to bring silver’s price below $30 and very likely below $29.50.
Then again, since the beginning of the bull market, applying these estimated decline percentages would bring silver’s price to $26 or even $21. The reason for this analysis is after previous major rallies price declined either approximately 50% or 61.8% of the whole 2002-major top upswing. Therefore, the most likely scenario appears to be a temporary bottom close to the $30 level and a decline further towards $21 as a worst case scenario with a $26 level more probable for the final bottom.
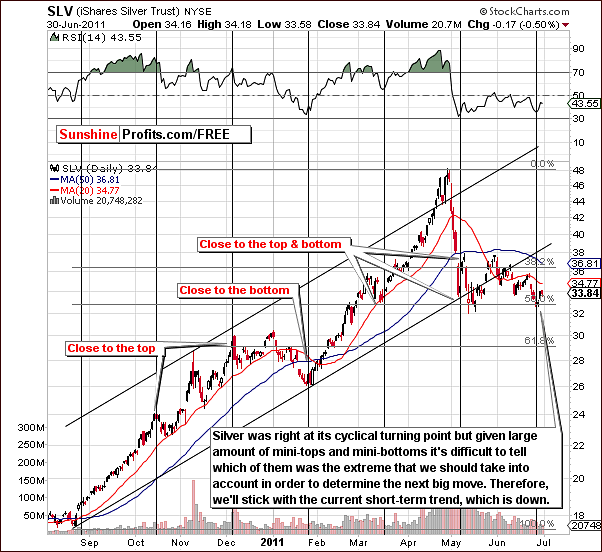
The short-term SLV ETF chart this week provides few new details. We have seen generally sideways movement with numerous tops and bottoms. One note of interest however, is that silver reached an important support line, that being a 50% retracement of the previous rally. It was also right at a cyclical turning point.
The rally which followed was very insignificant given this bullish combination and definitely not a show of strength. This is especially true when considering that stocks had rallied at the same time in a much bigger way. It truly appears to be a sign of weakness for the white metal.
Summing up, the short-term trend remains down for silver. This is very similar to what was discussed earlier concerning gold. It appears that tough times are ahead for the precious metals themselves.
Gold and Silver Mining Stocks
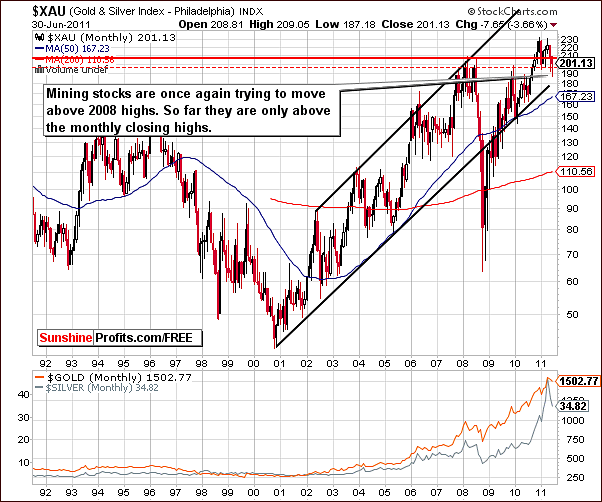
In the very long-term XAU gold and silver mining stocks index chart this week, the battle continues to regain the level of the 2008 highs. The index has moved back and forth between the support level of the monthly closing highs and the resistance of the intra-day highs. No decisive move has yet been seen here.
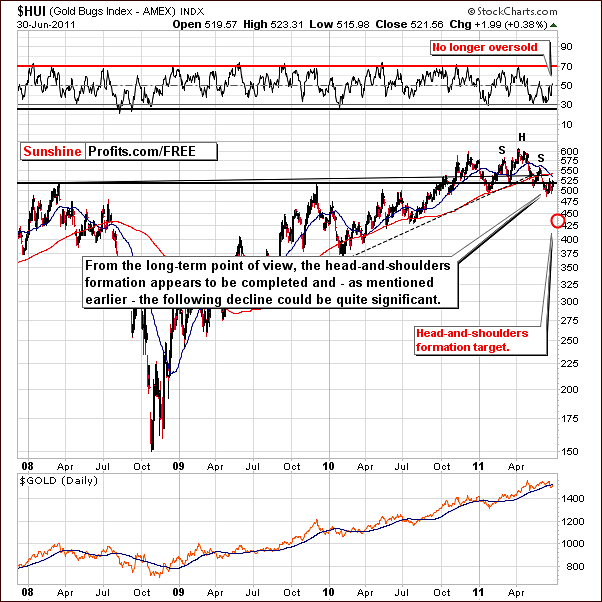
In this week’s HUI Index chart, we no longer see an oversold situation in terms of RSI levels as they are now in the middle of the trading range. The head-and-shoulders pattern is intact and currently being verified. Finally, our previously stated downside target level of 450 for the HUI Index remains valid at this time.
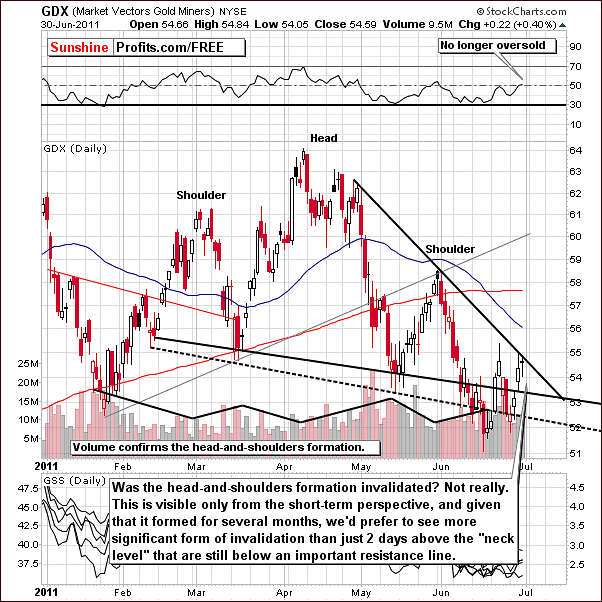
In this week’s short-term GDX ETF chart, the head-and-shoulders pattern which is very visible from a long-term perspective appears to be invalidated as seen here in our short-term chart. The formation is a medium-term phenomenon and medium-term charts are therefore a bit clearer and more important.
We see what appears to be an invalidation of the pattern with index levels moving above the neck level. However, since this was only for two days and the rally stopped at the resistance line, the formation is still intact. This is confirmed further by volume levels when the pattern was forming and by three consecutive closes below the neck level in mid-June.
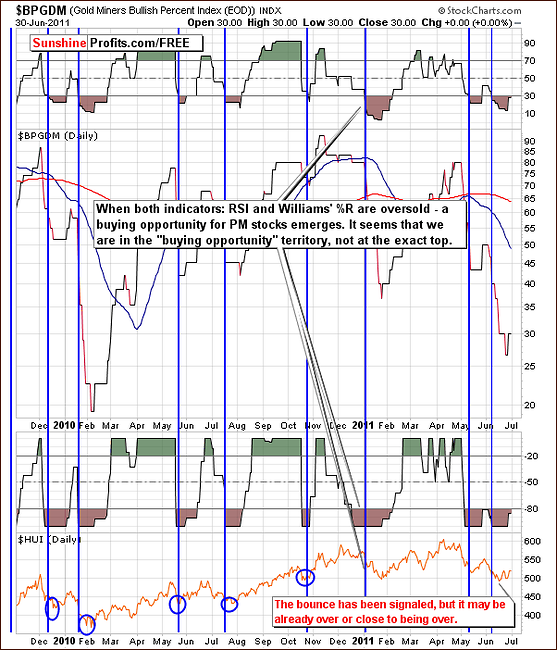
Our final mining chart is the Gold Miners’ Bullish Percent Index. In response to a Subscriber’s question, we will discuss whether a buy signal is being seen here at this time. The suggestion was made that this is the case since the index level has dropped below 30. Our view however, is that this index does not give a very important buy signal in and of itself.
In the past, specifically in late 2008, the signal given here was at a time when stocks, precious metals and the general stock market were all in decline. It has not been very useful in other cases and its reliability is unclear. We prefer to use the RSI level and the Williams’ %R indicator in conjunction and when both are oversold, a buying opportunity appears to be close at hand. It does not however, tell how big the rally is going to be and it may in fact have already come and gone at this time.
We have indeed seen a buying opportunity signal from this chart in the first half of June, but it seems that the rally has already taken place. Consequently, we don’t view this chart as having overly bullish implications for the following weeks especially that gold is verifying a breakdown below its very long-term support line.
Summing up, the situation is in the mining stocks remains bearish in the medium-term. The general stock market has moved significantly higher in recent days and miners moved just a little higher – this action indicates weakness in gold and silver mining stocks.
Sunshine Profits Indicators
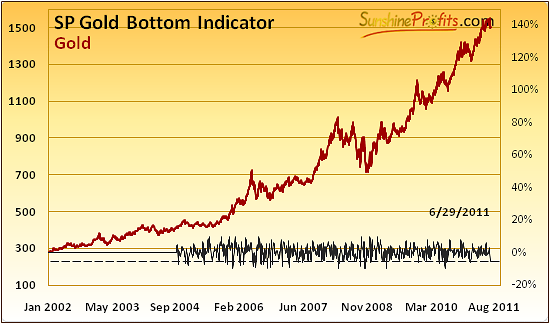
The SP Gold Bottom Indicator has just flashed a long-term buy signal. This indicates that gold is not at an exact top and that being completely out of the precious metals market is not the best idea. However, we don’t view this as invalidation of points made earlier and we don’t think it makes the temporary decline in gold less probable.
The reason for the above skepticism is the fact that this indicator has been particularly reliable in situations that are not similar to the one we have today. In case of the similar situations, signals were quite imprecise. Here’s when we’ve seen previous long-term buy signals from the above indicator:
- 1/24/2011 - close to the bottom, right before it was seen – situation not too similar to the one we have today as price was far from 50-day moving average and very close to the 150-day one,
- 7/6/2010 - after the first part of the decline, followed by a similar decline. This situation is very similar to the one we have now – the signal was preceded by a move below the 50-day moving average,
- 5/21/2010 – important local bottom, but not the final one – not too similar to today’s situation, as price was above the 50-day moving average and it was right a spike high,
- 12/9/2009 - middle of the first part of the decline – similar situation, gold was close to its 50-day moving average,
Applying the analogous methodology to another set of our indicators provides us with similar outcome.
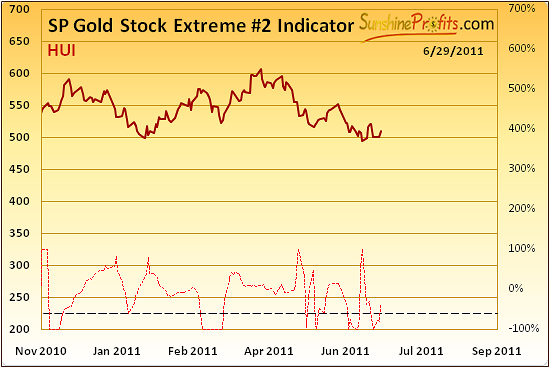
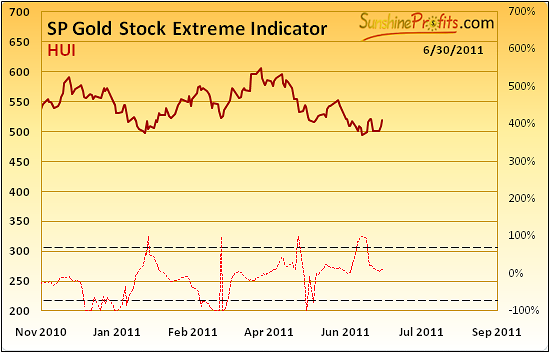
The SP Gold Stock Extreme #2, which is less accurate than our #1 indicator flashed two extreme signals in the recent past. Please note that at the same time the #1 did not flash a signal recently. When was a similar situation seen? In late 2010, and this was seen right at the top.
Consequently, it does not appear to be a time to buy into the market. The situation is still quite bearish and taking the above indicators into account does not contradict the outlook for lower gold prices.
Juniors
As stated in the Key Principles section, the list of top juniors will be updated approximately every 4 weeks, so this is the Update that should contain the revised version of the list.
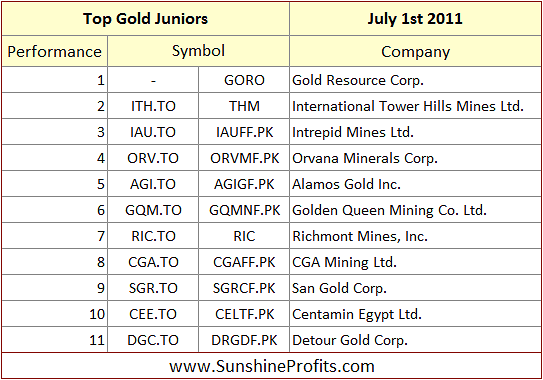
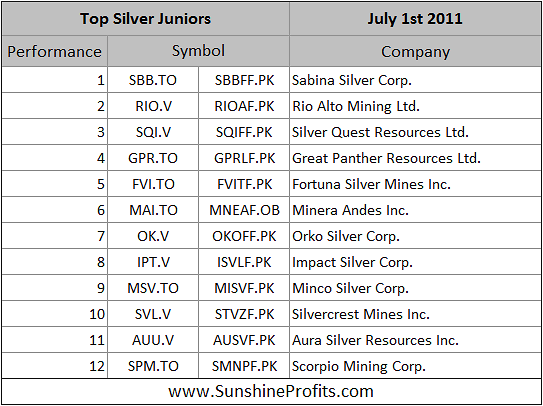
Generally, there was no significant changes as far as our preference regarding juniors are concerned, so it seems that one would not have to change their junior portfolio based on this month’s ranking. Please note that we have not been favoring junior over senior since a few months now as juniors move on average very similarly to big senior stocks, so we don’t view taking additional junior-related risk as justified.
It will be interesting to see how these and other juniors hold during the coming decline in the precious metals sector – this will allow us to estimate the true strength of each company.
Letters from Subscribers
One of our Subscribers asked about our definitions of risk-tolerance and risk-aversion as they are not in tune with the general definition. As a reminder - the classic definition assumes that being invested in the market means risk and being in cash is not risky.
Actually, we intentionally reversed the classic definition. In our opinion the risk with long-term precious metals investments is to be out of the market. What you see in Investopedia and other similar sources is a general definition, which assumes that cash is the no-risk asset, however in the current market environment; we believe that this should refer to the precious metals. Which of the two proved to be better store of value and therefore less risky throughout centuries: gold and silver or paper money? The obvious answer is precious metals.
Additional explanation was featured in the Dec 30th, 2010 Premium Update:
Long-term Investors generally want to keep their holdings invested in a given asset class until the final top is reached (hundreds or much more likely thousands of dollars away). However, given the fact that gold and silver may plunge fast (the big 2008 downswing), these Investors would also prefer to stay out of the market with at least a part of their holdings during the most unfavorable conditions. Consequently, they want to stay out of the market only when the risk of a sell-off is very big, and ride out the smaller / less probable declines. For long-term Investors, the risk is to be out of the market, because the consequences of being totally out of the market are too significant - missing a $200 move to save $10 on an entry point simply isn't worth it.
Let's move to the second question, which we view as very important. Here is the message we've received from one of our Subscribers (thank you!):
Thank you for your latest message. Regarding the seasonality issue which you touch on - this is the period when stocks are supposed to go "on sale". This engenders in me the mentality of waiting for the January Sales before buying Xmas presents. Seriously, I find it difficult to decide how to play this. I'm told that late June, July and August are the weakest periods for PM stocks and therefore the best time to buy them. But when precisely?
You obviously know that a mini-rally is taking place, indeed, you and your indicators predicted it. You also seem to be saying that the rally is taking place from a local bottom and that it has no real "legs" Obviously this implies that PM stocks have further to fall in July/Aug. Do you think this is the most likely scenario? The problem is, I have been advised to take positions in chosen stocks in 3 tranches - starting at a 20% position, then adding 20% on the next pullback, and the final 60% on yet another pullback! I'm not sure that is the best way - you can wait an awful long time for a pullback to occur!
Anyway, to sum up - some of these stocks have, or had, been decimated. If I operated the tranche buying system, do you still think it would be ill-advised to go into the PM markets now? Your opinion would be appreciated - I'm aware you are not permitted to advise - but an objective view of the situation would help me a lot.
Based on the analysis of the true seasonal patterns it seems that the bottom could be seen in mid-August (and we currently view it as the most likely scenario), however there are many other factors that need to be considered here.
As far as "how to play this" question is concerned - it depends on what part of your capital you mean. With long-term capital the risk is to be out of the precious metals market, and even though we see precious metals moving lower over the summer, we still didn't suggest getting completely out of the market at this time. Therefore, if you're currently trying to time the market with your whole portfolio, in our opinion it would be a better option to get in with 1/3 - 2/3 of it (2/3 if you're risk averse).
While we don't have enough information to advise for or against the tranche system for your particular portfolio, it seems that if you want to follow it and take the above suggestion into account, you may want to make the first purchase right away, then the second one at a local bottom (when we suggest getting closing the short bet / opening a speculative long position) and enter with the final tranche at the final bottom of the decline (probably in mid-August) - or when we suggest getting back in the market with one's long-term capital.
Summary
This week’s events in the world’s markets appear to have been greatly influenced by the developments in Greece. When the Greek Parliament accepted the savings plan, the appetite for the euro and for stocks increased. At the same time global tensions decreased and this lessened the demand for the dollar, for gold, and for silver.
Having seen a small rally early this week in gold and silver prices, it now appears to have been insignificant and nothing more than a pause within the decline. Analysis of previous declines indicates that more is to come here and the final bottoms are still ahead of us.
Our previous suggestion, that investors should be out of the market with half (between 1/3 and 2/3 in most cases) of long-term capital and using only small part of speculative amounts to short the market, still appears to be justified at this time.
Our next Premium Update is scheduled for Friday, July 8, 2011.
This completes this week's Premium Update.
Thank you for using the Premium Service. Happy Fourth of July weekend!
Sincerely,
Przemyslaw Radomski

