After an election in which the nation essentially ratified the status quo, gold rallied to a two week high then lost traction on Wednesday, with the dollar being seen by investors as a safe-haven. The Republicans lost an election that, given the state of the economy, they should have won easily. A country with nearly 8 percent unemployment preferred to give Obama a second chance rather than Mitt Romney a first one. America remains a divided nation with almost equal numbers on both sides, which means that Obama can hardly claim a mandate based on the popular vote.
All this may not be great for America, but may be very promising for gold investors.
Obama called for healing and cooperation on key issues such as the deficit, tax reform and immigration, but that might be a tall order given a Democrat-controlled Senate and a Republican-run House. In October 2010, Senator Mitch McConnell, the Republican leader, famously said, "The single most important thing we want to achieve is for President Obama to be a one-term president."
With a divided, gridlocked Congress, there is no indication that the intransigence Obama faced from the opposition party will diminish. A Congress split between the two parties will likely result in a showdown over the "fiscal cliff" — nearly $600 billion worth of spending cuts and tax increases that risk pushing the economy into deep recession. On Wall Street, a post-election sell-off gained momentum with the Dow Jones industrial average falling below 13,000 for the first time since September. Many corporate CEOs had viewed Romney as the more business-friendly candidate.
Less than two months remain before the fiscal cliff which is when big tax increases and draconian spending cuts kick in on Jan. 1, throwing a damper on the world's New Year's Eve party. This will happen unless Obama and Congress manage to craft a budget deal. With Congress scheduled to return to Washington next week for a post-election legislative session, policymakers will have just 49 days to reach consensus. Good luck.
During the last fiscal showdown in Washington in the summer of 2011 over the debt ceiling, world stock markets plunged, gold surged to record highs above $1900 per ounce and the S&P ratings agency downgraded the U.S. government's AAA rating.
Let's see if we can guess what's going to happen: until the very last minute everyone will be fighting over the deal and then the consensus will be reached that will mean more money being created. Our initial thought is that precious metals will rally among the uncertainty regarding the fiscal cliff and then they will correct (say 38.2% of the rally will be seen by that time) on the news that more money will indeed be provided for free (i.e. taken by inflationary force from the current USD holders). In other words, it could very well be the buy the rumor, sell the fact type of reaction – just like what we saw after the open-ended QE was announced.
Bullion advanced 10 percent this year and is set for a 12th annual gain after central banks took steps to stimulate economies hurt by Europe's debt crisis. The Fed said Oct 24 it will maintain $40 billion in monthly purchases of mortgage debt and probably hold interest rates near zero until mid-2015.
Obama's victory ensures a continuation of easy money policy with Bernanke at the helm. This could mean four more years of fiscal gridlock, four more years of trillion-dollar federal deficits, and four more years of accommodative Fed monetary policies. It can only mean good things for the price of gold, silver and the rest of the precious metals sector.
We can also expect that the Affordable Care Act will go into effect, more or less on schedule, ensuring that nearly every American has health insurance. The Dodd-Frank financial reforms will continue to be hammered out putting some controls on banks. It is likely that whatever deficit-reduction deal is reached will include tax increases on richer Americans and defense cuts.
Obama has threatened to veto legislation to avert the cliff. Perhaps there is an advantage for the Democrats in going over the cliff. Once the Bush tax cuts have expired on January 1, Democrats would be free to draft their own plan to cut taxes for the middle class, but not the wealthy.
We have written previously that another Obama term would be good for gold. We are not alone in thinking that. In its latest Precious Metals Daily note, UBS writes that an Obama win is the best case scenario for gold both from a monetary and fiscal policy standpoint.
"In the case of an Obama re-election, we expect gold initially to rally back to where prices had been consolidating before the October nonfarm payrolls (NFP), so around $1725 before a broader move higher emerges," the bank writes.
According to UBS, the expectation that an Obama win would translate into a continuation of a divided government, "implies that a resolution on the fiscal cliff and the country's debt ceiling are likely going to take some time, with much political wrangling. The uncertainty surrounding negotiations arising from the political gridlock should have a positive impact on gold." Actually, this is in tune with our above-mentioned guess about the following months.
HSBC fixed income analyst expects that Obama's re-election will mean lower interest rates. "Lower interest rates historically have helped gold prices and higher rates have been gold-negative.
The analysts at Deutsche Bank call for gold to go past $2,200 an ounce next year due to excessive money printing.
The Deutsche Bankers wrote: "While we have targeted gold prices moving above $2,000/oz. since the beginning of 2011, we believe the Fed's open-ended program of QE announced last month increases our confidence that a surge in the gold price above this level is only a matter of time." We agree.
Credit Suisse say gold will go up 7% to $1,840 in 2013 and HSBC raised the gold price outlook for 2013 to $1,850. We believe that both of these levels will be surpassed in 2013.
To take a look at gold's performance for the upcoming short term, let's start this week's technical portion with the US Dollar Index (charts courtesy by http://stockcharts.com.)
USD Index
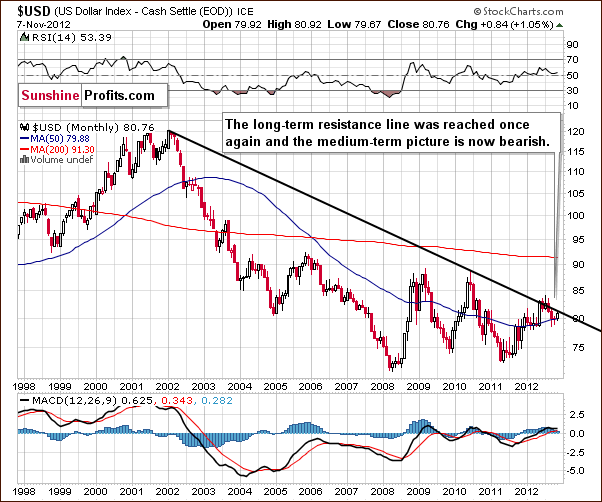
As it is often the case, we begin this week with a look at the very long-term chart. We see that the Index moved to the declining resistance line once again. Since this line was reached, the upside direction of the Index will likely change and a move to the downside is probable.
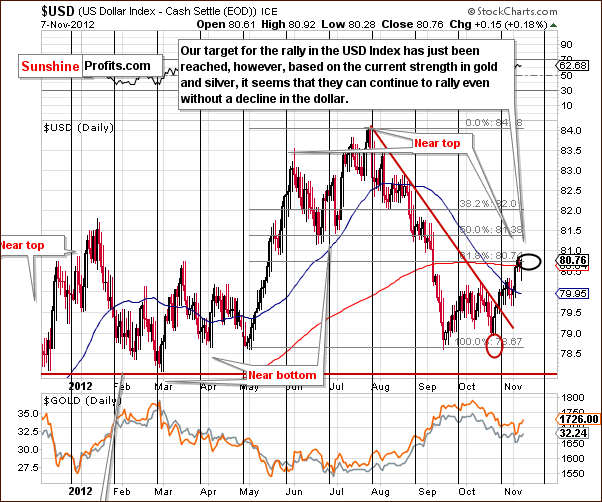
Turning now to the short-term USD Index chart, we see a further confirmation of probable moves to the downside. Our target area has been reached and the index has corrected to the first Fibonacci retracement level. This means that 38.2% of the preceding decline has been corrected, and the Index will likely move lower once again.
The most important implication from this chart is not what will happen to the dollar but rather the relationship with gold and silver. The precious metals rallied this week even without a decline in the USD Index. In fact, the index moved a bit higher this week, but the metals soared strongly. All-in-all, this is a very positive sign for the precious metals sector.
Summing up, the case for the USD Index is now bearish, and the implications for the precious metals are clearly bullish at this time.
General Stock Market
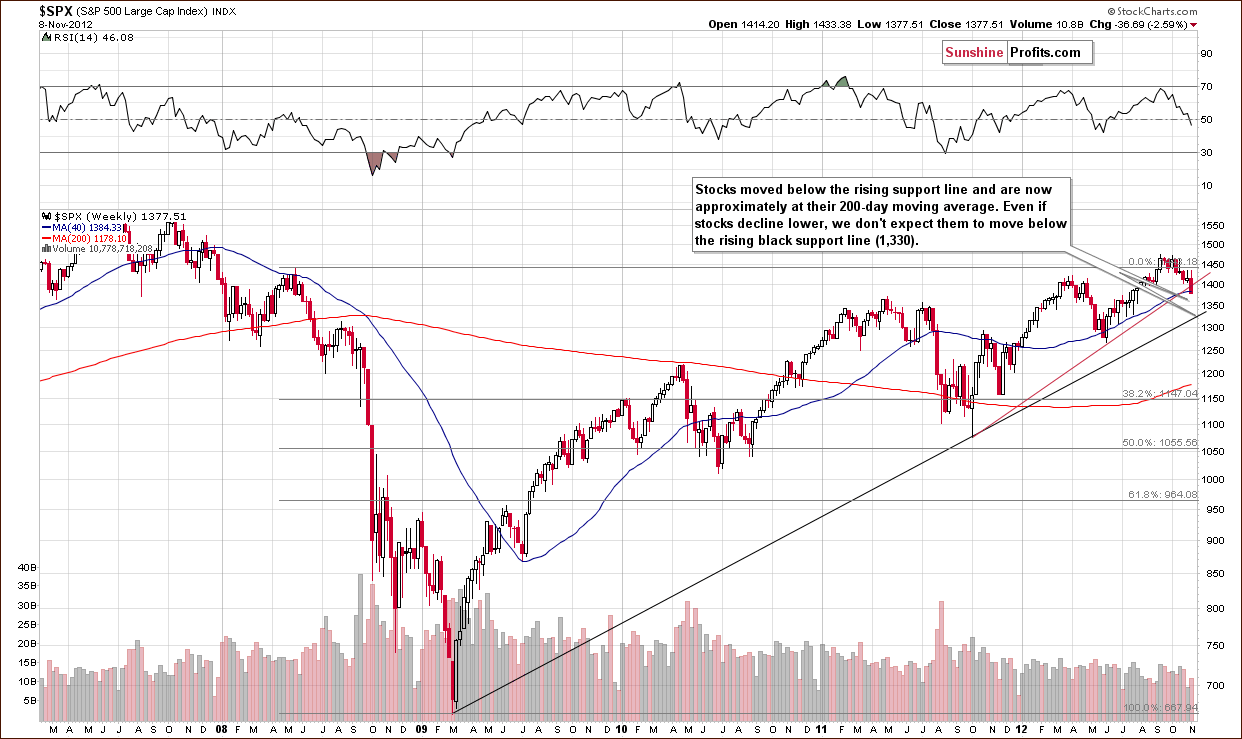
In the long-term S&P 500 Index chart, we see a breakdown in the rising support line. Stocks have closed close to the 200-day or 40-week moving average. This line has stopped rallies and declines several times in the past so it is possible that the local bottom is already in at this time. In any case, not much lower prices are expected with $1,330 being a likely minimum downside target level for the S&P 500.
In addition to this bullish technical picture, the open-ended Quantitative Easing program is also providing a positive influence on stock prices which seem likely to move higher soon and in the months ahead. Even with stocks correcting in recent weeks, the long-term outlook has remained bullish throughout. Please keep in mind that the bullish outlook doesn't really result from a strong outlook on the US economy – it's more of a rally driven by excessive money supply that will most likely drive nominal stock prices higher.
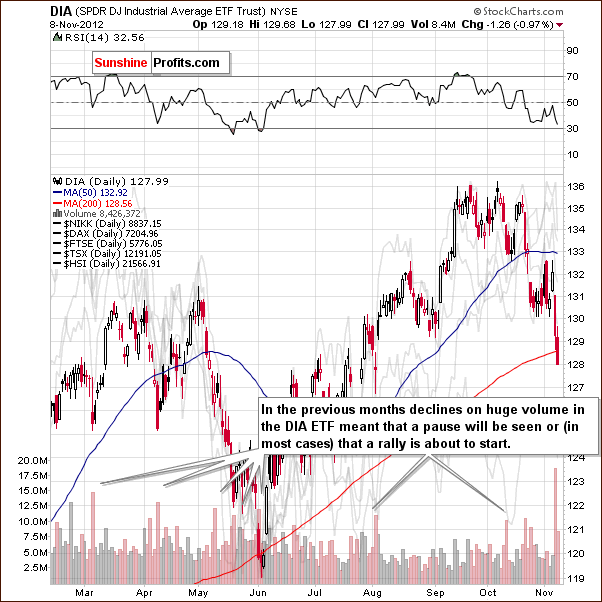
In the short-term DIA ETF (a proxy for the Dow Jones Industrial Average) chart, we saw a huge decline on Wednesday with very high volume levels. In the past, declines such as this have been followed quite soon by a rally or at least a pause in the decline. It seems that a rally from here is more likely, and the breakdown seen from the long-term perspective could be very well invalidated in the following days.
Summing up, the recent moves in stock prices may seem bearish at first glance, but stocks will likely not perform too badly in the weeks ahead. While the economy is far from great, significant dollars have been pumped into the system, and some of these will certainly be invested. The nominal price of stocks will probably move higher because of these factors in the months ahead.
As far as short term is concerned, stocks seem to be forming a local bottom based on the huge volume that was seen after a several-week long decline. Ideally, we would prefer to see some kind of reversal before declaring the outlook as bullish, but the signals coming from the volume alone are bullish on their own as well.
Correlation Matrix
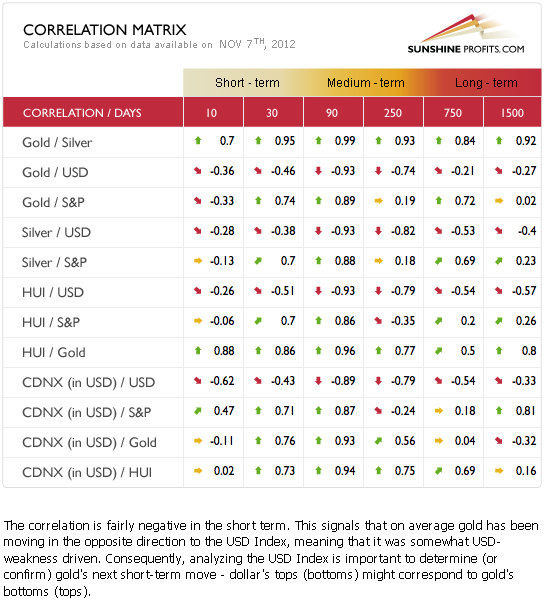
The Correlation Matrix is a tool which we have developed to analyze the impact of the currency markets and the general stock market upon the precious metals sector. We have a very interesting picture this week in the very short-term columns. The correlation between the precious metals and the USD Index changed and is now moderate to moderately weak. What used to be strongly negative is now simply somewhat negative. The reason for this is that gold recently managed to rally without declines in the USD Index and in spite of an actual small rally in the USD Index. This is a positive factor for the precious metals sector, so any implications here are bullish this week.
A slightly negative correlation in the last ten days (the very short term) is seen between the precious metals and the general stock market. This is also a positive sign as stocks declined heavily and the precious metals refused to follow. This is indeed a bullish combination for the weeks ahead.
Gold
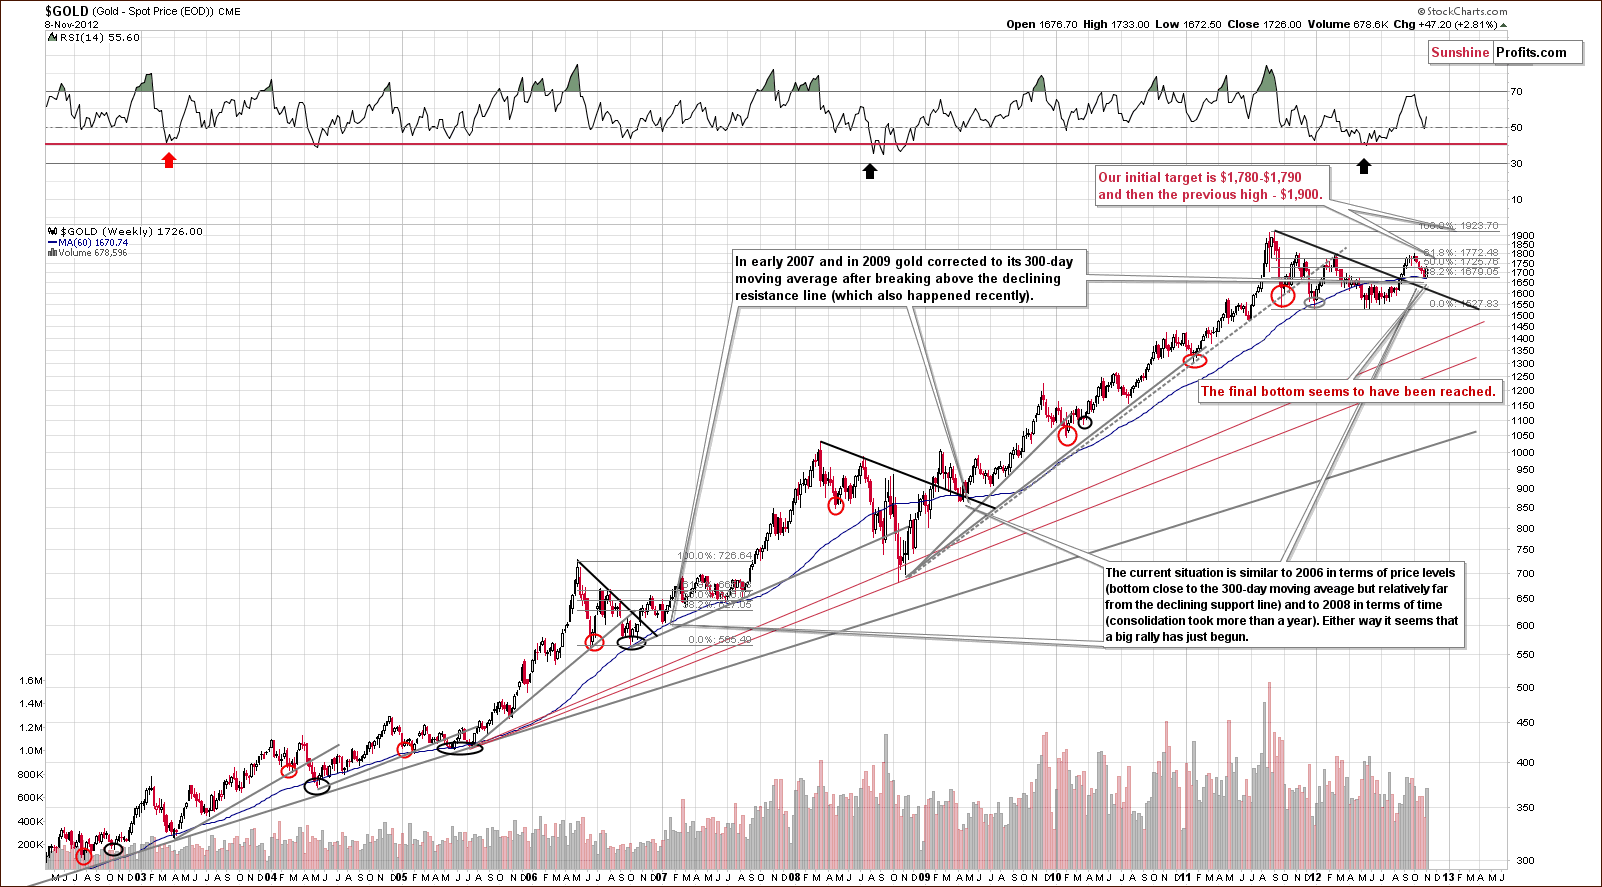
In gold's very long-term chart, we see that a bottom formed right at the 300-day moving average. This has been seen a number of times in the past, and history has clearly repeated here. Many unusual factors have been in play recently, most notably the open ended Quantitative Easing and European debt crisis and the US elections. This is something that is noteworthy especially if you have begun to doubt technical analysis' usefulness in the current macro-economic environment. Still, history has repeated itself, and technical analysis principles are present. It continues to pay off to follow them.
RSI levels are now moving higher and this – combined with their non-extreme readings – suggests higher gold prices in the following weeks. The yellow metal is not making headlines as it was in early October and this is good news for investors waiting to open positions and those who – like us – are already long. There appears to be clear upside potential given that we have been through a period of consolidation greater than one year and have charts which appear to be very bullish right now. Prices appear ready to move higher, consolidate when reaching the early October highs, again rally to previous 2011 highs, and consolidate once again. We then expect to see further strength.
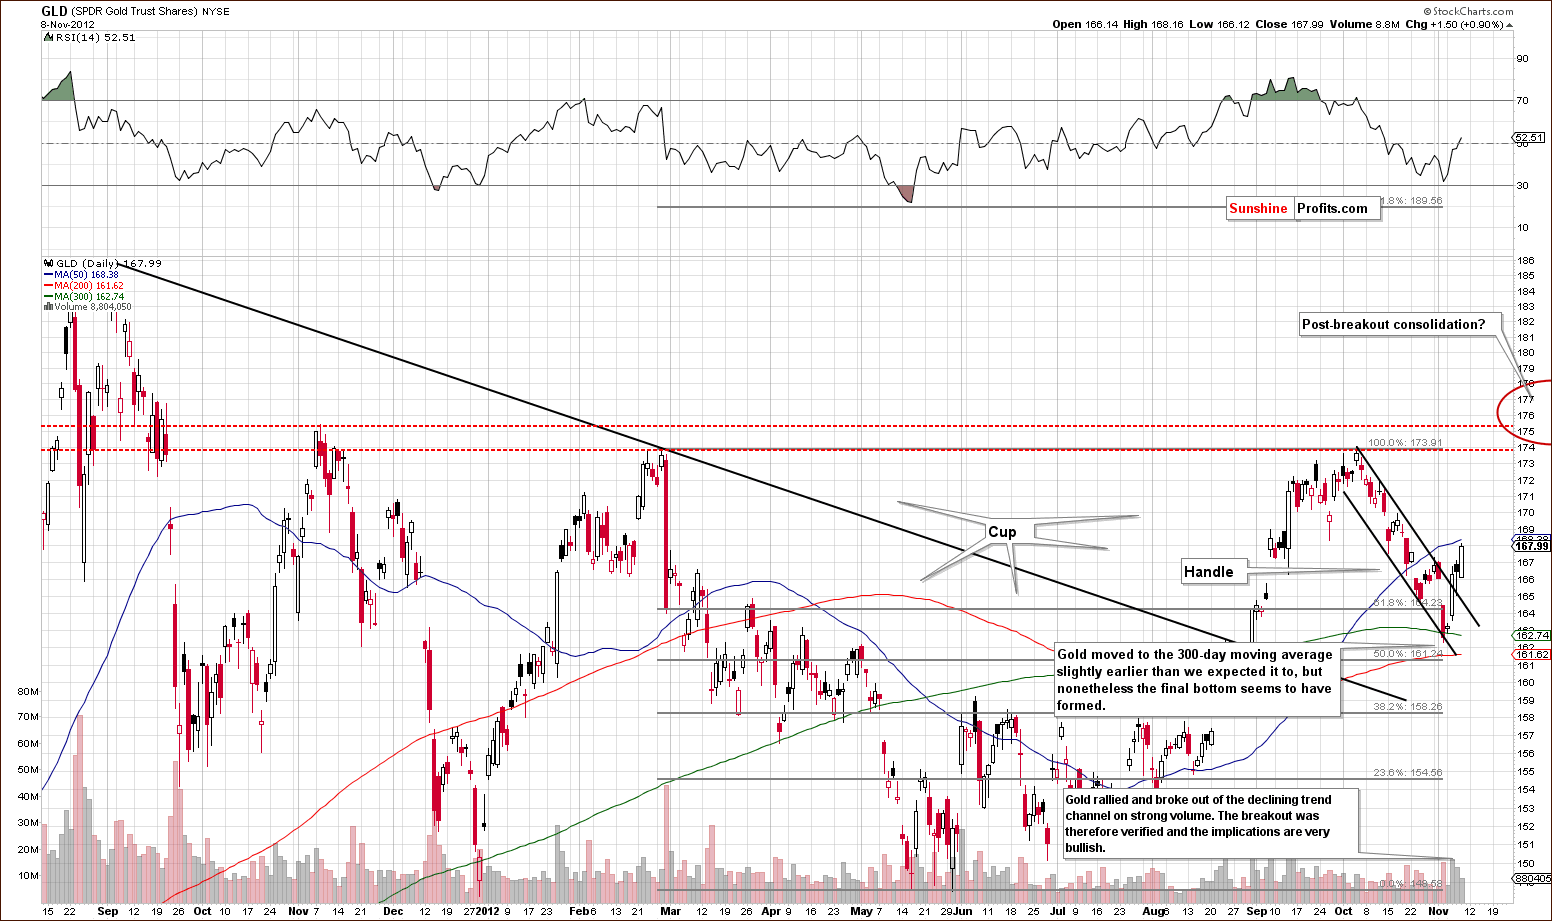
A look at this week's short-term GLD ETF chart shows us that prices have broken out of the declining trend channel to the upside on strong volume. We have seen three consecutive closes above this channel so the breakout is confirmed. The situation looks very favorable for gold investors right now. We expect prices to move above the October highs, consolidate, and move to the 2011 highs next.
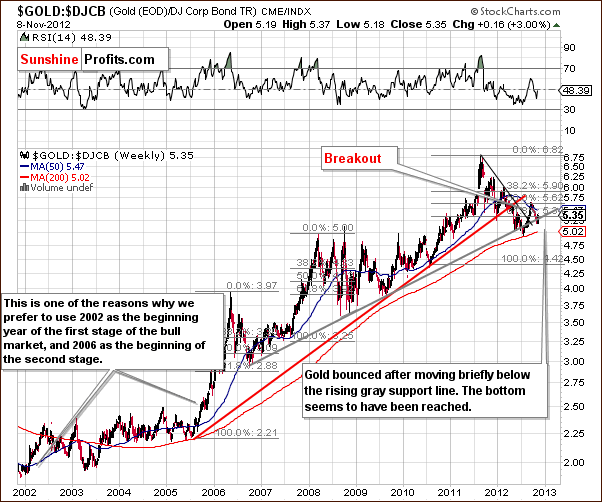
In this week's gold to bonds ratio chart, we see a confirmation of the bullish picture. The breakdown below the rising gray line has been invalidated and the picture here is bullish once again.
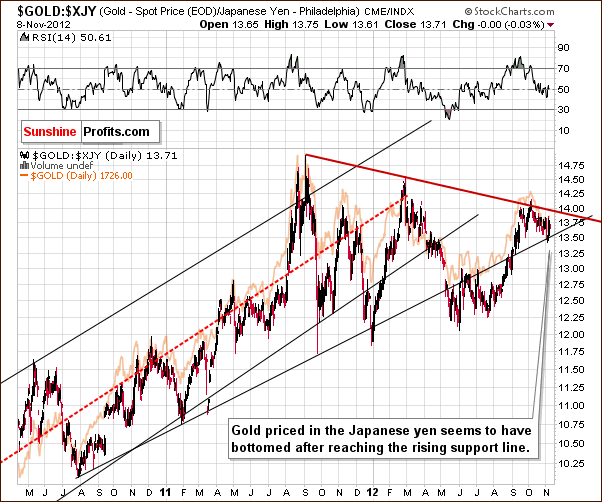
In this week's chart of gold from the Japanese yen perspective, we also have bullish implications. The bottom has probably been formed here as gold reversed after reaching the rising support line. A narrow trading range for this index could be the norm in the coming weeks as there is little room between converging support and resistance lines here. A breakout here (above 14) will indicate further strength in gold.
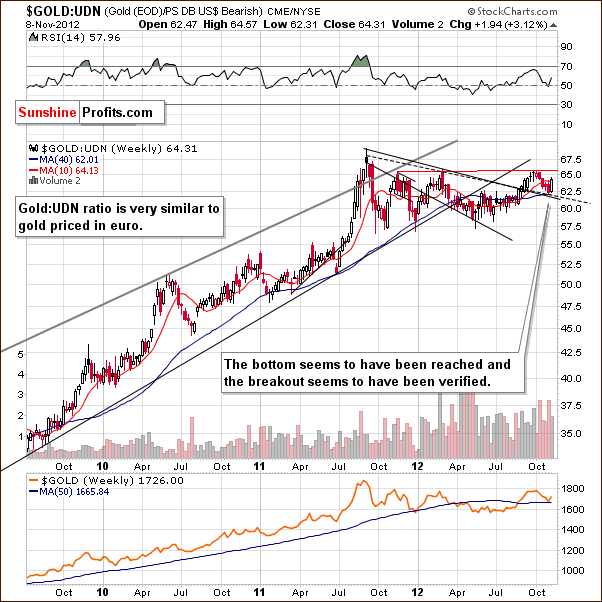
In this week's chart of gold from the non-USD perspective, it appears once again that a bottom has formed with prices close to the 200-day or 40-week moving average. The situation looks quite favorable. This week's rally is huge because gold prices moved higher even with a concurrent small move to the upside in the USD Index.
Summing up, the situation overall for gold is bullish from the short, medium and long-term perspectives. Long investment and speculative positions in gold appear to be well justified at this time.
Silver
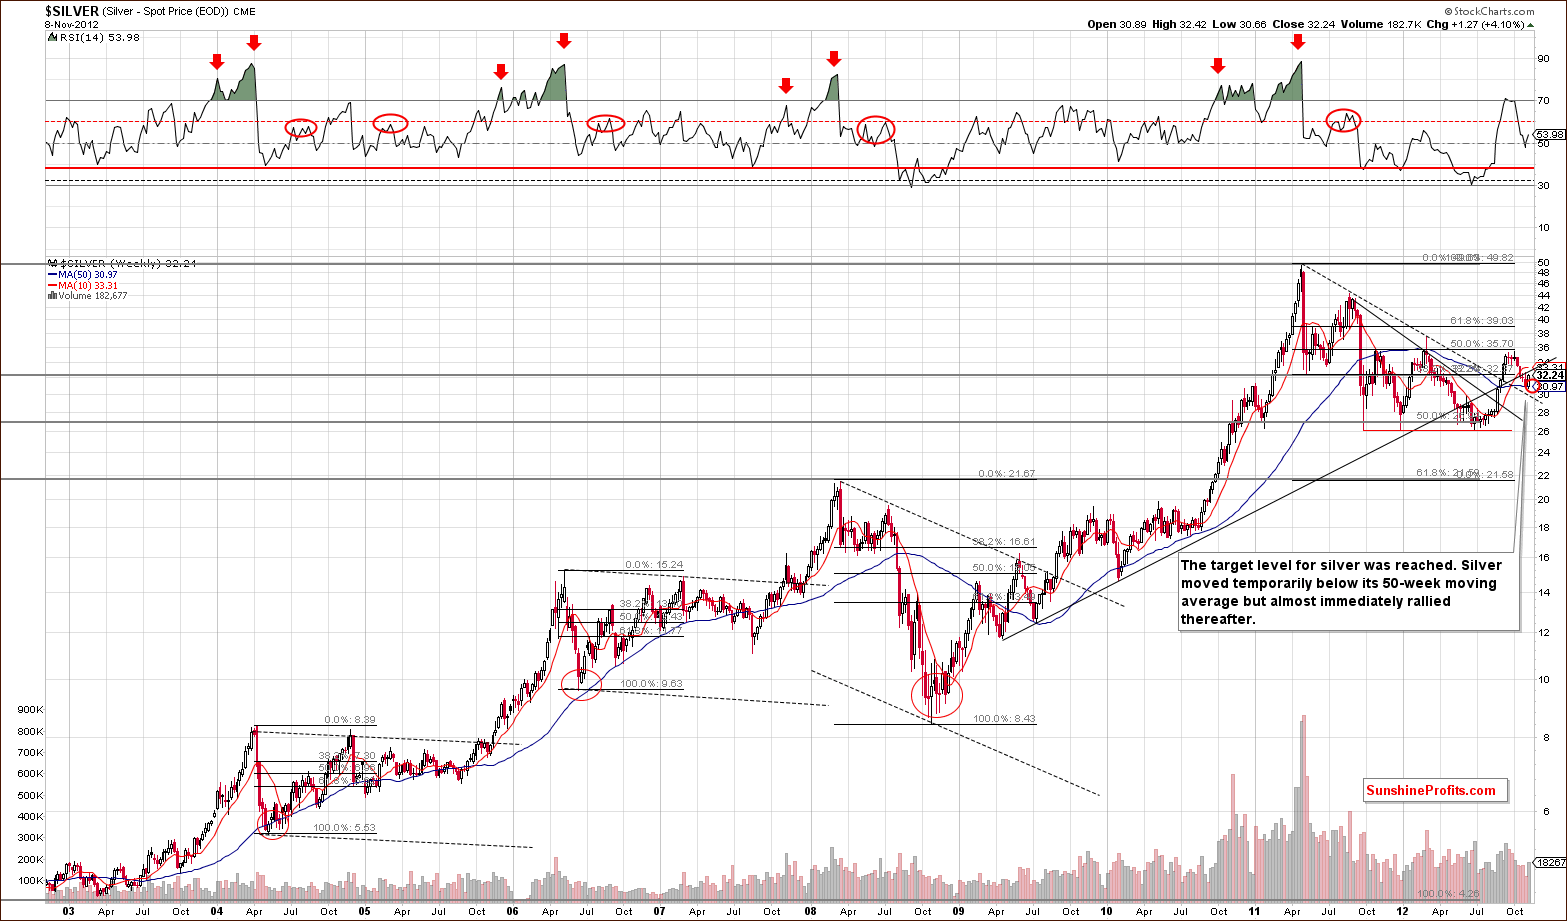
In the very long-term chart for silver this week, we see that a bottom has formed in our target area. Prices will probably now attempt to rise above the rising resistance line. We could see some back and forth price action on Friday or early next week, but silver's price will probably move to its previous October high without significant additional corrections. We then expect silver to consolidate insignificantly and move higher once again.
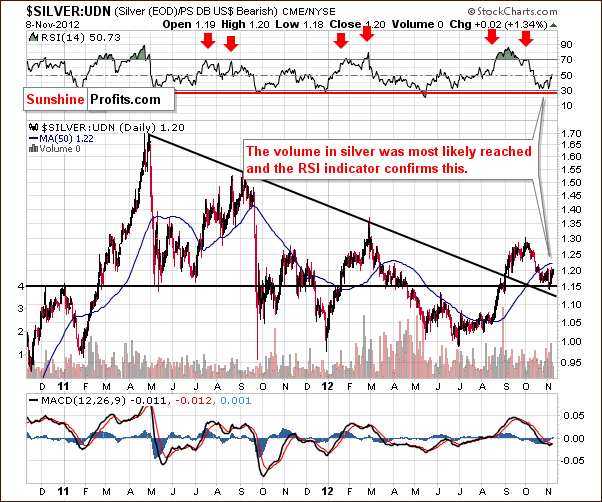
In the chart of silver's price from a non-USD perspective, we see more of the same. The bottom probably formed here when silver moved to the horizontal support line. The RSI was close to 30 and did not move any lower and has since moved above 50. It seems that the bottom is in and the recent uptrend is likely to continue. The breakout above the declining resistance line has been well verified at this time.
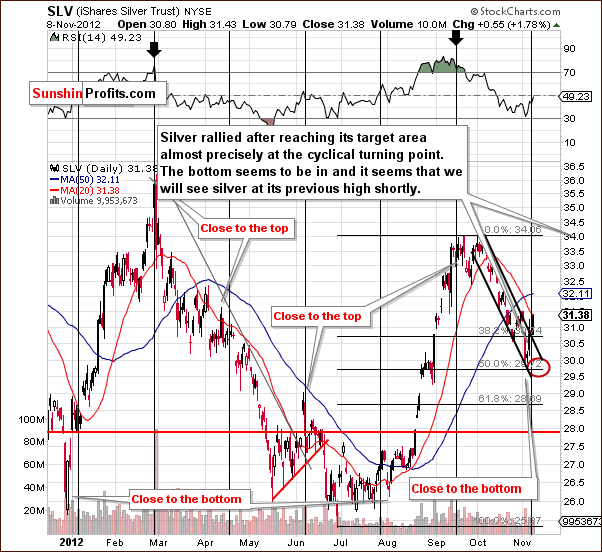
In the short-term SLV ETF chart, our downside target level has been reached somewhat early, and the bottom has formed close to the cyclical turning point. The situation is now bullish once again. It seems that a rally will be seen here – initially, to the $34 level or so.
Summing up, the situation for the white metal is very similar to that for gold, and higher prices are expected for the short, medium and long term. The first stop in the rally will probably be at the October high, which is around $35 for silver and $34 for the SLV ETF. After some consolidation, we then expect the rally to continue.
Platinum & Palladium
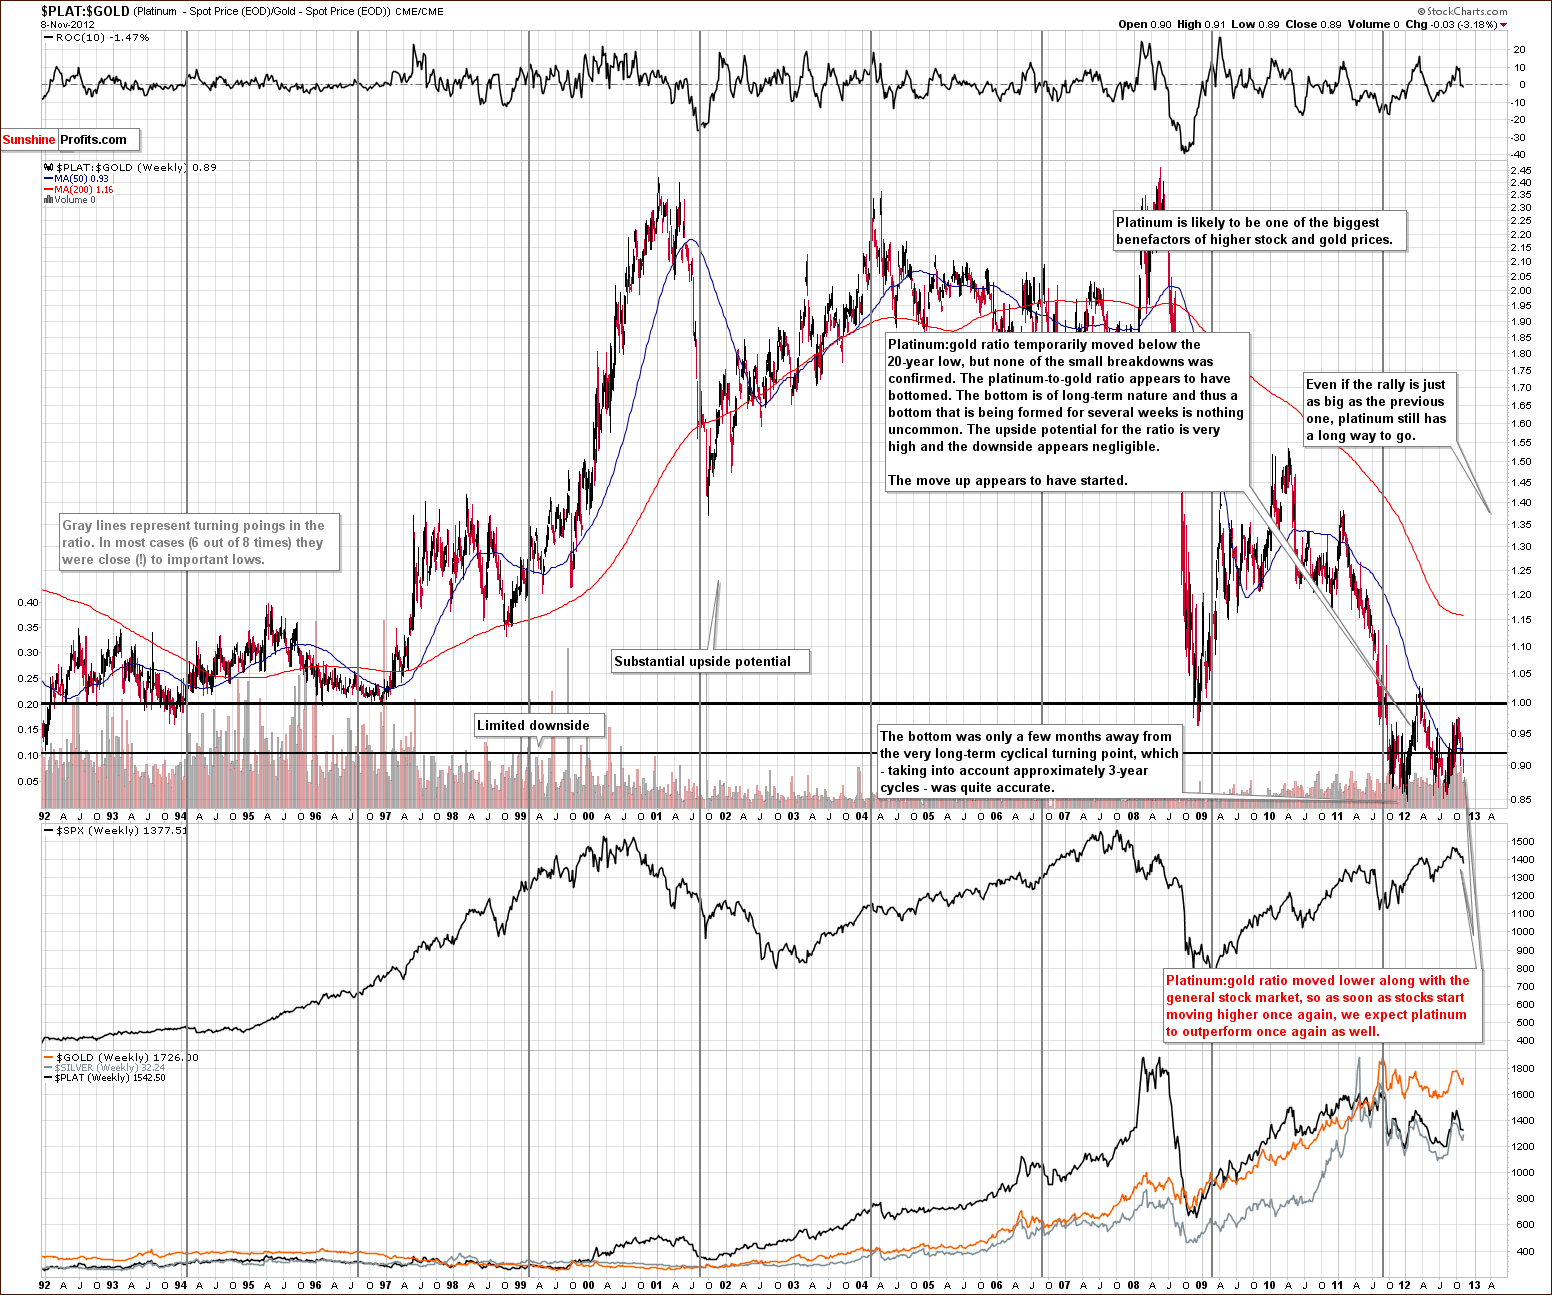
We were asked to comment on platinum's recent price action so we have included the very long-term platinum to gold ratio chart this week. We see that platinum's price did not hold as well as gold recently probably due to the weakness in the general stock market. The ratio has been somewhat correlated to the stock market and once stocks resume their rally, platinum will probably do the same, and the ratio would then move higher as well. It seems that the major bottom in the platinum to gold ratio was reached at the beginning of this year, close to the cyclical turning point. We continue to expect platinum to outperform gold in the months ahead.
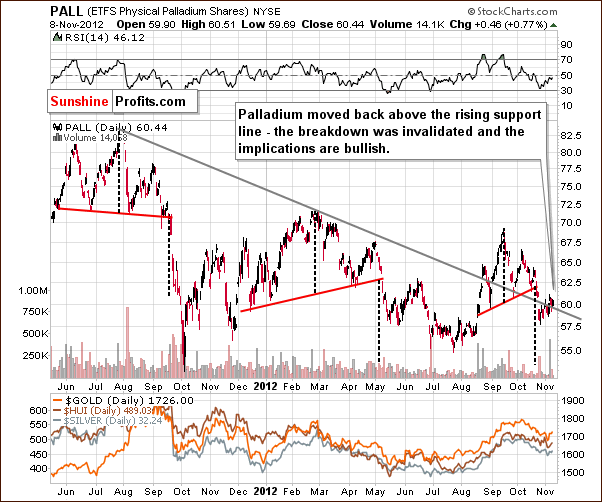
In this week's long-term chart for palladium, we see an invalidation of a breakdown below the declining support line, and the picture is once again bullish here. The bearish implications of this chart for the precious metals are no longer present. This chart does not contradict any of the bullish factors we have made previously in this week's Premium Update.
Precious Metals Mining Stocks
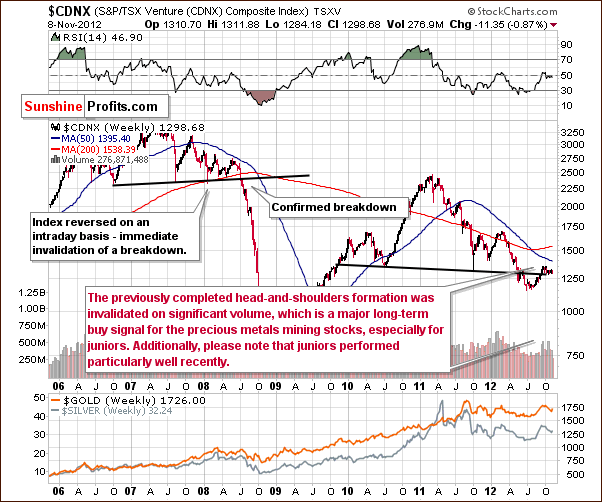
In the Toronto Stock Exchange Venture Index (which is a proxy for the junior miners as so many of them are included in it), there has been no significant change this week, which is actually a bullish development. Although the general stock market declined, the juniors held their price levels. They are closely correlated to the general stock market in the U.S., so the lack of declines in the price this week is very encouraging for the junior sector.
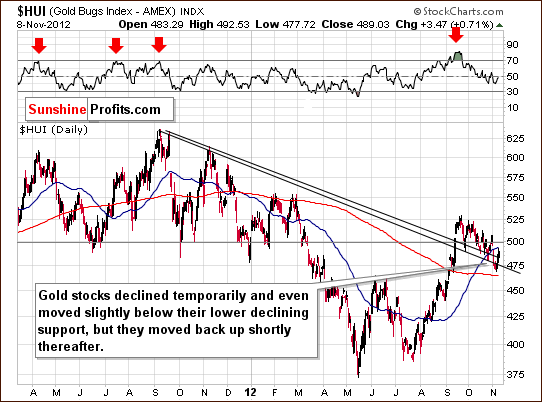
In this week's medium-term HUI Index chart, it seems that a bottom has formed slightly below the level of the previous lows. As we have discussed previously, we did not expect prices to move below previous lows and stay there for any significant amount of time. When this was seen, there was a quick invalidation of the move. In our view, the picture here remains bullish.
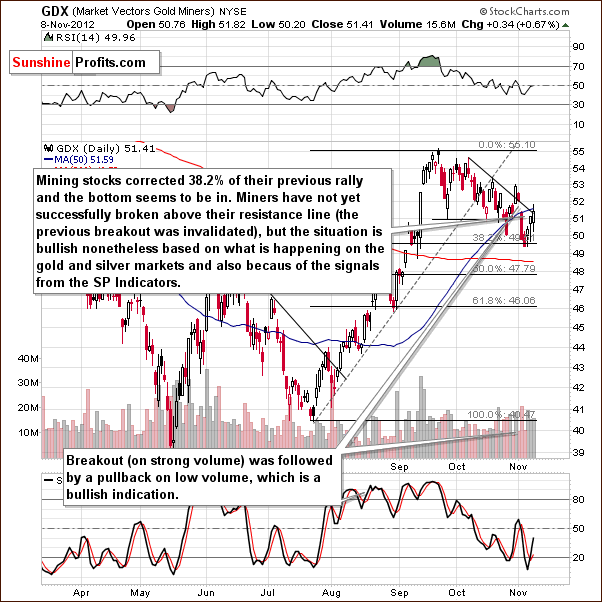
In the GDX ETF short-term chart, we once again see quite an achievement as prices rallied in the past few days in spite of the decline in the general stock market. The mining stocks have yet to breakout above the declining support line. The previous breakout was invalidated, but it seems likely that another will be seen and likely confirmed in the coming weeks.
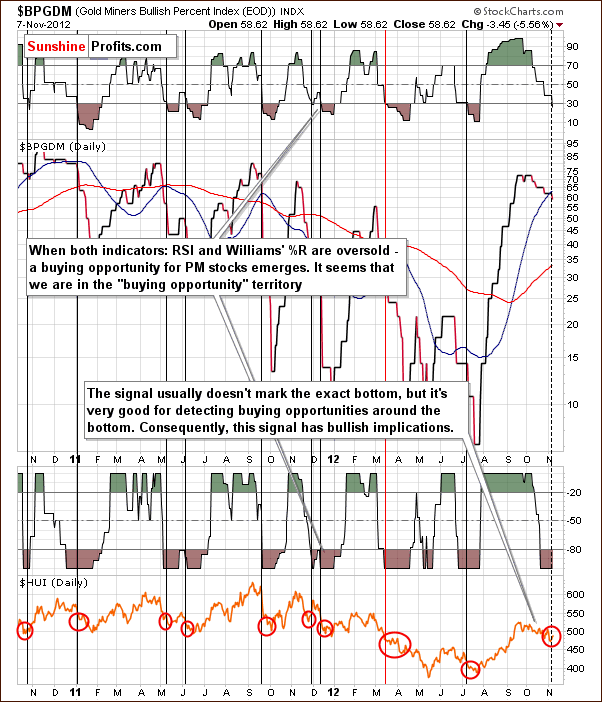
This week we include a chart, which has not been used for some time, the Gold Miners Bullish Percent Index chart. We have been monitoring this on an ongoing basis and it has just flashed a buy signal. This happens when the RSI and William's %R go into overbought territory. Even though the exact bottom has not been reached, it will likely be reached soon, and this is yet another bullish confirmation.
As a reminder:
The Gold Miners Bullish Percent Index is a market breadth/momentum indicator and is calculated by dividing two numbers: the amount of gold stocks on the buy signal (according to the point and figure chart, which emphasizes strong moves while ignoring small ones) and the amount of all gold stocks in the sector. If every gold stock is rising, then the value of the index will be at 100%, which raises a red flag as everyone interested in the market is already in, and the top will soon emerge. If we're looking at sentiment, substantial momentum usually corresponds to investors eager to jump in at quickly rising prices because they believe prices will continue much higher and are afraid of being left behind. Since the value of the index does not need to be at the oversold levels for a local bottom to form (still it is helpful in timing the major bottoms), we might need to look for additional tools to help us.
If you look closely you will notice two such additional tools in the above chart. The RSI (Relative Strength Index) is a technical momentum indicator that compares the magnitude of recent gains to recent losses in an attempt to determine overbought and oversold conditions.
The RSI also ranges from 0 to 100 with an asset deemed to be overbought once the RSI approaches the 70 level, meaning that it may be getting overvalued and is a good candidate for a pullback. Likewise, if the RSI approaches 30, it is an indication that the asset may be getting oversold and likely to become undervalued. If you look at the RSI indicator in the above chart, you can clearly see that it in fact just moved below the 30 mark.
Another indicator on this chart is the Williams %R, also a momentum indicator that is especially popular for measuring overbought and oversold levels during horizontal trends. Bullish percent indexes take values from 0% to 100% and obviously cannot rise above that level, so it can be viewed as a horizontal trend. Named for its developer, Larry Williams, the scale ranges from 0 to -100 with readings from 0 to -20 considered overbought, and readings from -80 to -100 considered oversold. What I find particularly interesting here, is that the %R indicator has signaled a "temporary oversold" territory only three times in 2009 - and that corresponded to the long-term buying points, and powerful rallies. The last time the %R indicator for Gold miners Bullish Percent index hit the -100 level was during the September bottom - a sizable rally followed. The same signal has just appeared in the recent days, which suggests that we will see PMs higher in the not too distant future.
Currently both: RSI and William's %R indicators suggest that a bottom is in or very close.
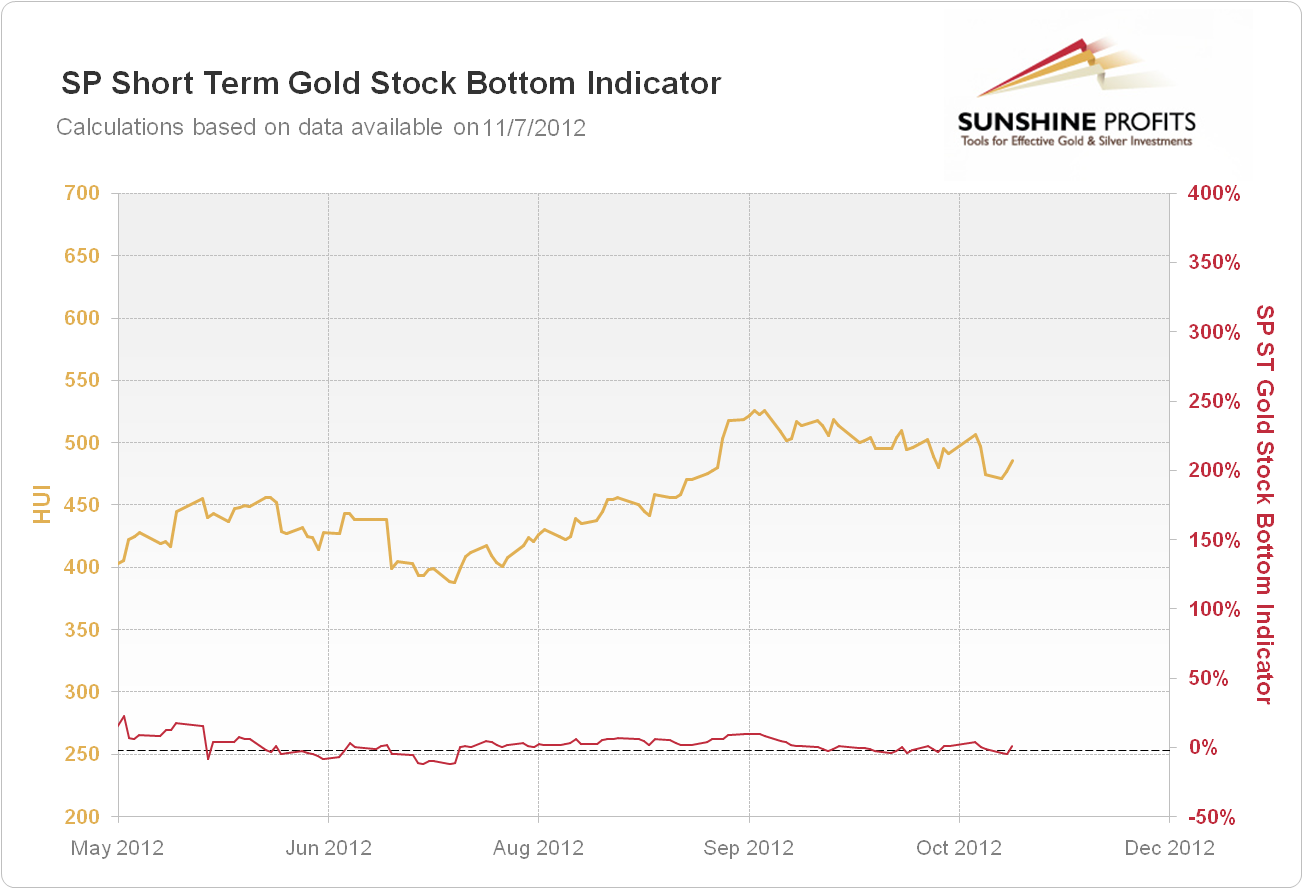
Our final chart this week is one of our Sunshine indicators, the Short-Term Gold Stock Bottom Indicator. Since the indicator moved above after being below the horizontal dashed line, a buy signal has flashed. Higher mining stock prices are suggested in the coming two weeks and most likely thereafter. This signal suggests opening a long position, but since we are already long in the mining stocks based on the previous signal from the SP Extreme and SP Extreme #2 indicators, it does not seem that any action is necessary at this time.
Summing up, with the short-term situation for gold, silver, and stocks bullish, we expect the precious metals stocks to break out and continue their rally very soon.
Junior Mining Stocks Ranking
As stated in the Gold & Silver Portfolio report, the list of top juniors will be updated approximately every 4 weeks, usually at the beginning of the month. As mentioned above, the situation in the junior sector currently looks very favorable, so let's see which juniors are particularly likely to provide you with high profits in the coming months.
As a reminder, in our view, one of the most important considerations when choosing junior mining stocks is their performance relative to the rest of the sector and also their strength during a decline and the subsequent bounce. For juniors, we can't apply as sophisticated algorithms as with senior gold stock rankings and silver stock rankings because the market is too small in each junior's case and the small price moves may not properly reflect the stocks' true value. It is for this same reason that junior mining stock prices can be manipulated more easily (diversify to lower the risk of being affected!). And it is also why we don't analyze individual juniors from the technical perspective on a regular basis.
See the results of our latest research on juniors in the tables below:
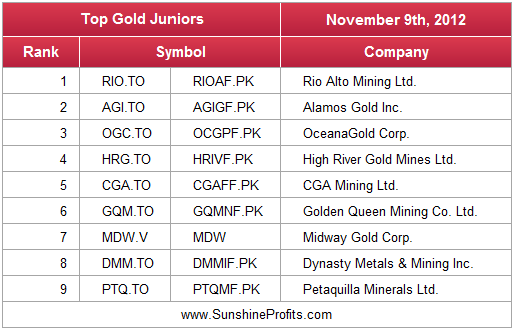
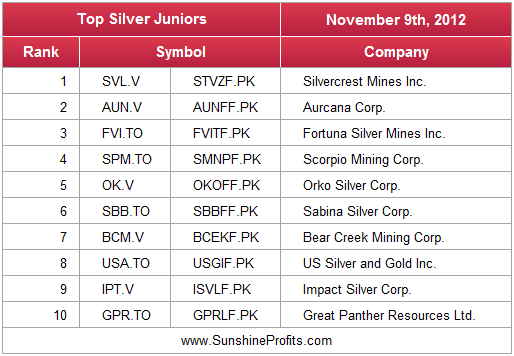
There were only a few changes since last month's rankings. Dynasty Metals & Mining replaced Centamin Egypt and Aurizon Mines in the gold ranking and in case of silver rankings we added Bear Creek Mining and US Silver and Gold to the list without removing any company.
Please keep in mind that we adjusted the data-set for calculations last month and companies that we featured previously are still in the ranking. This implies that the fundamentals behind companies are most likely solid as they consistently perform well. This does not refer to each company individually because they all have their ups and downs, but to all of them at the same time – they seem to average out each other's downs and ups and at the same time provide good profit potential – which is exactly what we strive for when constructing juniors portfolio.
Letters from Subscribers
Q: I have been following your free e-newsletter for a while. So far, I see many great trading calls and excellent educational information from your website. Thank you - I like your educational approach for precious metals investment. Just a few questions before joining your service:
1. Which trading platform do you use to place your trades? Does this platform have the option to place short and long trades? I really want to follow your instructions by doing it on the same platform.
2. If I have $100K to invest in precious metals, what percentage do you suggest to place in mining stocks and junior mining stocks? Thank you.
A: Thank you for your feedback, we appreciate it.
1. Generally, we prefer not to reveal our own broker, but yes, it does have the shorting option available. Please note that the suitability of a given trading platform can also depend on your tax jurisdiction. Different tax rates might apply based on your location, your platform's location and your investments' location - it depends on your legal system. We're not experts in that field so we can't recommend the best platform for you. Universally speaking, we have heard good opinions on Interactive Brokers. As far as instruments are concerned, again, there's the key issue of suitability. Futures and options are great for speculative purposes (and awful for long-term investments) but only for experienced traders who are certain not to risk too much of their capital. ETFs and ETNs seem suitable for the widest range of traders because of their simplicity and the fact that it’s not easy to lose everything even if the size of the trade is many times too big. Then there are CFDs (we are certain that you can follow our trades using the plus500 platform) that will be most likely ok unless you earn way too much (after all you will be betting against the regulator). Their biggest advantage is that it's very easy to start using it.
2. Again, the suitability issue. There is no universal answer to this question, but in this case you can check out our 3 sample portfolios at the bottom of our portfolio structuring essay <LINK>). For instance, risk-averse investors should hold a smaller portion of their assets in mining stocks than risk-neutral/ risk-seeking individuals.
Q: Hello, I'm a new subscriber and I'm now in a trial period. I have been trying to use the pyramid optimizer. I saw the tutorial andvideo, but I am having trouble. Here are the details: basically I think that SLV will get to 40.50 before February, and it's now at 31.27. I want to see what options to buy, but it tells me that the best way is to buy the "underlying security itself." This is the information I put in the system:
CURRENT PRICE - 31.27
FIRST STRIKE – 31
LAST STRIKE – 50
DIFFERENCE BETWEEN STRIKE – 1
DAYS TO EXPIRY – 100
RISK FREE RATE - 0.1
CURRENT PRICE OF THE CHEAPEST STRIKE PRICE THAT IS IN THE MONEY - 1.61
COMMISION - 1200 CENTS
SPREAD - 0.01
PREDICTIONS:
STARTING PRICE - 31.27 (this is the price today)
TIME TO EXPIRY - 100 (February 2013)
FINAL PRICE - 40.50
DAYS TO REACH – 90
Thank you very much for your help.
A: Hi, thanks for the question and for providing details. It seems that the commission that you entered was incorrect. The Pyramid Optimizer uses the commission in a per-option format, and I believe you entered the value for the 100-share order. Consequently, based on the values that you entered the tool "thought" that for every option purchased you would need to pay over 7 times more in commission - and the tool suggested not using options at all because they were so expensive in this case.
Entering 12 cents instead of 1200 would generate the outcome in which 2 sets of options (strikes: 35, 38) provide the highest potential profit (1516%) but at the same time the best single strike price (37) provides a profit potential that is only slightly lower (1296%). All in all, we would go with the single set of options with the 37 strike price as it is not certain that you would be able to make the switch between strike prices at the suggested moment/ price. As you saw in the video and read in the report/ instruction, pyramiding options is particularly useful for very sharp and big moves, and the coming one, although probably huge, is not as extreme.
We updated our instructions by adding your example, thanks. On a side note, if you are interested in the topic of pyramiding options, please be sure to read our report on pyramiding.
Q. Given that volume is an important indicator, I was wondering:
1. Do you look at pre-market and/or after market volumes at all?
2. If so, what use do you make of those numbers?
I tend to look at these regularly, and noted today that while daily volume in GDX was around 8M, aftermarket was in excess of 3M. It left me wondering whether you include those numbers in your daily assessment of volume.
A. Generally, no, we don't take the pre-market and aftermarket volumes into account on a regular basis - only the volume reported during normal market hours.
This type of volume is something that we'd like to research thoroughly in the future. As far as chart analysis is concerned, we believe that using volume and price moves for the most representative part of the session is the way to go. This ensures that we will be able to compare many markets and create ratios because data is available.
Summary
The USD Index appears to have reached its target area, and the general stock market seems to be close to or at its bottom from a long-term perspective. Surprisingly, these two factors do not have a major impact on the precious metals at this time. They have an impact, but it is not very strong as we can see with the higher precious metals prices this week despite the lack of signals from these two markets. Overall, this is a very bullish situation for gold, silver and mining stocks (also for platinum and palladium).
Gold, silver and the mining stocks rallied recently even though stock prices moved lower and the USD Index moved a bit higher. Again, this is a bullish combination for precious metals especially in view of the existing favorable technical patterns. Gold bottomed at its 300-day moving average and broke out above the short-term declining trend channel. This breakout was confirmed, and the long-term cup-and-handle pattern completed as well. All of the above suggests that a rally has just started.
The mining stocks also continue to have a very bullish outlook even though the short-term GDX has not broken out just yet. We believe in keeping long-term holdings intact as long positions in gold, silver and mining stocks continue to be a good idea. Risk neutral traders (not risk-averse ones) could add to their long positions in the precious metals sector (gold, silver and mining stocks) because breakouts have been confirmed and another buy signal has been seen from out SP Short-Term Gold Stock Bottom Indicator this week.
In case you missed several previous updates and messages from us, please note that we recently released several new sections, which you can access using the following links:
Thank you for using the Premium Service. Have a profitable week and a great weekend!
This completes this week's Premium Update. Our next Premium Update is scheduled for Friday, November 16, 2012. Of course, we will continue to send out Market Alerts whenever appropriate.
Przemyslaw Radomski, CFA


