

-
Gold Investment Update: Gold and Silver Waiting on USDX, No Bottom Yet
December 14, 2020, 11:59 AMSilver still has some way to go before bottoming. It has not rallied despite a lower USDX (gold and miners did not rally either) and a higher stock market. Silver has bright days ahead, but not until it passes this downward shift in trend and bottoms. And please remember, gold’s more volatile little brother is more prone to sudden price swings as traders like to pick up some cheap silver after a pullback.

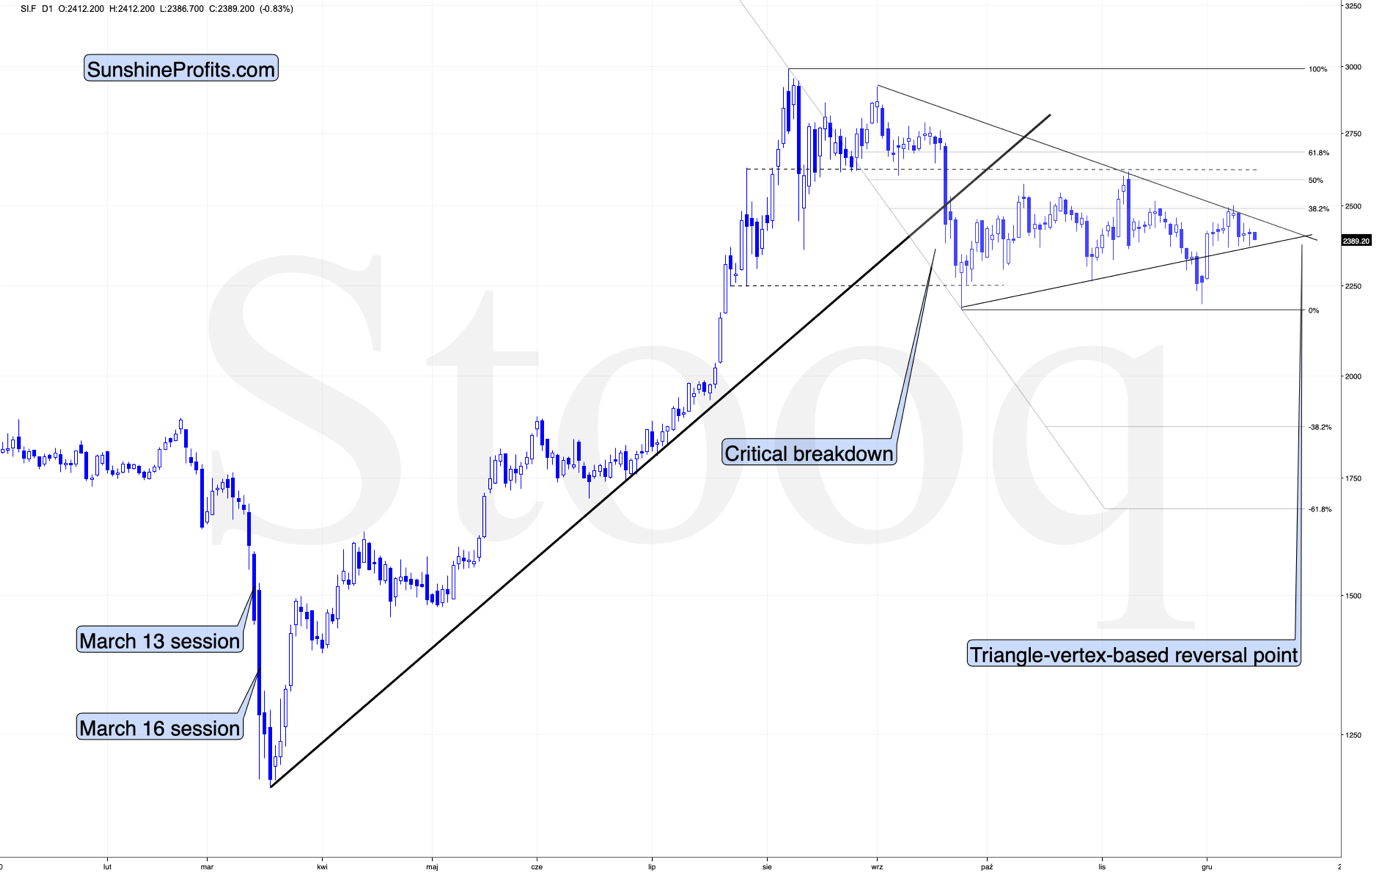
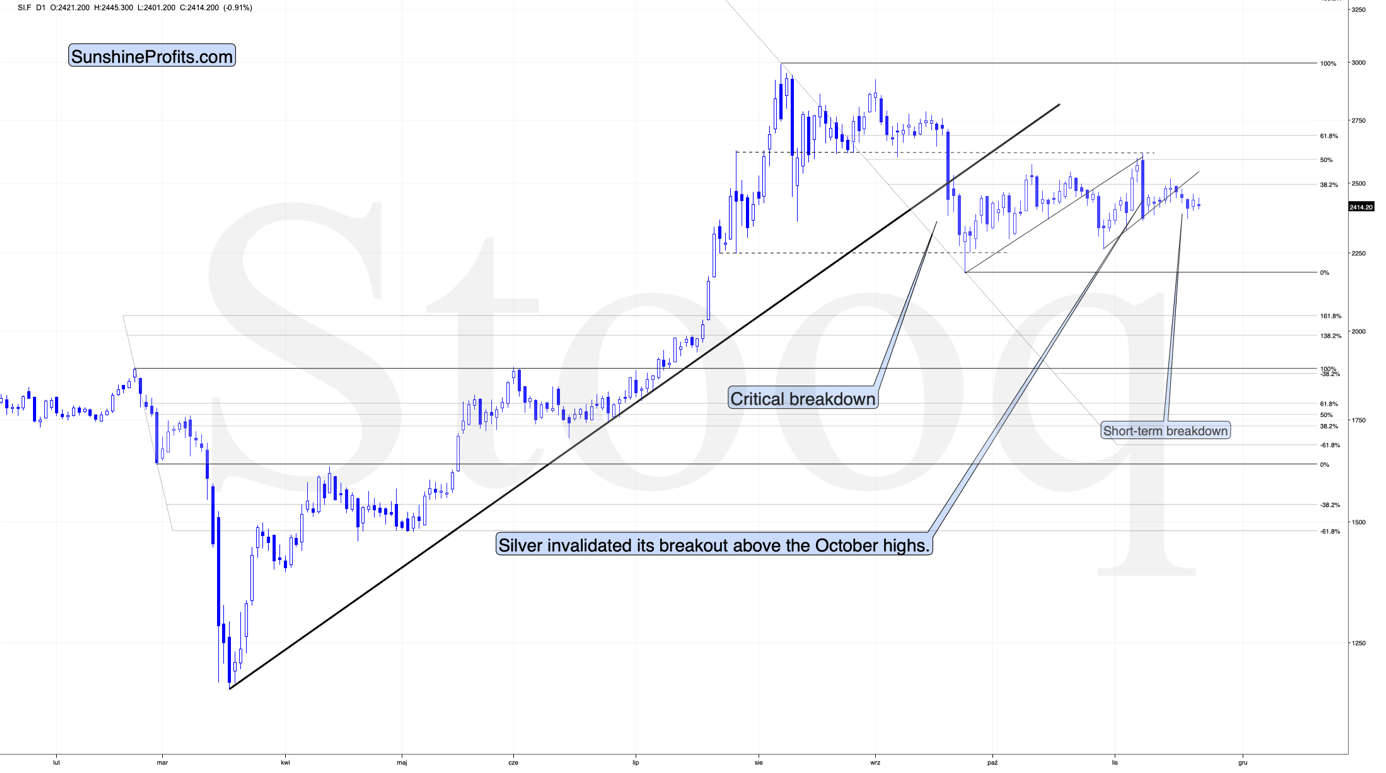
While gold broke below its September low and now verified its breakout, silver just moved to its own September low and then bounced back. After moving higher, silver seems to have topped right at its 38.2% Fibonacci retracement based on the August – September decline and the declining resistance line.
What does this imply? Not much, actually – it means that the white metal is continuing to trade sideways after breaking below the rising, medium-term support line in mid-September.
Silver shrugged off the rally in the general stock market and the decline in the USD Index – it could have rallied on any of the above, and instead it just kept consolidating.
Consequently, silver seems to be preparing for a bigger mover lower.
It’s also important to note that silver is holding up much better than gold and – in particular – mining stocks. If this was the early stage of a rally, miners would have been strong, and silver would have been weak or average. What we see confirms the validity of the bearish case for the next few weeks or months.
Let’s take a look below for details.

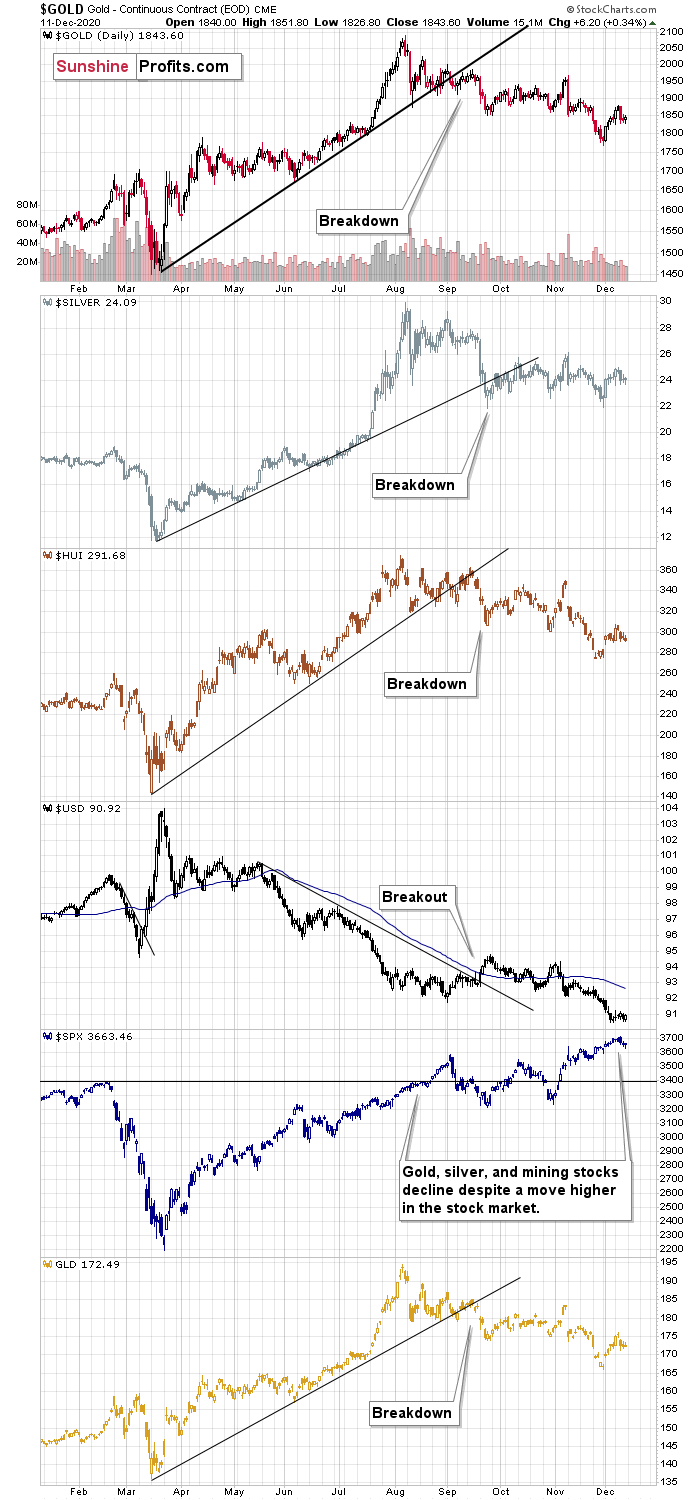
The thing that I want to emphasize today is the aftermath of the clear September moves. It was then that the USD Index broke above its declining resistance line, and it was then that gold and silver broke below their rising support lines. Miners broke below their support line in August, but the final and decisive breakdown took place in September.
What happened since that time? The USD Index moved somewhat higher, but then ultimately moved to and stayed at new yearly lows. Gold, silver, and mining stocks should have rallied given the above. They have not.
Silver is more or less at the level just before it broke, gold is below it, and mining stocks are also below it – the most out of the entire trio.
So, it is not only the case that silver was strong and miners were weak in the last several days – it’s been the case over the past few months as well. The implications are bearish.
Moreover, please note that the general stock market moved higher since September, which didn’t trigger a sustainable rally in silver or mining stocks. In fact, the latter just verified their breakdown below their September and October lows. Again, the implications are bearish.
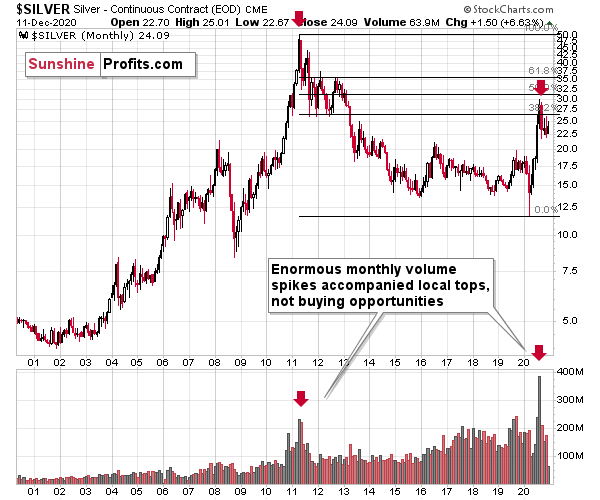
Additionally, the implications coming from silver’s long-term chart are also bearish for the next several weeks (perhaps even months) due to the size of the volume that accompanied the recent monthly rally.

If you look at the monthly silver volume levels, it seems likely that the next sizable downswing has already begun. The previous substantial monthly volume in silver accompanied the 2011 top. The analogy doesn’t get more bearish than this. Ok, it would, if there were multiple key tops confirmed by huge monthly volume. But the 2011 top was so significant that other tops are not comparable, except for the most recent one. Thus, the implications are bearish.
Moreover, please keep in mind that while gold moved to new highs, silver – despite its powerful short-term upswing – didn’t manage to correct more than half of its 2011 – 2020 decline.
In fact, silver has already invalidated its move above the lowest of the classic Fibonacci retracement levels (38.2%), which is not something that characterizes extraordinarily strong markets.
Based on the above chart, it seems that silver is likely to move well above its 2011 highs, but it’s unlikely to do it without another sizable downswing first.
Thank you for reading our free analysis today. Please note that the following is just a small fraction of the full analyses that our subscribers enjoy on a regular basis. They include multiple premium details such as the interim target for gold that could be reached in the next few weeks. We invite you to subscribe now and read today’s issue right away.
Sincerely,
Przemyslaw Radomski, CFA
Founder, Editor-in-chief -
Gold Investment Update - Gold: Have We Seen the Bottom Yet ?
December 7, 2020, 1:03 PMAs we dive into December, everything seems to hinge on an ever-changing daily news cycle. Coronavirus cases surging? Gold goes up, oil goes down. Another positive vaccine trial? Stocks go up, gold goes down. As the rollercoaster ride continues, there are various tools and indicators that one can examine to gain some sense of what’s happening in the fundamentals. The Gold Miners Bullish Percent Index ($BPGDM) and the The VanEck Vectors Gold Miners ETF (GDX) are two barometers that may be useful.
Last week we examined the similarities in the performance of the Gold Miners Bullish Percent Index ($BPGDM) in 2016 and 2020. We noted that in 2016 the $BPGDM had an additional upswing before the slide and that the same pattern was evident in the middle of 2020. We also highlighted that in 2016 and 2020, the buying opportunity in the miners didn’t present itself until the $BPGDM was below 10, whereas it currently sits above 30. The conclusion was that the miners are likely to move even lower.
The GDX ETF was the first ETF in the U.S. to allow investors and traders exposure to gold mining companies. Let’s briefly look at what has occurred in the GDX ETF in the first week of December.

On December 1, I wrote the following about the likely upside target for the mining stocks during the recent correction:
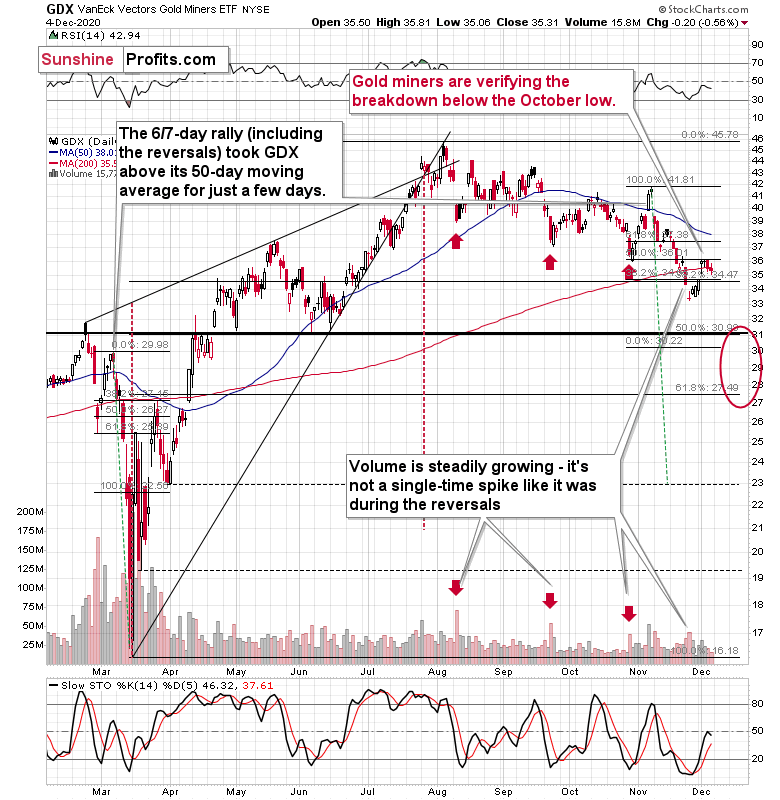
How high could miners go? Perhaps only to the previous lows and by moving to them, they could verify them as resistance. The previous – October – low is at $36.01 in intraday terms and at $36.52 in terms of the daily closing prices. No matter which level we take, it’s not significantly above the pre-market price of $35.76, thus it seems that adjusting the trading position in order to limit the exposure for the relatively small part of the correction is not a good idea from the risk to reward perspective – one might miss the sharp drop that follows. Please note how sharp the mid-November decline was initially.
That’s exactly what happened – the GDX ETF rallied to $36.14 and then it started moving back down. Is the corrective upswing over? This is quite likely, however, I wouldn’t rule out another move higher, if the USD Index declines to, or slightly below, the 90 level. Still, such a move higher in the miners is not likely to be anything significant.
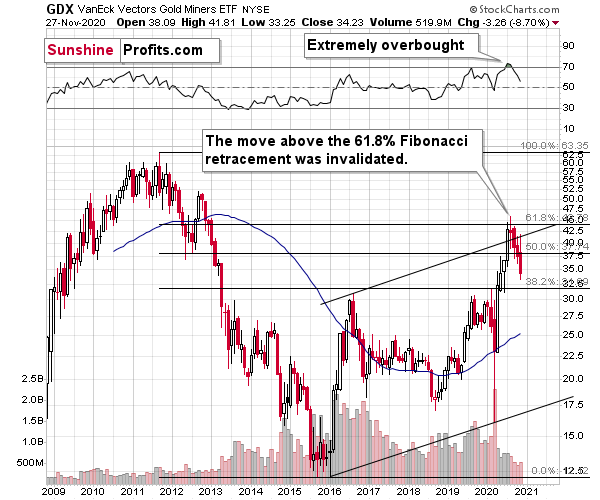
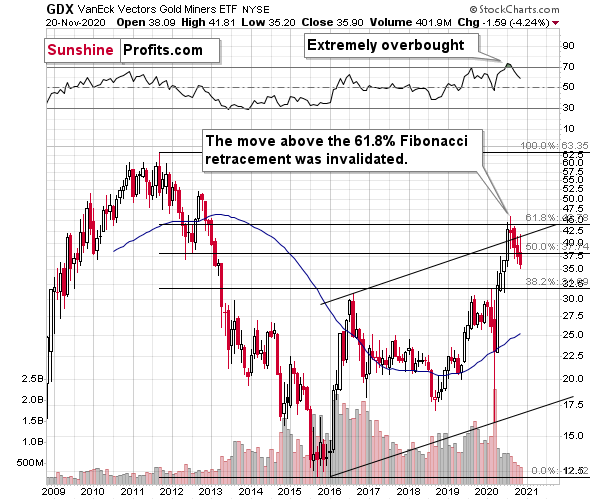
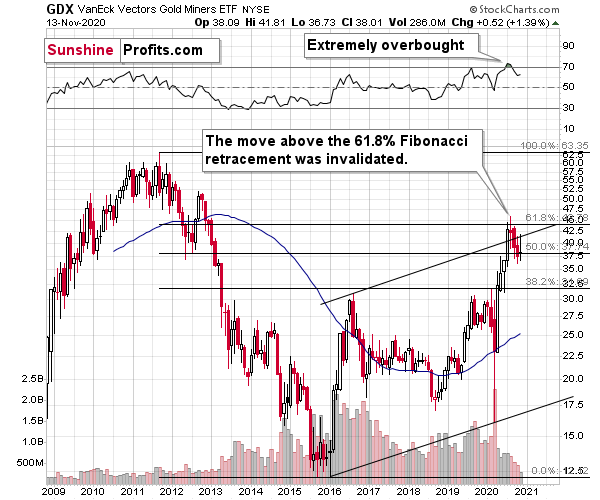
Also, let’s not forget that the GDX ETF has recently invalidated the breakout above the 61.8% Fibonacci retracement based on the 2011 – 2016 decline.
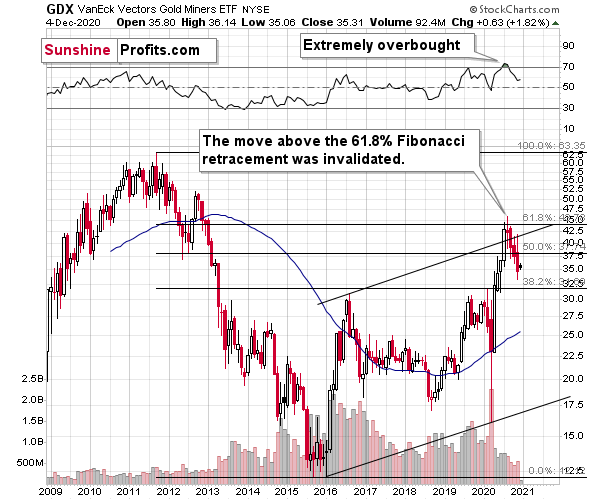
When GDX approached its 38.2% Fibonacci retracement, it declined sharply – it was right after the 2016 top. Are we seeing the 2020 top right now? This is quite possible – PMs are likely to decline after the sharp upswing, and since there is just more than one month left before the year ends, it might be the case that they move north of the recent highs only in 2021.
Either way, miners’ inability to move above the 61.8% Fibonacci retracement level and their invalidation of the tiny breakout is a bearish sign.
The same goes for miners’ inability to stay above the rising support line – the line that’s parallel to the line based on the 2016 and 2020 lows.
Thank you for reading our free analysis today. Please note that the following is just a small fraction of the full analyses that our subscribers enjoy on a regular basis. They include multiple premium details such as the interim target for gold that could be reached in the next few weeks. We invite you to subscribe now and read today’s issue right away.
Sincerely,
Przemyslaw Radomski, CFA
Founder, Editor-in-chief -
Gold Investment Update - Probing Gold’s Bottom
November 30, 2020, 12:17 PMAs 2020 is wrapping up, investors are trying to narrow down the target for gold’s bottom in the coming weeks. And as the yellow metal is experiencing what appears to be its worst month in the past four years, the Gold Miners Bullish Percent Index ($BPGDM) once again provides us with some key insights into reading the bearish signals for the precious metals.
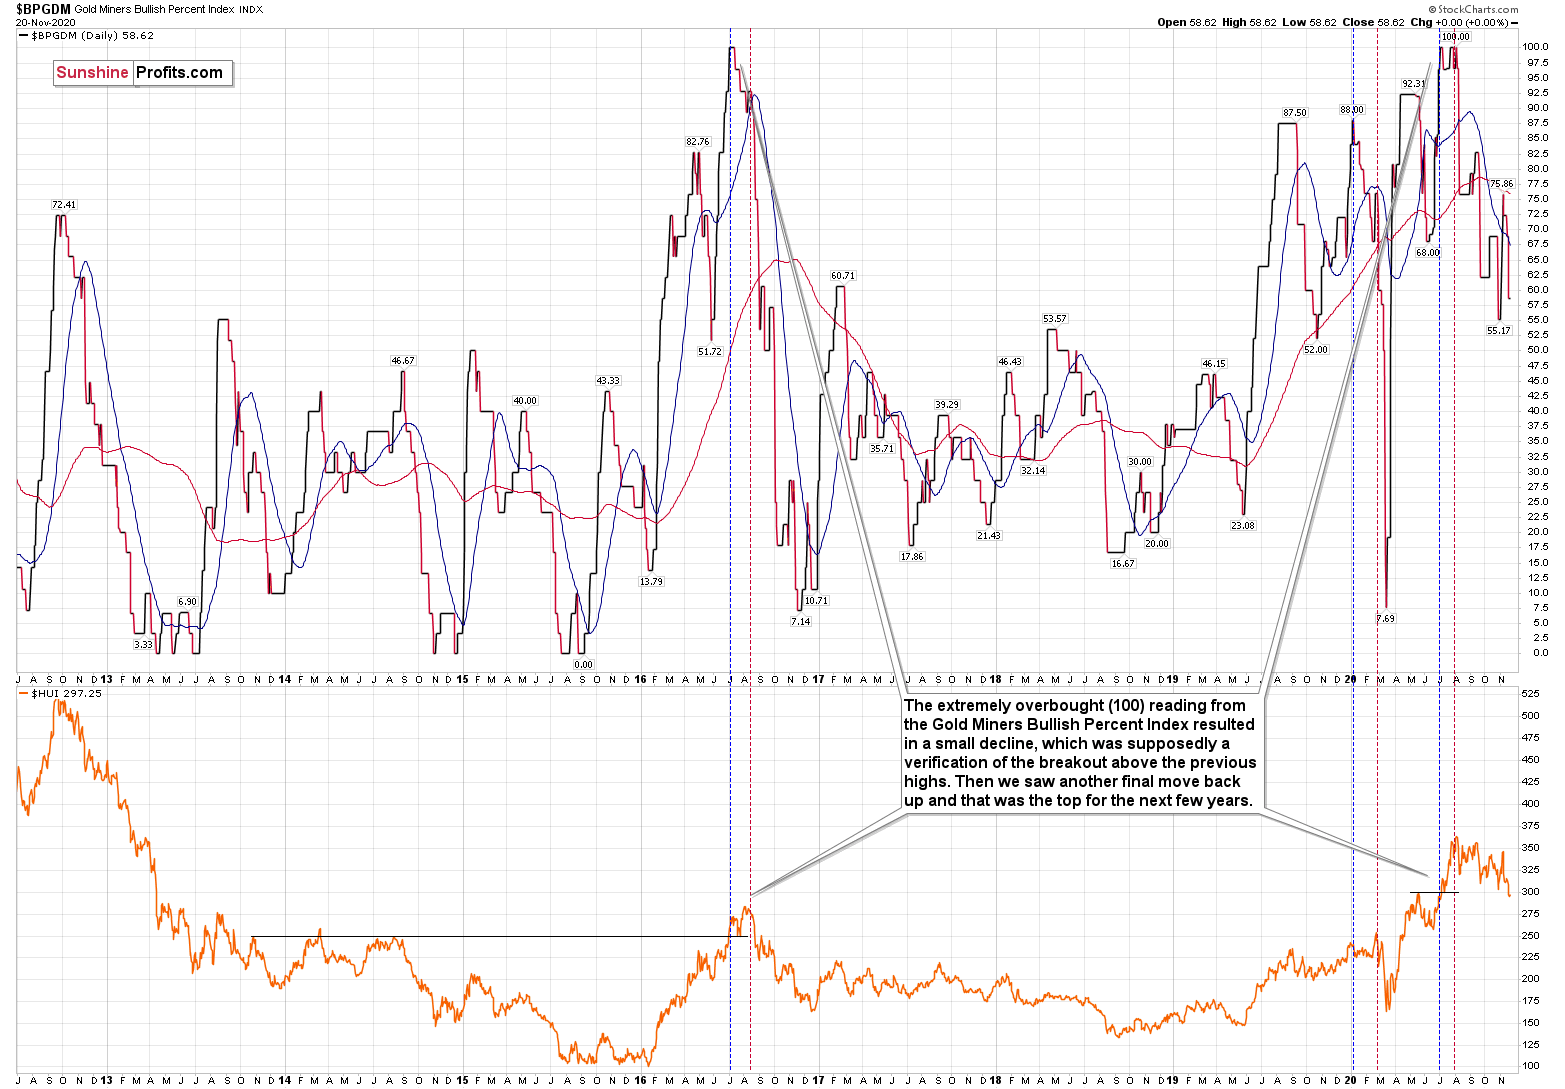
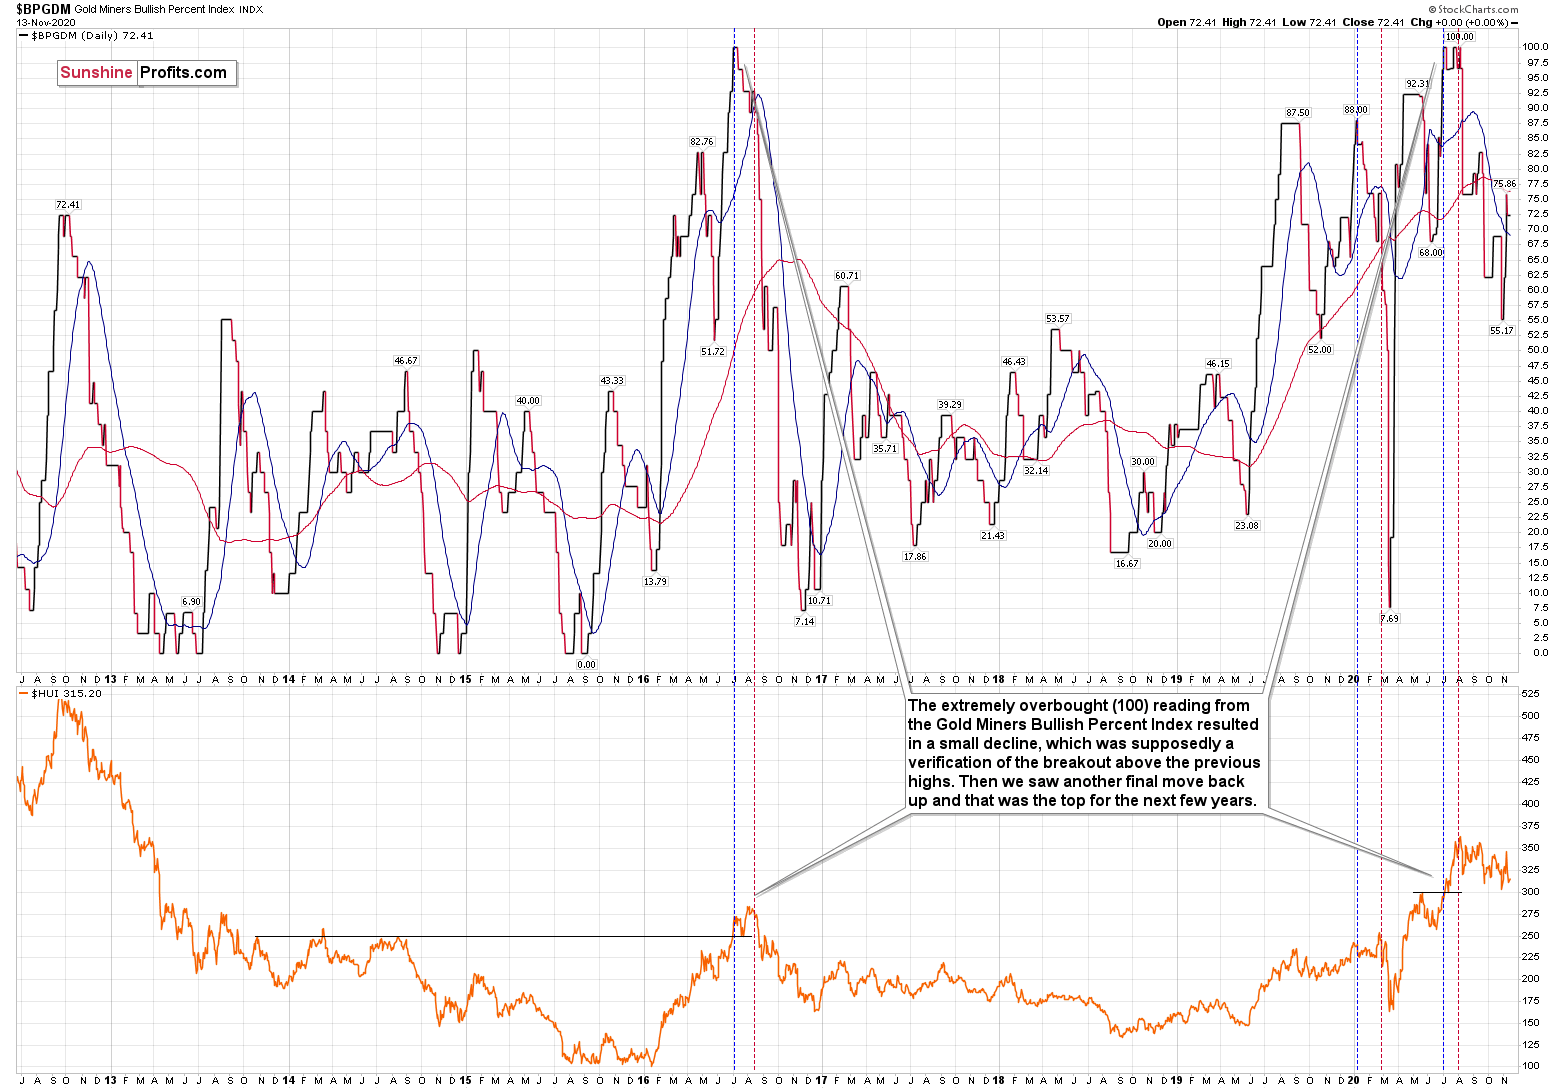
Last week, the BPGDM showed the highest possible overbought reading.

The excessive bullishness was present at the 2016 top as well and it didn’t cause the situation to be any less bearish in reality. All markets periodically get ahead of themselves regardless of how bullish the long-term outlook really is. Then, they correct. If the upswing was significant, the correction is also quite often significant.
Please note that back in 2016, there was an additional quick upswing before the slide and this additional upswing had caused the $BPGDM to move up once again for a few days. It then declined once again. We saw something similar also in the middle of this year. In this case, the move up took the index once again to the 100 level, while in 2016 this wasn’t the case. But still, the similarity remains present.
Back in 2016, when we saw this phenomenon, it was already after the top, and right before the big decline.
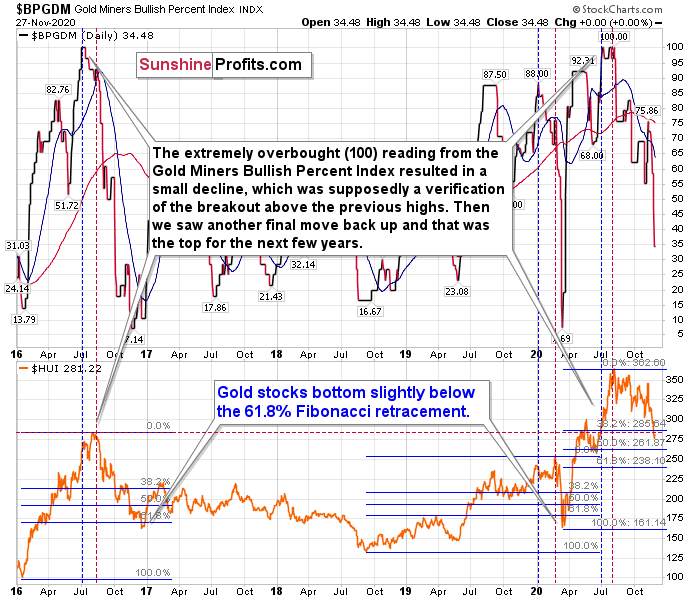
Based on the decline from above 350 to below 280, we know that a significant decline is definitely taking place. But has it already run its course?
Let’s consider two similar cases when gold miners declined significantly after the $BPGDM was very high: the 2016 decline and early-2020 decline.
In both cases, the HUI Index continued to decline until it moved slightly below its 61.8% Fibonacci retracement level. This means that if the history is to repeat itself, we shouldn’t expect any major turnaround until the gold miners decline to 220 - 230 or so. Depending on how things are developing in gold, the above might or might not be the final bottom, though.
Please note that the HUI already declined below its 2016 high. This breakdown is yet another bearish sign.
Please note that back in 2016 (after the top), and in March 2020, the buying opportunity didn’t present itself until the $BPGDM was below 10. Currently, it’s above 30, so it seems that miners are likely to move even lower.

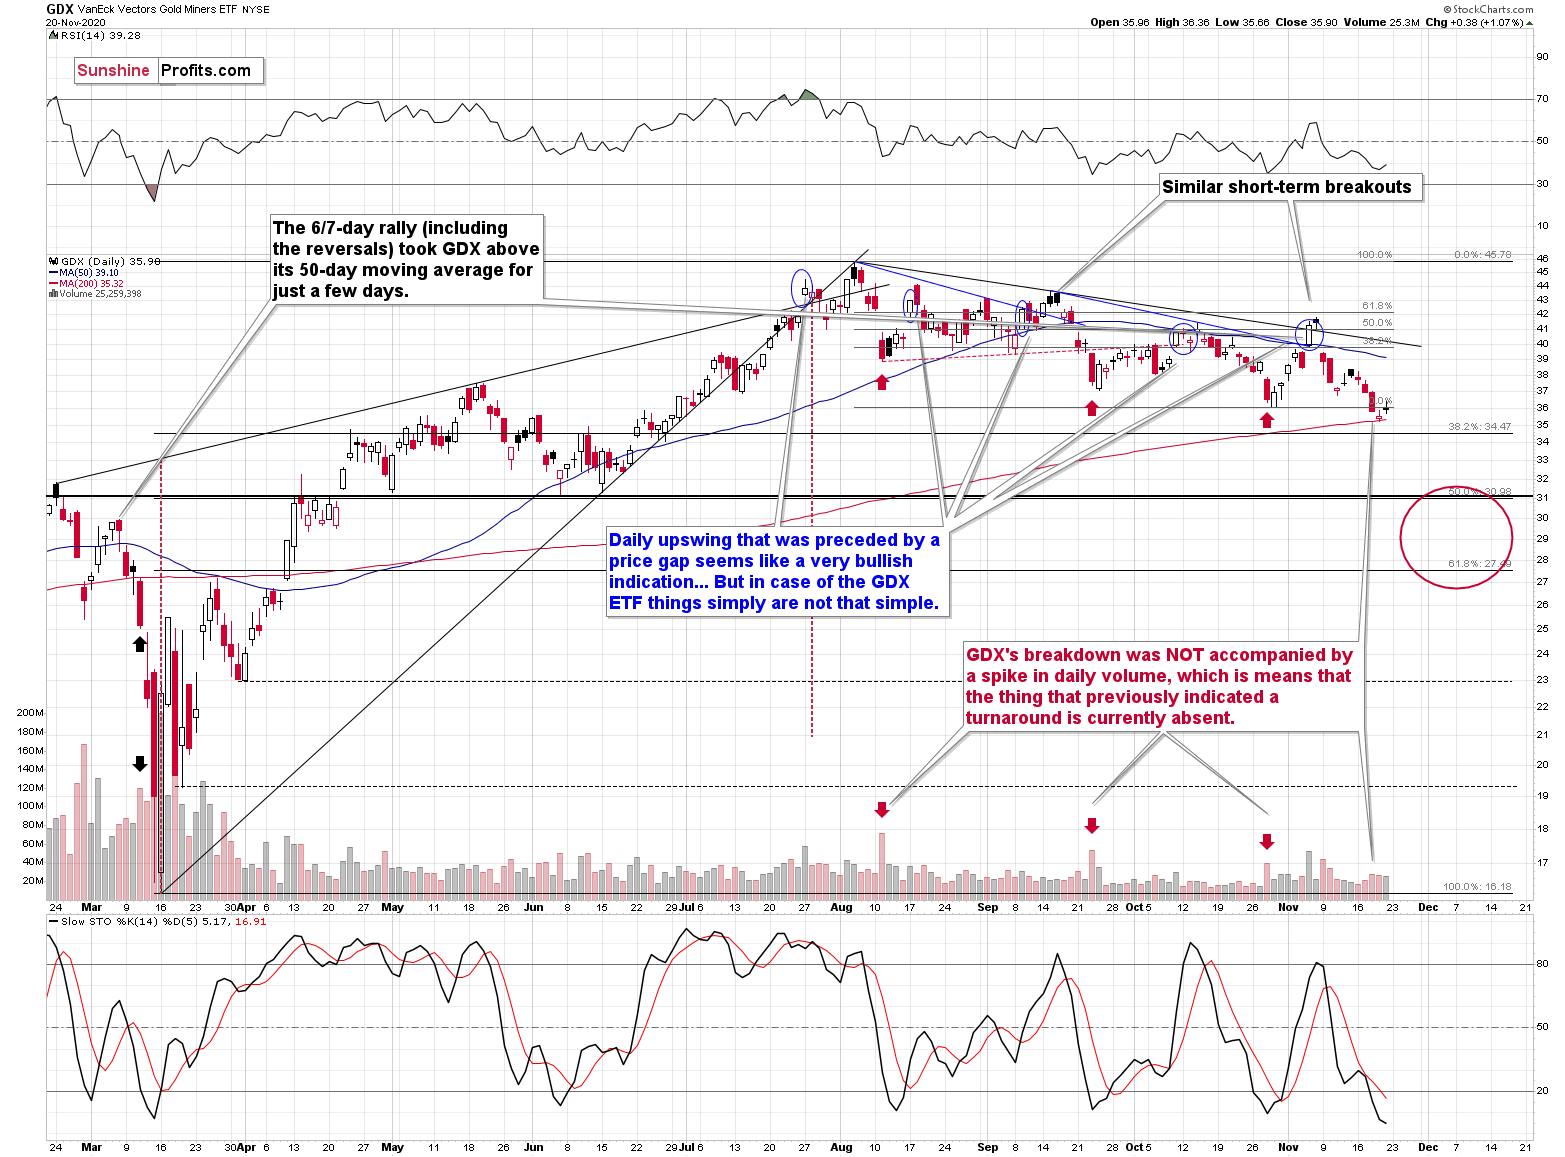
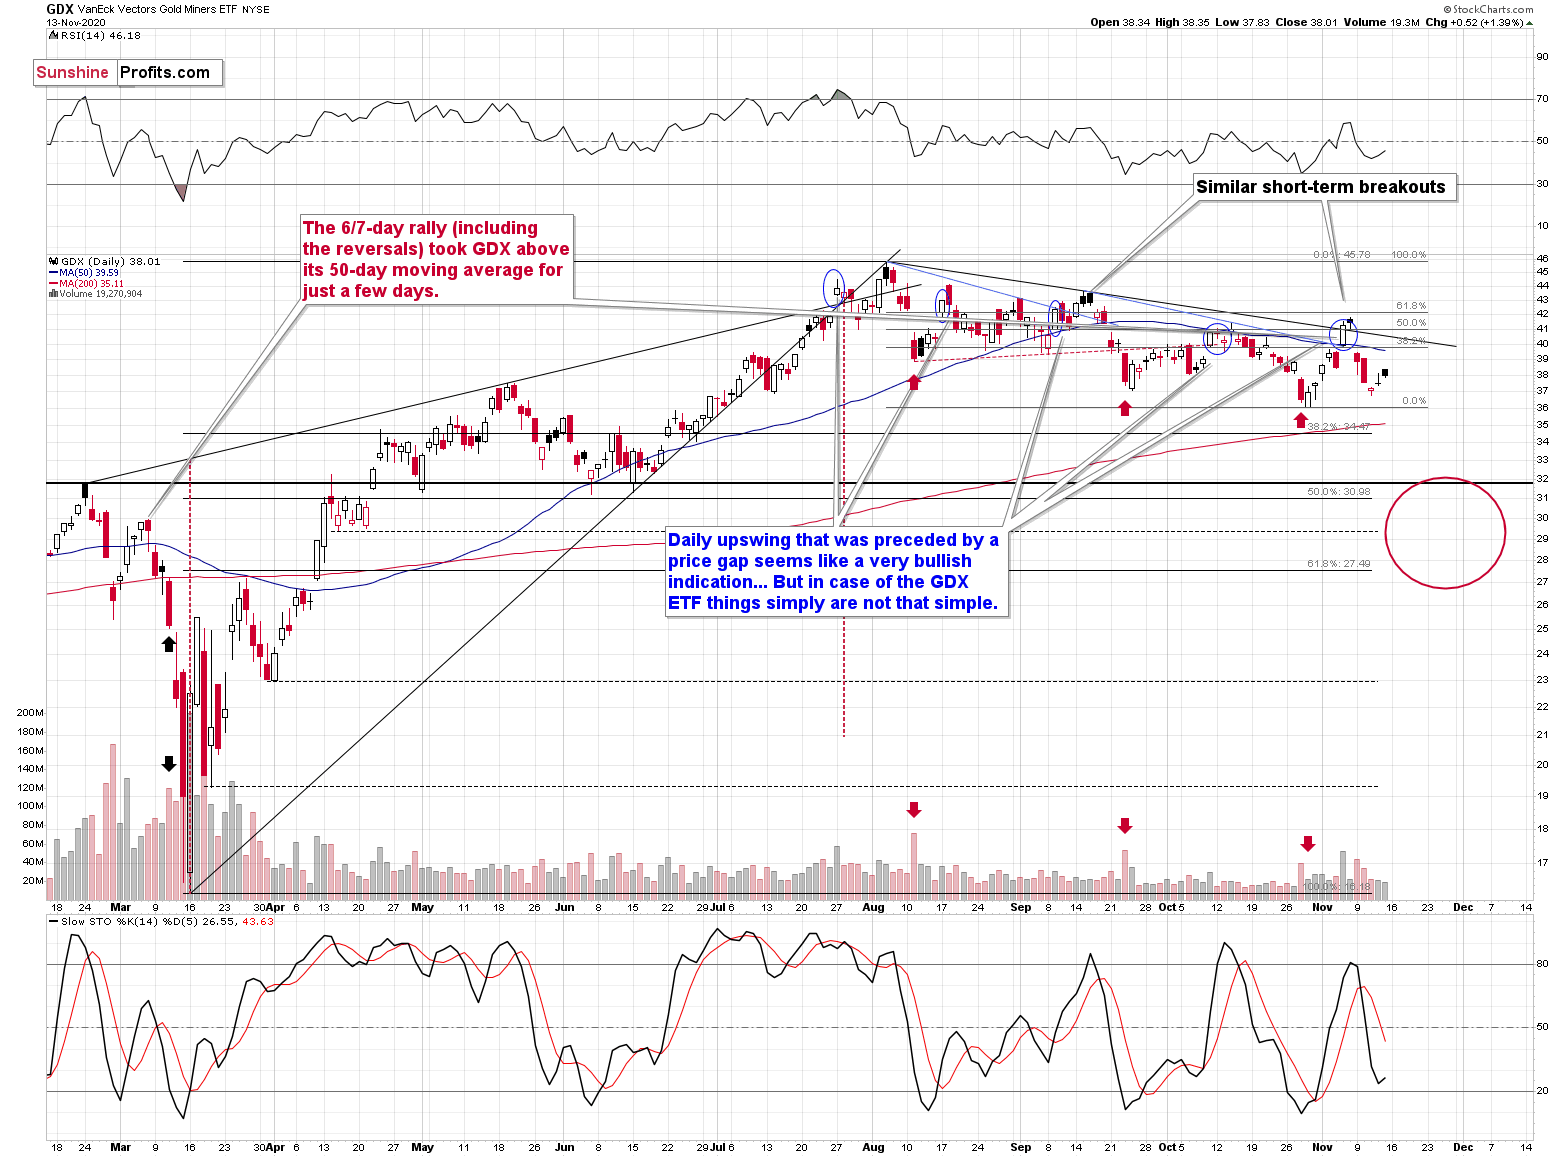
Two weeks ago, when I was preparing the analysis of the above GDX ETF chart, I commented on the late-week rebound in the following way:
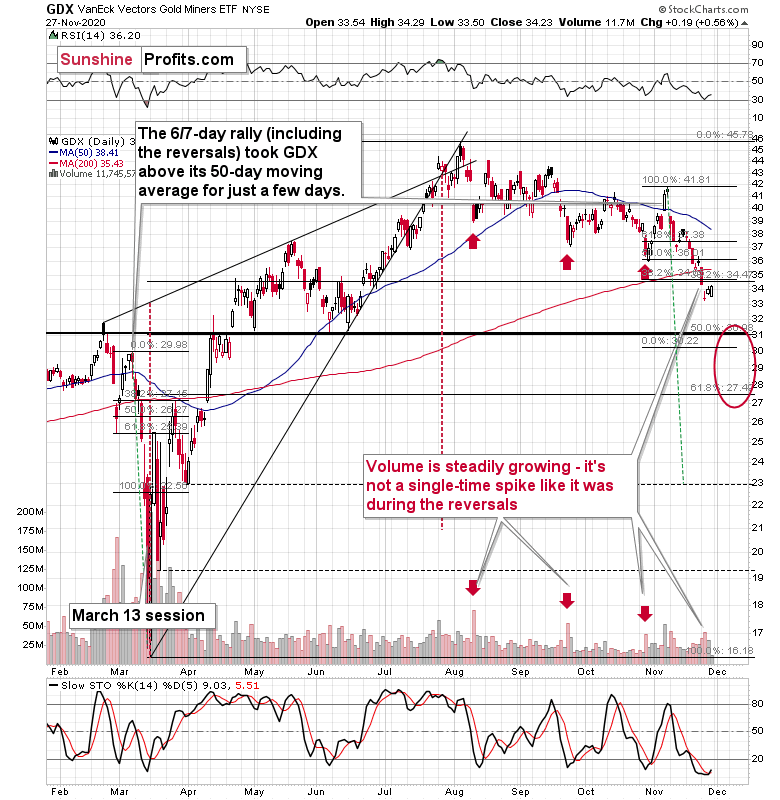
On Thursday (Nov 12th) and Friday (Nov 13th) of last week, miners moved and closed higher, but it’s important to note that their upswing was tiny and not accompanied by strong volume. In other words, it has all the characteristics of the breather that’s going to be followed by another move in the direction in which the market had been moving previously.
The previous move was down, so the implications are bearish.
Something similar took place during last week as well as the previous week, and thus today’s comments will be similar. It seems that we now have this specific weekly gold stocks seasonality where miners decline strongly early in the week and then show some limited strength before the weekend.
For now, it seems that we have just likely seen a regular breather that is likely to be followed by further declines.
As indicated earlier, the biggest part of the decline might start shortly after Thanksgiving.
Also, let’s not forget that the GDX ETF has recently invalidated the breakout above the 61.8% Fibonacci retracement based on the 2011 – 2016 decline.

When GDX approached its 38.2% Fibonacci retracement, it declined sharply – it was right after the 2016 top. Are we seeing the 2020 top right now? This is quite possible – PMs are likely to decline after the sharp upswing, and since there is just more than one month left before the year ends, it might be the case that they move north of the recent highs only in 2021.
Either way, miners’ inability to move above the 61.8% Fibonacci retracement level and their invalidation of the tiny breakout is a bearish sign.
The same goes for miners’ inability to stay above the rising support line – the line that’s parallel to the line based on the 2016 and 2020 lows.
Thank you for reading our free analysis today. Please note that the following is just a small fraction of the full analyses that our subscribers enjoy on a regular basis. They include multiple premium details such as the interim target for gold that could be reached in the next few weeks. We invite you to subscribe now and read today’s issue right away.
Sincerely,
Przemyslaw Radomski, CFA
Founder, Editor-in-chief -
Gold Investment Update - Precious Metals Now and Then: A Comparison
November 24, 2020, 8:03 AMThe last time The Gold Miners Bullish Percent Index ($BPGDM) signaled overbought conditions, it was 2016 and another U.S. Presidential election had just wrapped up. Precious metals tumbled right after that. What’s this $BPGDM you ask, and why is it important ?
When making decisions regarding the gold mining stocks sector, some will choose to follow price actions while others will use indicator tools. The Gold Miners Bullish Percent Index is one such tool, essentially being a gauge of overbought and oversold conditions for the gold mining sector with readings plotted on a range between 0 and 100. Anything below 30 suggests oversold conditions while readings above 70 indicate an overbought situation, with a buy or sell signal being triggered when the index reaches an extreme level and then reverses. Because gold stocks move in tune with gold or silver, the index can be useful in determining the direction of the entire precious metals sector as well as acting like a crystal ball when comparing historical patterns.
Most recently, the $BPGDM showed the highest possible overbought reading, which gives us an indication that the outlook for the precious metals is bearish.

The excessive bullishness was present at the 2016 top as well and it didn’t cause the situation to be any less bearish in reality. All markets periodically get ahead of themselves regardless of how bullish the long-term outlook really is. Then, they correct. If the upswing was significant, the correction is also quite often significant.
Please note that back in 2016, there was an additional quick upswing before the slide and this additional upswing had caused the Gold Miners Bullish Percent Index to move up once again for a few days. It then declined once again. We saw something similar also this time. In this case, the move up took the index once again to the 100 level, while in 2016 this wasn’t the case. But still, the similarity remains present.
Back in 2016, when we saw this phenomenon, it was already after the top, and right before the big decline. Given the situation in the USD Index, it seems that we’re seeing the same thing also this time.
Please note that back in 2016, after the top, the buying opportunity didn’t present itself until the Gold Miners Bullish Percent Index was below 10. Currently, it’s above 50, so it seems that miners have a long way to go before they bottom (perhaps a few months – in analogy to how gold declined in 2016).

Last week, when I was preparing the analysis of the above GDX ETF chart, I commented on the late-week decline in the following way:
On Thursday (Nov 12th) and Friday (Nov 13th) of last week, miners moved and closed higher, but it’s important to note that their upswing was tiny and not accompanied by strong volume. In other words, it has all the characteristics of the breather that’s going to be followed by another move in the direction in which the market had been moving previously.
The previous move was down, so the implications are bearish.
The intraday nature of Friday’s and Thursday’s moves is also quite informative. In both cases miners moved higher – just as gold did – but then they declined, erasing a large part of the preceding gains before the end of the session. That’s yet another clue confirming the counter-trend nature of the recent upswing in the miners.
Something similar took place last week, and thus today’s comments will be similar. Gold miners declined early during the initial part of the week, and then they bounced right before the weekend. The volume was decent, but nothing to call home about. What does it mean? It means that we have just likely seen a regular breather that is likely to be followed by further declines.
As indicated earlier, the biggest part of the decline might start shortly after Thanksgiving.
Also, let’s not forget that the GDX ETF has recently invalidated the breakout above the 61.8% Fibonacci retracement based on the 2011 – 2016 decline.

When GDX approached its 38.2% Fibonacci retracement, it declined sharply – it was right after the 2016 top. Are we seeing the 2020 top right now? This is quite possible – PMs are likely to decline after the sharp upswing, and since there is just more than one month left before the year ends, it might be the case that they move north of the recent highs only in 2021.
Either way, miners’ inability to move above the 61.8% Fibonacci retracement level and their invalidation of the tiny breakout is a bearish sign.
The same goes for miners’ inability to stay above the rising support line – the line that’s parallel to the line based on the 2016 and 2020 lows.
Let’s proceed to metals themselves.

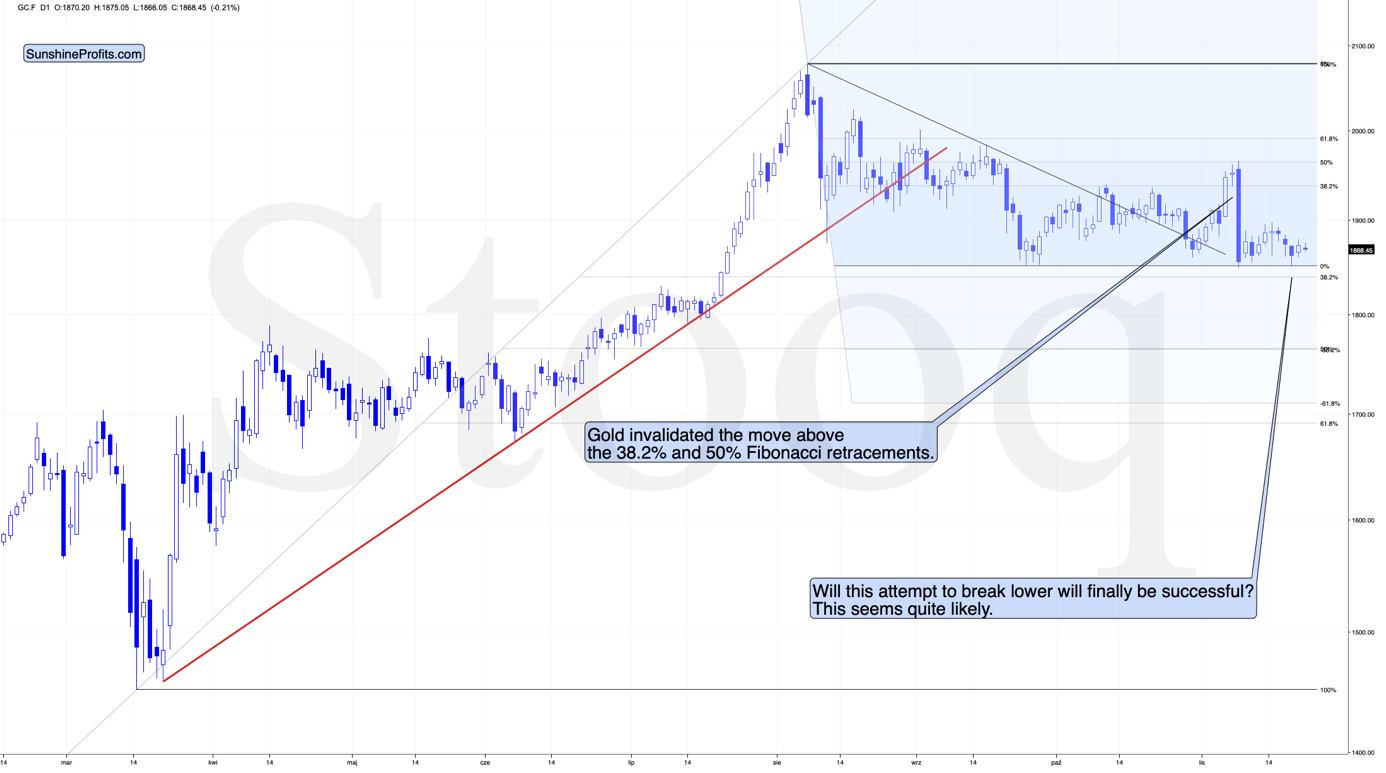
Just as miners, gold seems to be taking a breather. The breather was quite likely to occur after such a big daily (Nov 9th) decline, and there’s not much more that we can say about it per se.
However, the size of the counter-trend rally is quite interesting when we compare it to the size of the corrective upswing in silver.
Please note that gold is more or less in the midway between the bottom and the 38.2% Fibonacci retracement based on the August – November decline.
Silver, on the other hand, was much higher in relative terms.

In fact, last Monday (Nov 16th), silver even moved slightly above the 38.2% Fibonacci retracement.
What does it mean? It means that silver was outperforming gold on a very short-term basis. This might not be exciting to those who are new to the precious metals market, but it should be very exciting for those who have been following my analyses for some time. Silver tends to outperform gold on a short-term basis right before declines. Consequently, the above serves as a bearish confirmation.
Silver broke below the rising short-term support line since that time, which suggests that the days of the counter-trend rally are numbered. Based on the analogy to other U.S. election years, it seems that we won’t have to wait for long.
Thank you for reading our free analysis today. Please note that the following is just a small fraction of the full analyses that our subscribers enjoy on a regular basis. They include multiple premium details such as the interim target for gold that could be reached in the next few weeks. We invite you to subscribe now and read today’s issue right away.
Sincerely,
Przemyslaw Radomski, CFA
Editor-in-chief, Gold & Silver Fund Manager -
Gold Investment Update - Gold’s Decline is Written in the Charts
November 16, 2020, 11:41 AMIf history is any indicator, then patterns tend to repeat themselves and gold is no exception. The patterns emerging now are retracing events which followed in the wake of the 2016 presidential elections. As it’s taking a breather, bearish signs continue to point at gold being poised for a decline.
Overall, as the outlook remains bullish for the USD Index, it remains bearish for the precious metals sector. This is particularly the case if we take into account that recently, the Gold Miners Bullish Percent Index ($BPGDM) showed the highest possible overbought reading.

The excessive bullishness was present at the 2016 top as well and it didn’t cause the situation to be any less bearish in reality. All markets periodically get ahead of themselves regardless of how bullish the long-term outlook really is. Then, they correct. If the upswing was significant, the correction is also quite often significant.
Please note that back in 2016, there was an additional quick upswing before the slide and this additional upswing had caused the Gold Miners Bullish Percent Index to move up once again for a few days. It then declined once again. We saw something similar also this time. In this case, the move up took the index once again to the 100 level, while in 2016 this wasn’t the case. But still, the similarity remains present.
Back in 2016, when we saw this phenomenon, it was already after the top, and right before the big decline. Given the situation in the USD Index, it seems that we’re seeing the same thing also this time.
Please note that back in 2016, after the top, the buying opportunity didn’t present itself until the Gold Miners Bullish Percent Index was below 10. Currently, it’s above 70, so it seems that miners have a long way to go before they bottom (perhaps a few months – in analogy to how gold declined in 2016).

On Thursday (Nov 12th) and Friday (Nov 13th) of last week, miners moved and closed higher, but it’s important to note that their upswing was tiny and not accompanied by strong volume. In other words, it has all the characteristics of the breather that’s going to be followed by another move in the direction in which the market had been moving previously. The previous move was down, so the implications are bearish.
The intraday nature of Friday’s and Thursday’s moves is also quite informative. In both cases miners moved higher – just as gold did – but then they declined, erasing large part of the preceding gains before the end of the session. That’s yet another clue confirming the counter-trend nature of the recent upswing in the miners.
It seems that in the previous weeks, miners once again rallied in the manner that is similar to other sessions that we marked with blue ellipses on the chart.
In particular, what we saw in mid-September appears similar to what we see right now. Back then, the GDX ETF was also after a small breakout above its short-term, blue support line and the 50-day moving average. A relatively sharp short-term decline followed at that time, and the same seems likely also this time.
Also, let’s not forget that the GDX ETF has recently invalidated the breakout above the 61.8% Fibonacci retracement based on the 2011 – 2016 decline.

When GDX approached its 38.2% Fibonacci retracement, it declined sharply – it was right after the 2016 top. Are we seeing the 2020 top right now? This is quite possible – PMs are likely to decline after the sharp upswing, and since there is only less than two months left before the year ends, it might be the case that they move north of the recent highs only in 2021.
Either way, miners’ inability to move above the 61.8% Fibonacci retracement level and their invalidation of the tiny breakout is a bearish sign.
The same goes for miners’ inability to stay above the rising support line – the line that’s parallel to the line based on the 2016 and 2020 lows.
Thank you for reading our free analysis today. Please note that the following is just a small fraction of the full analyses that our subscribers enjoy on a regular basis. They include multiple premium details such as the interim target for gold that could be reached in the next few weeks. We invite you to subscribe now and read today’s issue right away.
Sincerely,
Przemyslaw Radomski, CFA
Editor-in-chief, Gold & Silver Fund Manager

Gold Alerts
More-
Status
New 2024 Lows in Miners, New Highs in The USD Index
January 17, 2024, 12:19 PM -
Status
Soaring USD is SO Unsurprising – And SO Full of Implications
January 16, 2024, 8:40 AM -
Status
Rare Opportunity in Rare Earth Minerals?
January 15, 2024, 2:06 PM
Dear Sunshine Profits,


