tools spotlight

-
The Subtle PMs Signals Keep Coming In
April 17, 2020, 7:48 AMThe greenback exerts powerful influence on the precious metals - that has been the case yesterday, and it unsurprisingly continues to be so also today. So, what message is the USDX sending out right now?
USD Index in the Spotlight
We'll open up with a quote from yesterday's Alert (by the way, please remember that all charts are expandable/clickable):
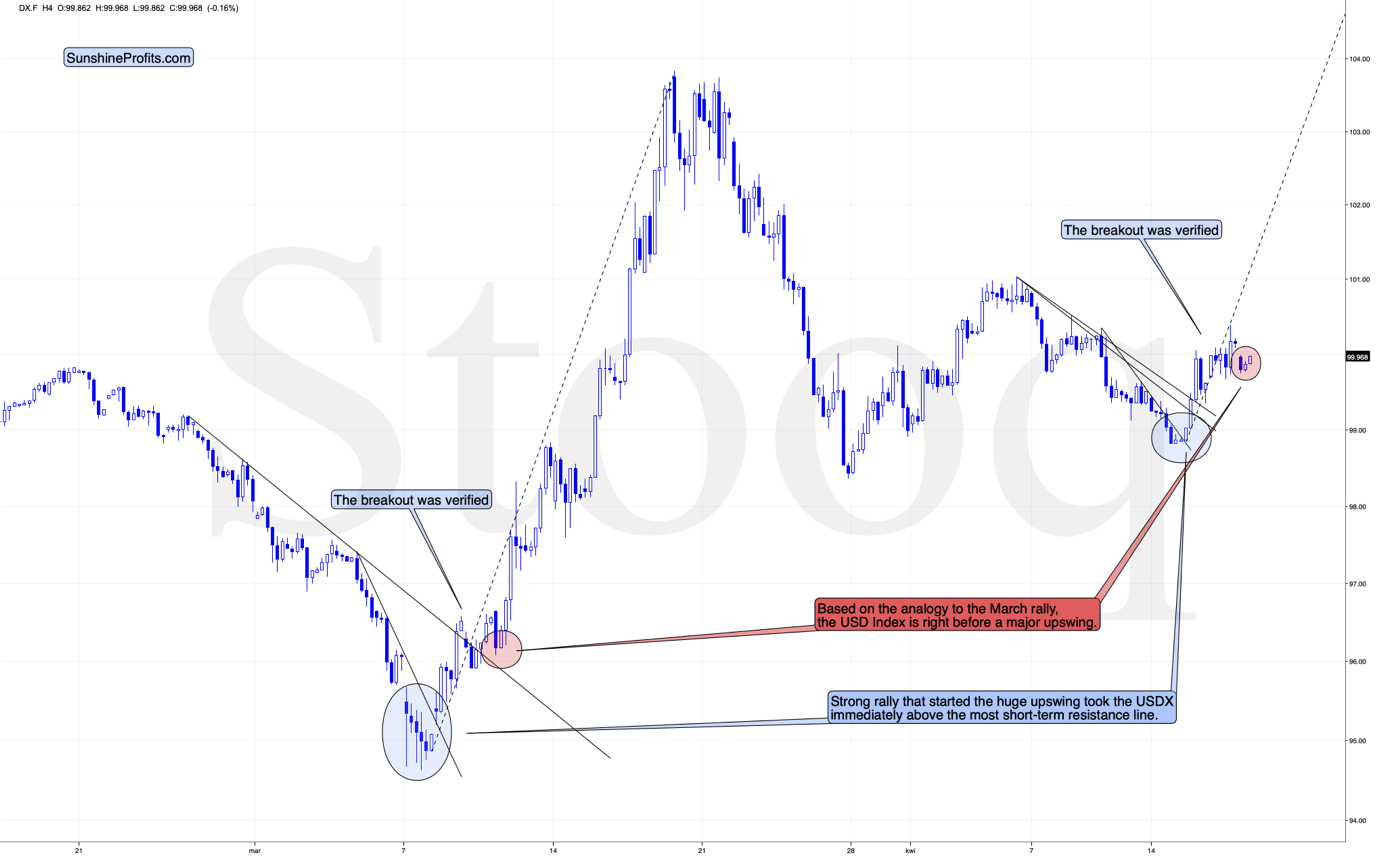
Looking at the 4-hour candlestick chart, we see that the USD Index just formed a reversal and is now testing the previous lows. There were very few 4-hour reversals in the recent days, but when we saw them, big and fast rallies followed. The early-March bottom is particularly similar to the current situation as the USD Index is - just like back then - after a visible decline, and the 4h reversal was followed by a re-test of the intraday low.
What happened next?

The USD Index moved below the intraday low of the reversal and then soared back up - exactly as it did in early March. And just like what it did back then, the USDX rallied immediately after the bottom and it did so in a sharp manner, especially right after breaking above the most short-term declining resistance line.
At the same time, the USD Index invalidated the small breakdown below the April 1st low.
Once the USD Index soars above the upper declining resistance line (currently at about 99.6) it will be relatively clear that the short-term bottom is already in and another big upswing has just begun.
That line will be the final short-term confirmation, though. The most important line is the one that the USX is testing right now. It's the one based on the April 6th and April 8th tops. Once the USDX breaks above it, the short-term odds will be on the bulls' side and it will be clearly visible for many traders, not only for those who pay attention to the price pattern analogies and are able to detect the bottoms earlier (such as us). It could be the case that when you read this, the breakout above this line is already confirmed.
And what happened in the following hours?

The USD Index has indeed broken above all declining resistance lines. And it gets better - the USDX didn't just break below those lines. It then pulled back, verified the previous resistance lines as support and then moved higher once again. That's the perfect breakout, which makes the outlook clearly bullish, and very similar to what happened around March 10.
The back and forth movement that we've seen in the last several hours - below the previous highs, but also above the recent lows - makes today similar to what we saw on March 12th - right before the powerful run-up. After we created the above chart, the USDX moved above 100 once again, which seems to be confirming the similarity. Still, we wouldn't rule out another final short-term pullback before the true rally is seen. In practice, it means that we might see the big run-up today - but even if we won't see it today, we'll very likely see it (probably early) next week.
The implications for the precious metals market are very bearish.
Silver Breaks Down

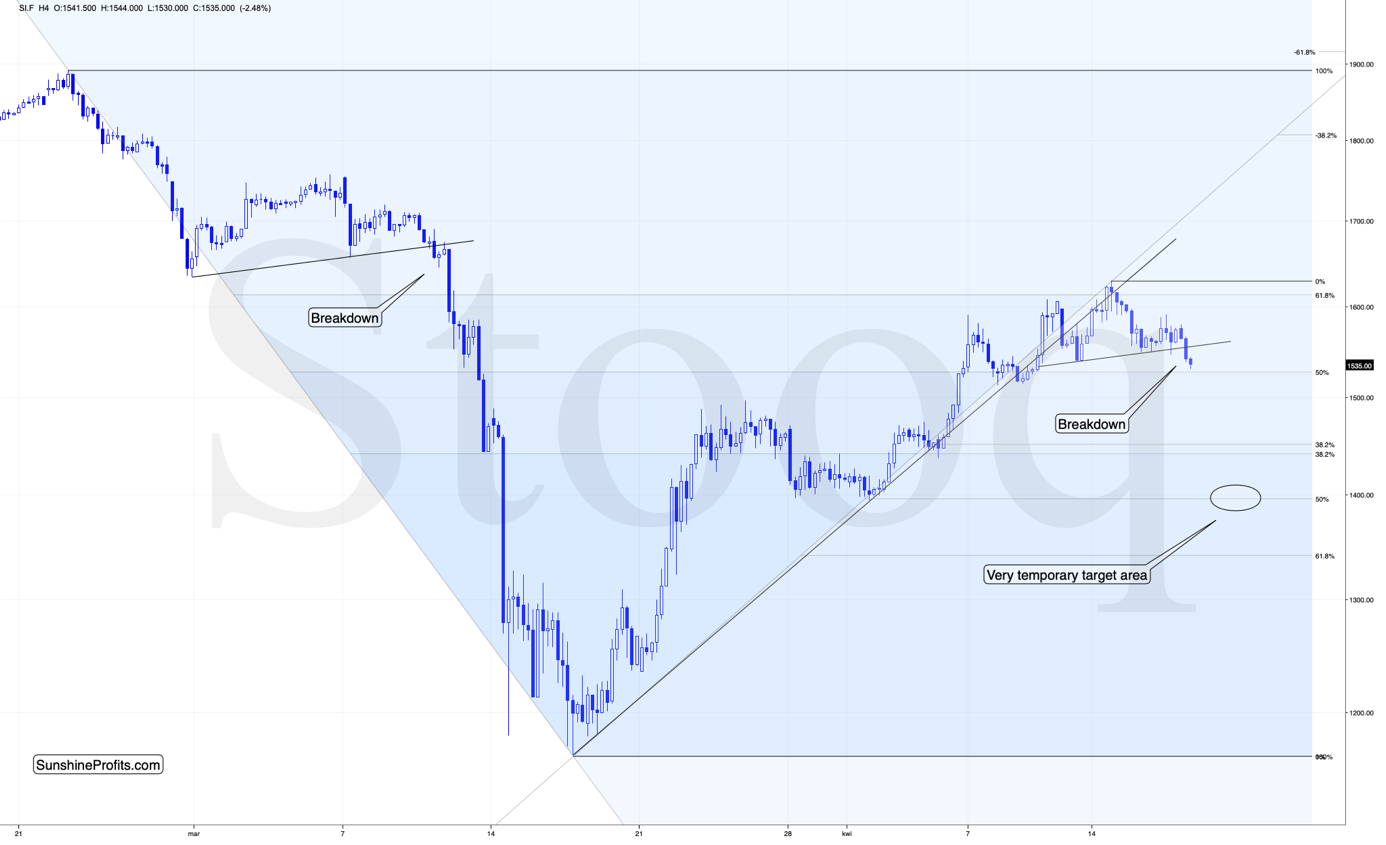
Silver just broke below the rising support line, and has been verifying this breakdown for the past few hours. That's perfectly normal and it doesn't make the situation bullish. Conversely, each passing hour without invalidation of the breakdown is another point for the bears. Back in March, similar consolidation after the breakdown was the final pause before the big declines.
Is the history repeating itself here? This seems quite likely, especially given that the similarity that we're describing, took place on March 12 - exactly the same day when the USD Index was performing similarly to its today's performance. History repeating itself to a considerable degree is one of the foundations of the technical analysis, and the key factor behind key precious metals trading tips.
Moreover, let's keep in mind that silver is already after a confirmed breakdown below the rising support line. The implications are strongly bearish.
Thank you for reading today's free analysis. The full version of today's analysis includes details of our currently open position as well as targets of the upcoming sizable moves in gold, silver and the miners.
-
Junior Miners to Take a Ride to Much Lower Values
April 16, 2020, 9:44 AMYou surely expect us to talk gold right now. But we're bringing you a highly surprising and interesting non-gold chart today - and do so precisely because it carries profound implications for the yellow metal.

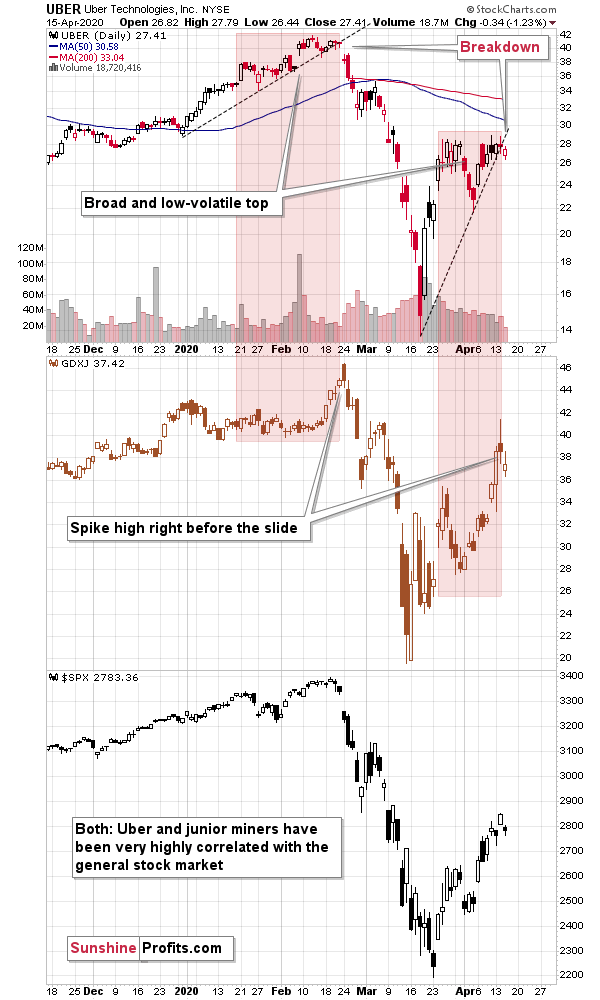
It's UBER (upper part of the chart) compared with the prices of junior mining stocks (middle of the chart).
But why?
Both have very little in common as far as business specifics are concerned, but what makes this comparison useful is that they both move in great tune with the general stock market (bottom of the chart).
If you had just one second to look at the above chart, you'd probably say that it features the same thing three times - they are so similar.
Despite this similarity, there's something very interesting that differentiates them with regard to the shape of their price moves. It's how they form tops. UBER is less volatile and it's forming broad tops. Junior miners are volatile, and they rally before topping. We saw both performances in February. UBER was moving back and forth at relatively elevated levels, and when it finally broke below its rising support line, all hell broke loose even though it was not clear right after the breakdown. Juniors, on the other hand, spiked high and reversed in a profound manner.
And what did we see this month? Exactly the same thing. UBER formed a broad top while junior miners spiked higher, and ended the rally with a clear reversal.
What's more, UBER just broke below its rising support line, indicating that all hell just broke loose. And just like it was the case in late February, it's not clear just yet. Interestingly, we saw low volume yesterday, and we saw relatively low volume also on February 21st.
The implications for the entire trio: UBER, general stock market, and the junior mining stocks are very bearish. And since it's very unlikely that juniors will decline without a decline in the PMs and senior miners, the implications are bearish for them as well.
Thank you for reading today's free analysis. The full version of today's analysis includes details of our currently open position as well as targets of the upcoming sizable moves in gold, silver and the miners.
-
PMs - Ready, Steady, Go
April 15, 2020, 10:00 AMIt's certainly a safe bet to say that gold and the dollar don't move in random ways. That's an understatement as the USD moves exert great influence on the yellow metals' prices, like it or not. The changing strength and direction of their relationship is a telling factor, so it pays off to ask what message it's sending these days.
On April 6th, we wrote that gold could first rally to or slightly above its 2020 high and decline in a volatile manner shortly thereafter. The former has already taken place, and now it seems that the latter will take place.
Since the USD Index is such an important piece of the puzzle, let's take a look at its charts.
More on the USD Index and Gold

You already saw the most important USD Index chart 2 charts ago - the USDX is after a major, long-term breakout that was confirmed a few times, so it's now in a strong long-term uptrend. Let's keep in mind that it doesn't mean that the situation in the US is perfect - it means that it's better than in other territories - mostly in the EU and Japan. And that does seem to be the case.
Having said that let's take a look at the above chart. Quoting our previous comments on it appears justified as practically all the long- and medium-term points remain up-to-date.
The USD Index was previously (for the entire 2019 as well as parts of 2018 and 2020) moving up in a rising trend channel (all medium-term highs were higher than the preceding ones) that formed after the index ended a very sharp rally. This means that the price movement within the rising trend channel was actually a running correction, which was the most bullish type of correction out there.
If a market declines a lot after rallying, it means that the bears are strong. If it declines a little, it means that bears are only moderately strong. If the price moves sideways instead of declining, it means that the bears are weak. And the USD Index didn't even manage to move sideways. The bears are so weak, and the bulls are so strong that the only thing that the USD Index managed to do despite Fed's very dovish turn and Trump's calls for lower USD, is to still rally, but at a slower pace.
We previously wrote that the recent temporary breakdown below the rising blue support line was invalidated, and that it was a technical sign that a medium-term bottom was already in.
The USD Index soared, proving that invalidation of a breakdown was indeed an extremely strong bullish sign.
Interestingly, that's not the only medium-term running correction that we saw. What's particularly interesting is that this pattern took place between 2012 and 2014 and it was preceded by the same kind of decline and initial rebound as the current running correction.
The 2010 - 2011 slide was very big and sharp, and it included one big corrective upswing - the same was the case with the 2017 - 2018 decline. They also both took about a year. The initial rebound (late 2011 and mid-2018) was sharp in both cases and then the USD Index started to move back and forth with higher short-term highs and higher short-term lows. In other words, it entered a running correction.
The blue support lines are based on short-term lows and since these lows were formed at higher levels, the lines are ascending. We recently saw a small breakdown below this line that was just invalidated. And the same thing happened in early 2014. The small breakdown below the rising support line was invalidated.
Since there were so many similarities between these two cases, the odds are that the follow-up action will also be similar. And back in 2014, we saw the biggest short-term rally of the past 20+ years. Yes, it was bigger even than the 2008 rally. The USD Index soared by about 21 index points from the fakedown low.
The USDX formed the recent fakedown low at about 96. If it repeated its 2014 performance, it would rally to about 117 in less than a year. Before shrugging it off as impossible, please note that this is based on a real analogy - it already happened in the past.
In fact, given this month's powerful run-up, it seems that nobody will doubt the possibility of the USD Index soaring much higher. Based on how things are developing right now, it seems that the USD Index might even exceed the 117 level, and go to 120, or even higher levels. The 120 level would be an extremely strong resistance, though.
Based on what we wrote previously in today's analysis, you already know that big rallies in the USD Index are likely to correspond to big declines in gold. The implications are, therefore, extremely bearish for the precious metals market in the following months.
On March 23rd, we wrote that the USD Index was ripe for a correction, and that was indeed the case.
However, a few weeks passed, and the USD Index now appears to be ready for another powerful upswing.
We saw the first very strong short-term signs of it yesterday. Here's what we wrote:
Speaking of early March... The USD Index just did something that it also did back then.

Looking at the 4-hour candlestick chart, we see that the USD Index just formed a reversal and is now testing the previous lows. There were very few 4-hour reversals in the recent days, but when we saw them, big and fast rallies followed. The early-March bottom is particularly similar to the current situation as the USD Index is - just like back then - after a visible decline, and the 4h reversal was followed by a re-test of the intraday low.
What happened next?

The USD Index moved below the intraday low of the reversal and then soared back up - exactly as it did in early March. And just like what it did back then, the USDX rallied immediately after the bottom and it did so in a sharp manner, especially right after breaking above the most short-term declining resistance line.
At the same time, the USD Index invalidated the small breakdown below the April 1st low.
Once the USD Index soars above the upper declining resistance line (currently at about 99.6) it will be relatively clear that the short-term bottom is already in and another big upswing has just begun.
That line will be the final short-term confirmation, though. The most important line is the one that the USX is testing right now. It's the one based on the April 6th and April 8th tops. Once the USDX breaks above it, the short-term odds will be on the bulls' side and it will be clearly visible for many traders, not only for those who pay attention to the price pattern analogies and are able to detect the bottoms earlier (such as us). It could be the case that when you read this, the breakout above this line is already confirmed.
How could the above translate into a gold price prediction?
The 2008 USD - Precious Metals Lesson

Please note what triggered the final decline in gold, silver, and mining stocks. It was the continuation of the rally in the USD Index. The first part of the decline in gold took place when the USD Index was rallying, and it soared back up when the USDX corrected.
Interestingly, the yellow metal ignored the first (late-September) rally in the USD Index and gold topped once the USD Index paused, likely based on the assumption that the USDX uptrend was already over at that time.
We saw something similar right now. Gold generally ignored USD's early-April upswing. When the USD Index corrected, gold soared, likely based on the assumption that the USDX uptrend was already over.
Right now, the USD Index seems to have started to take off once again. And this time, gold is reacting to it - just like it did in early October 2008. At the moment of writing these words, the USD Index is up by 0.55%, while gold is down by 1.83% (over $30). This may not seem much, but it's the biggest intraday decline in gold that we saw this month. And there are still a few hours left before the markets open in the US today. Also, silver is down by 3.3% and it just - once again - invalidated the breakout above $16.
As the USD Index rally unfolds, the precious metals market is likely to slide, just like it did in 2008.
Thank you for reading today's free analysis. The full version of today's analysis includes details of our currently open position as well as targets of the upcoming sizable moves in gold, silver and the miners.
-
The Brewing Moves in Gold and the Miners
April 14, 2020, 7:00 AMAvailable to premium subscribers only.
-
Special Week-end Gold & Silver Trading Alert
April 11, 2020, 10:09 PMAvailable to subscribers only.
Gold Investment News
Delivered To Your Inbox
Free Of Charge
Bonus: A week of free access to Gold & Silver StockPickers.
Gold Alerts
More-
Status
New 2024 Lows in Miners, New Highs in The USD Index
January 17, 2024, 12:19 PM -
Status
Soaring USD is SO Unsurprising – And SO Full of Implications
January 16, 2024, 8:40 AM -
Status
Rare Opportunity in Rare Earth Minerals?
January 15, 2024, 2:06 PM


