

-
Is the Waterfall in S&P 500 Over Now?
June 15, 2020, 6:06 AMAfter Thursday's blood bath, Friday's recovery fizzled out, new weekly lows were made and as well rejected - where next in this correction? Given the preceding momentum, I would look for some more down-to-sideways action before the upswing reasserts itself. Despite the late-Friday's encouraging signs, I wouldn't call the correction finished yet. But first things first - what's the outlook and my game plan?
S&P 500 in the Medium- and Short-Run
I'll start today's flagship Stock Trading Alert with the weekly chart perspective (charts courtesy of http://stockcharts.com ):

A profound bearish weekly candlestick on solid volume - but is this really a reversal of the stock market fortunes? Look how far prices declined, yet how relatively little moved are the weekly indicators - this goes to show the downswing would likely turn out as a temporary setback in a firmly established stock bull run.
How much follow-through selling could we get and will the support at 50-week moving average (which roughly corresponds to the 200-day moving average on the below daily chart) keep holding?
Let's see the daily chart for more details.

The first impression is that the resolution of the bearish wedge breakout invalidation and island top reversal likely has longer to play out before it's over. Sure, the downswings during this young bull run have been no protracted events, but comparing the sharpness of Thursday's move with preceding occasions makes it reasonable to look for this one to run a tad longer.
The above-mentioned 200-day moving average withstood the selling pressure also on Friday, but if it is broken, the next in line is the 61.8% Fibonacci retracement at roughly 2940, followed by the 50-day moving average just above 2900 and finally the 50% Fibonacci retracement at around 2790.
I say finally because given the technical and fundamental circumstances, I don't expect the correction to reach farther, let alone this low. In terms of the price decline, we might very well be more than halfway through already - that's the scenario I consider most likely, and the reason why I grabbed the almost 50-point profit off the open short position off the table earlier today.
What if Friday's sizable lower knot shows that the buy-the-dip mentality market has decided, enough of the downside? While the daily volume has been respectable, absent a clear bullish gap on Monday, it might not have been enough in staving off further downside, which I look for to go on some more, in terms of time as a minimum.
But the following argument can be made in favor of the correction drawing near its end - I'll expand upon these arriving comments:
(...) I watched HYG today but it did not follow SPX down below yesterday's low. It looked like it wanted to go up instead and finally SPX gave in and followed HYG up. Also many beaten down stocks did not follow SPX down. They held their position pretty firmly indicating buyers are busy picking up beaten down stocks with good breadth. Based on these movements, I agree with your view that markets rather grind up than go down. Going up slowly is probably healthier than going up fast. Parabolic rise always end up with a hiccup.
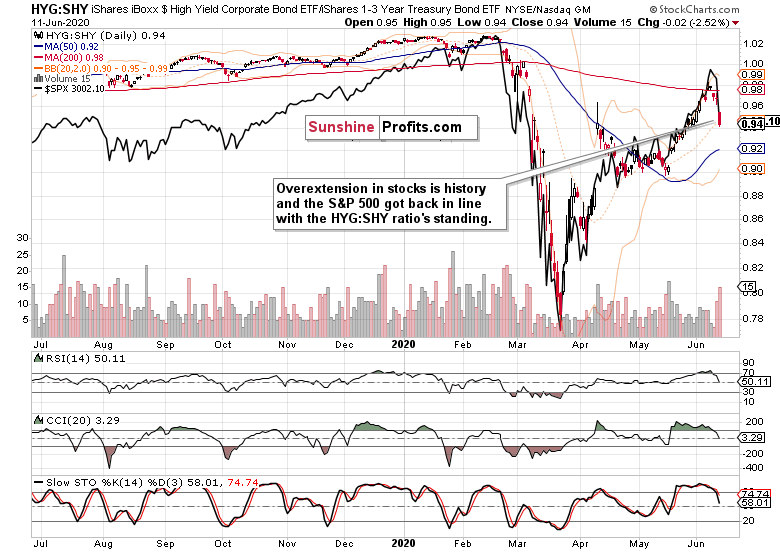
I've been watching this credit market metric and its ratios as well, and at the intraday stock market low just above 2980, the HYG ETF has been lagging behind (i.e. not trading below its daily low). The question became who would lead each other - after all, one or the other can move first though it's the bond guys who are mostly proven right in the end. In other words, would corporate bonds catch up on the downside, or stocks stop declining as a minimum?
The session's close showed that the debt markets were right on that day, and the following chart shows the daily stabilization vividly:

When I look at the market breadth indicators, the daily stabilization thanks to the runup to the closing bell in stocks, is apparent:

The advance-decline line isn't really far off its daily highs, and importantly, even on a weekly basis, it hasn't declined much from the highs reached during the breakout above the bearish wedge on surprisingly strong non-farm payrolls data.
Coupled with the bullish percent index being solidly in the bullish territory, it shows that there might not be all that much to go in this correction in terms of prices, as a deeper slump would likely attract more buying power than has been the case so far. As well, market players probably expect the correction to be a more drawn-out event rather than a single day out of the ordinary, before the selling exhausts itself.
One more point, it would be better for the stock bull market health if the correction took a little longer to play out. The sentiment has been turning very bullish (and it could be felt reading my articles as well), and the gradually quickening pace of staircase-higher values proved the assessment right.

The daily volatility measure shows that a new phase started two days ago as the VIX has broken above its declining resistance line formed by the April and May tops. Another way to look at it would be to say that it had broken above its falling wedge (which is a bullish) pattern.
Similarly steep upswings have taken more time to play out, making it reasonable to expect some more volatility before things die down again. That's why I think that Friday's S&P 500 session will turn out a temporary lull and not the end of the correction at all.
Working out the excessive bullishness that accompanies local tops, would serve to build a base for the next upleg, and making a higher low would go a long way towards that. That's another reason why I'm not really looking for stocks to break below the 50% Fibonacci retracement as that would send kind of a different signal.
Having addressed the comment and gone into ratios, let's cover the credit market basics.
The Credit Markets' Point of View

High yield corporate bonds (HYG ETF) didn't move below Thursday's lows, but their daily downswings attracted fresh waves of selling in stocks nonetheless. The question still remains whether bonds are showing temporary strength or a local bottom in stocks being made - for the above reasons though, I think there's some more consolidation ahead in this asset class as well for the time being.

But the corporate grade corporate bonds (LQD ETF) hint that we better not expect too much of a downside move to happen still. Solidly trending higher, they're more resilient than their junk counterparts.
Key S&P 500 Sectors in Focus

Technology (XLK ETF) also broke to new local lows on Friday, and finished retracing a similar portion off Thursday's closing prices as the S&P 500 did. This can be taken as a sign that this leading sector isn't yet taking the index out of its slump, and that the correction is still likely to carry on.
Tech's sizable volume though shows solid buying interest, indicating that the scope for further downside is probably limited.

Healthcare (XLV ETF) doesn't paint as bullish a short-term picture. Having closed not too far above its Thursday's prices and on not-so-equivalent volume, shows that the sector is in rougher waters, relatively speaking.

Financials (XLF ETF) volume examination is similar to that of healthcare, but the price action is more bullish in a likewise short-term comparison.
Coupled with the broadly similar Friday performance in energy (XLE ETF), materials (XLB ETF) and industrials (XLI ETF), paints signs of short-term index stabilization, and gives neither the odds of a coiled S&P 500 spring ready to just jump higher, nor of another slump the next day.
The sectoral analysis implications are rather neutral, and I would rely more on the volatility, market breadth and especially credit markets here - I read their message as one favoring the consolidation still to go on before another upleg.
Summary
Summing up, the jury is still out on whether Friday's session brought us a local low or not, but the signs of short-term stabilization are apparent already. Still, the volatility examination shows that all the downside action might not be over just yet, despite the daily positive signals from the credit markets, smallcaps (IWM ETF) or market breadth. As a minimum in time, this correction has further to go before the selling pressure of Thursday's caliber and momentum can be deemed exhausted, and the S&P 500 ready for another run higher.
-
Was Yesterday's S&P 500 Plunge a Game Changer?
June 12, 2020, 10:35 AMPost-Fed selling took on a life of its own yesterday - so far so good, but isn't the downswing getting a little ahead of itself? Today, it's primarily the credit and debt markets that will shed more light. And what about today's inflation expectations and consumer sentiment data - will they drive more selling yet?
S&P 500 in the Short-Run
Let's start with the daily chart perspective (charts courtesy of http://stockcharts.com ):
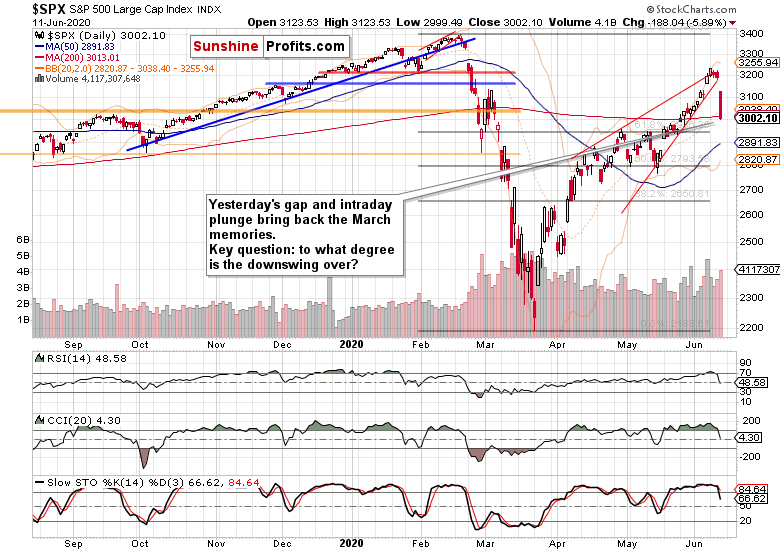
A red candle from an era not-so-long ago gone, might be one's first idea. Rightfully so, the volume has risen with yesterday's selling as well. Likewise, the daily indicators are on their sell signals now. We saw invalidation of the breakout above the red bearish wedge, and also an island reversal - all of these are very bearish signs.
Yet, the rightful question to ask would be how much follow-through selling will we get before the bulls step in. The vacuum they've left has been a profitable one, bringing in a 40-point gain in much less than 24 hours.
The overnight rebound struggles in the 3050-3070 range so far, and given that the inflation expectations will come in still elevated in my opinion, that makes for an interesting dynamic.
Anticipation of higher price tags downs the road could leave some market participants thinking that the Fed will turn less active in its monetary policy stance, exerting short-term pressure on stocks that wouldn't be balanced by the consumer sentiment coming in reasonably strong. That's the potential for a very short-term play.
The narratives driving yesterday's plunge haven't changed, and new ones haven't taken the market's short-term focus either. The Fed is here, and so is the fear of the second corona wave.
However, stocks are largely disregarding that, and every dip earlier today, has been bought. This is making me think that we won't get much more short-term downside price action in stocks - unless fear truly returns and anyone having a handle on policy levers issues some stern warnings.
Let's check how attuned to the credit markets the stock downswing was.
The Credit Markets' Point of View
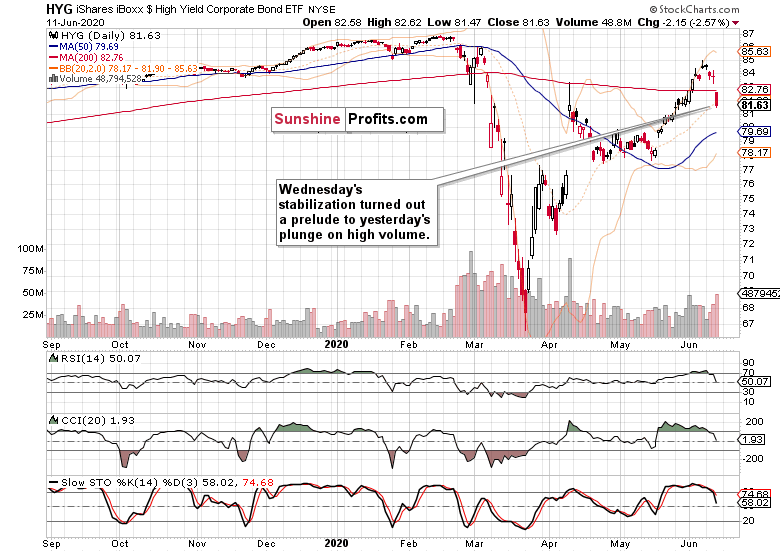
High yield corporate bonds (HYG ETF) declined profoundly after their deceptively stable performance on Wednesday. The move down happened on sizable volume, closing near the daily lows, which is a pretty bearish combination.
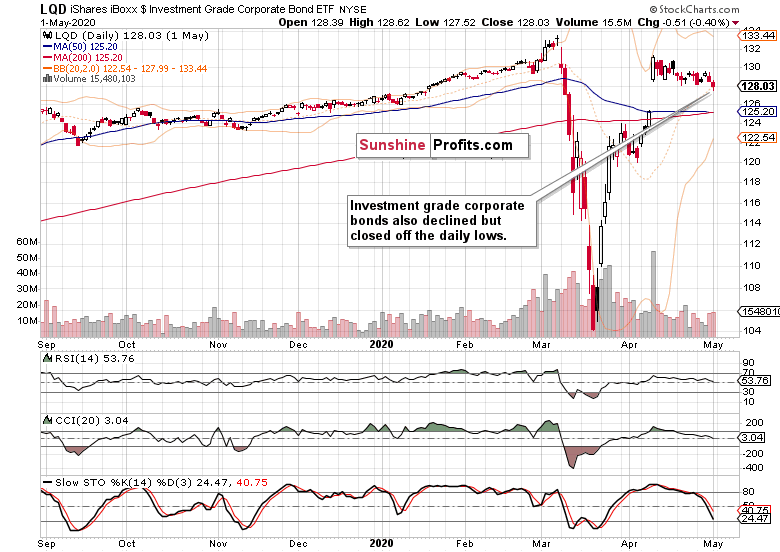
Investment grade corporate bonds (LQD ETF) fared better as they staged a partial rebound off the daily lows. Also, it can't be really said they're breaking down here.
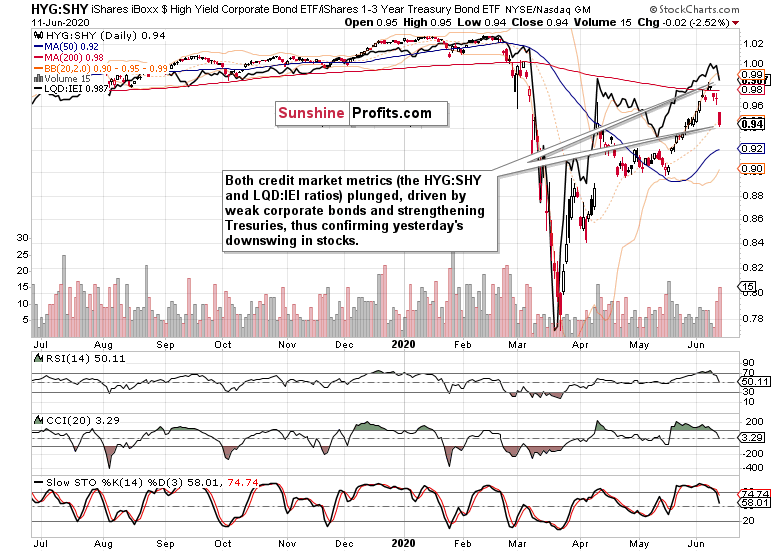
Naturally, both leading credit market ratios (HYG:SHY and LQD:IEI) confirm each other's moves, with the more risk-on one (HYG:SHY) having fallen faster. This just goes to show the extent of where the risk-off pendulum has swung with yesterday's S&P 500 move.
Today's premarket action in stocks shows that corporate bonds won't probably continue much lower later today. How would their stabilization reflect upon stocks?
It appears that we've seen more panic in the credit markets than in stocks actually. And the fact that the S&P 500 hasn't fallen further given such bearish catalysts, is a subtle sign of internal strength in stocks, regardless of any short-term patterns that can justifiably lure the bears to sell.
I think that stocks are telling us here that they don't care about corona (at this point), China, riots - it's only the Fed's money spigots. The moment corporate credit recovers, we'll have it confirmed - otherwise stocks would be just too slow to get it. But they're not again declining with vengeance, which is promising for the bulls.
That's why I expect this sharp panic selling to be followed by short-term stabilization with an upside bias, perhaps a failed selling attempt next, and finally with the measured grind higher resumption.
Mid-June, I think it's too early for stocks to worry about second corona wave on a continuous basis. Staying nimble in a similarly fluid situation is the right short-term course of action.
Summary
Summing up, yesterday's steep stock selloff didn't follow during the overnight session, and the signs of short-term stabilization are present. We might have seen the local bottom yesterday. The narrative of reopening optimism has been challenged by yet another down-to-earth Fed real economy assessment and returning coronavirus fears - but look how well stocks recovered when Fed governors last spoke (Powell at Peterson Institute in mid-May). Coupled with the expected recovery in the credit markets, this positions the stock bulls to dust themselves off and gradually continue higher - regardless of the rising wedge breakout invalidation or island top reversal we saw yesterday.
If you enjoyed the above analysis and would like to receive daily premium follow-ups, I encourage you to sign up for my Stock Trading Alerts to also benefit from the trading action described - the moment it happens. The full analysis includes more details about current positions and levels to watch before deciding to open any new ones or where to close existing ones.
Thank you.
Monica Kingsley
Stock Trading Strategist
Sunshine Profits: Analysis. Care. Profits.
Free Gold &
Stock Market Newsletter
with details not available
to 99% investors
+ 7 days of Gold Alerts
Gold Alerts
More-
Status
New 2024 Lows in Miners, New Highs in The USD Index
January 17, 2024, 12:19 PM -
Status
Soaring USD is SO Unsurprising – And SO Full of Implications
January 16, 2024, 8:40 AM -
Status
Rare Opportunity in Rare Earth Minerals?
January 15, 2024, 2:06 PM

