tools spotlight

-
Making the Case for Lower Prices in the Miners
May 14, 2020, 8:57 AMSome are really simple and casual. Some are intense and intimate. Some blossom, while other deteriorate over time. Some make one a better person, and some drag one straight to hell.
Relationships.
And yes, we didn't mix-up headers in today's analysis. Relationships are the foundation of social life, and probably the single most important factor that impacts peoples' happiness. And you know who ultimately creates markets? People. People are making decisions to buy or sell (or to program algorithms that do). Since relationships are so important and ubiquitous in each individual's life, is it any wonder that we can spot them also in the markets?
In case of the precious metals market, we have quite a few such relationships, or how we quite often call them - links. Some market relationships are simple and straightforward. Senior mining stocks (producers) and junior mining stocks practically always move together, for example. Other relationships are inverse but not as straightforward, like the one between gold and the USD Index. Or the one between gold and silver.
Oh yeah, right, some markets move together and some move in the opposite directions, but so what? - one might ask, and rightfully so.
If one stops their analysis by simply acknowledging the above, it won't matter much. It won't help in determining the direction in which the market is likely to move. Those, however, who dig deeper in the way prices move relative to each other, might be able to discover some specific clues that will make one outlook much more likely than the other.
The real-world example would be a couple that mutually respect each other, and one can tell that by the way they are looking at each other and the words they use toward each other. That's "bullish" for this relationship. On the other hand, one might detect tiny signs of contempt in the facial micro-expressions of one of the partners while the other talks or does something. That would "make the outlook bearish" for the relationship. And at first sight, both couples would just be talking and sometimes have better or worse days.
In today's analysis, we'll guide you through some of the most important relationships in the precious metals market. These gold trading tips are worth keeping in mind as they work on their own, as well as together with other techniques (in combination with them).
Let's start with the relationship between gold and the USD Index. We previously wrote that this link is inverse, but not particularly straightforward. With regard to the inverse direction in which they move, the explanation is simple. Gold is generally priced in the US dollar, so it cannot move entirely independently from it. Of course, the link goes deeper than just that, for instance, a given move in interest rates usually affects the USD and gold adversely. Gold doesn't pay interest by itself (not many people reported tiny bars popping up next to bigger bars just like that), but the USD does. If the rates go very low (or negative), there is little incentive to hold paper dollars, and there is a big incentive to buy gold, as it's performing very well during hyperinflationary periods, and during stagflation.
On the short-term basis, however, things don't have to work as outlined above. Traders might focus on something else than the above fundamental principles, like extreme fear of economic collapse - just like what we saw in March 2020 and in 2008. During such times, both markets are still likely to move inversely, but the moves might not match exactly.
Instead, on a very short-term basis, the markets might focus - and have been doing so - on technical developments, such as breakouts and breakdowns in the other market. In particular, gold has been more interested in USD's breakouts and breakdowns, than it's been in its price moves at their face value.
USDX Signs for Gold and the Miners
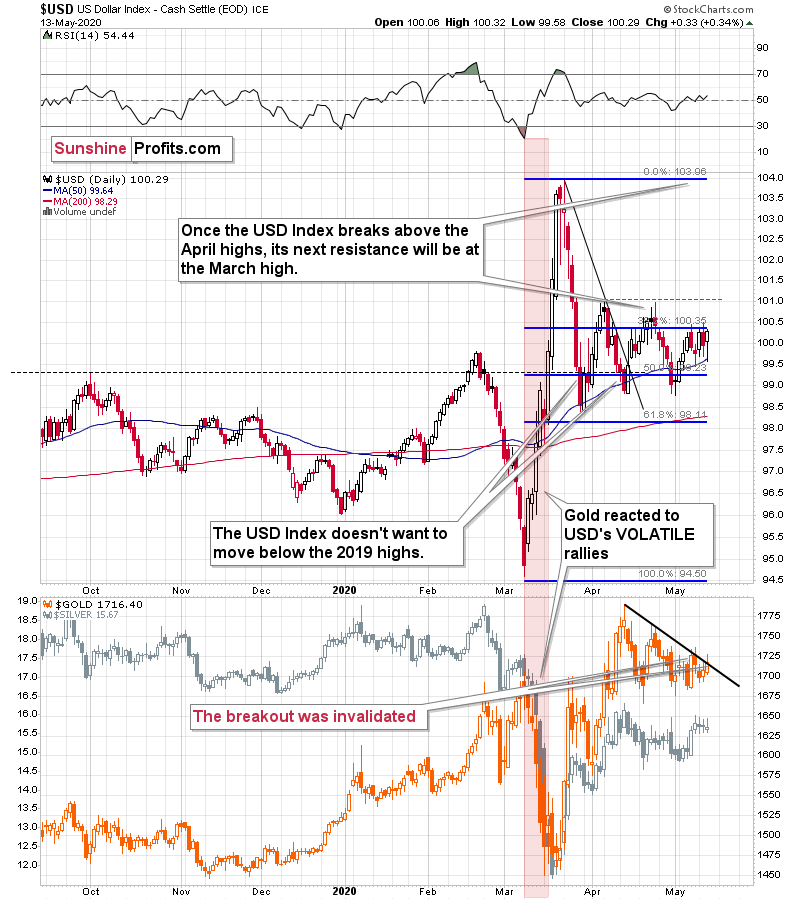
Please consider the last few (April and May) tops in the USD Index. Gold (in the lower part of the above chart) rallied particularly significantly right after the USDX topped - not during its declines.
The USD Index just seemed to have topped earlier this month, and what did gold do? It soared - quite likely based on the expectation that the USD is going to decline, just like what it did twice in April. When instead of declining, the USDX moved back up, gold erased almost the entire daily gain. As the USD Index consolidates without a breakout, traders seem to be increasing their bets on the downturn in the US currency.
Will they be proven correct? In our view, is likely that the USD Index will soar - if not right away, then shortly. It's after major technical breakouts, and the Covid-19 situation is getting much worse for the developing / BRIC countries, which is likely to trigger demand for the US dollars.
Let's keep in mind that back in 2008 (and the current situation is still very similar to 2008 i.a. due to the sudden nature of the crisis) the final slide in gold started when the USD Index rallied decisively, breaking above the previous highs.

Back then, gold more or less ignored the earlier USDX gains, but when it finally broke higher, gold plunged, just as if it was catching up with the declines that it ignored previously.
The USD Index has been trading back and forth for several weeks now without a meaningful breakout whatsoever. Perhaps the confirmed breakout above the 101 level will be what triggers the first part of what we think is going to be the final washout slide in the precious metals market.
All in all, we can say that the implications of the relationship between gold and the USD Index appear bearish for gold at this time.
There's one more relationship that we would like to feature today. It's the one between gold and gold stocks. It should be really straightforward. Gold producers produce gold, so if the price of gold is going up, the value of the shares of said gold producers should move up as well. And it does work in this way, but it's not that straightforward as one would think.
For instance, as gold is right now over $300 above its 2016 high, one would expect prices of gold stocks - on average - to be well above their recent 2016 highs as well, right? Especially that due to lower crude oil prices now vs. in 2016, their operational costs should be viewed as lower.
The chart below features gold stocks' performance since late 2015.
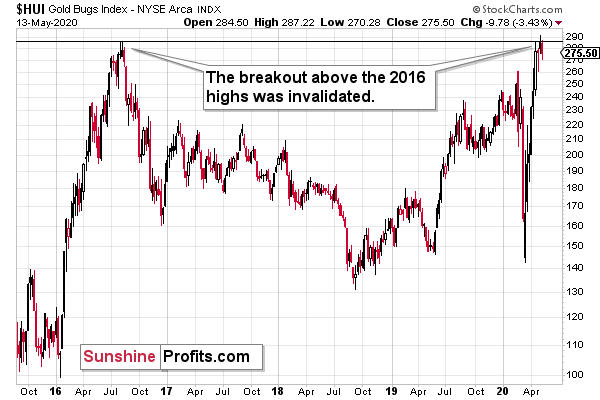
Instead of rallying well above their 2016 highs, they recently attempted to just move above them... And - despite gold being above $1,700 - they actually failed to break higher. The small breakout was quickly invalidated, which shows that something might not be right in case of the precious metals market.
In case of gold - USDX link, we saw that gold reacts with particular sensitivity to USD's technical developments. In case of the gold - gold stocks link we have a different kind of detail. This detail is that mining stocks tend to stop reacting to gold's bullish (or bearish) lead before the trend reverses. This doesn't happen in all cases, but it happens often enough to be viewed as very important detail for one to be on the lookout for.
Remember THE 2011 top in gold? The HUI Index formed the initial high in December 2010 (598) and moved only about 7% higher above this top in August 2011, despite gold's 30%+ gain during the same time. This kind of link also worked on numerous occasions on a short-term basis.
What does this link tell us now?
To make the comparison more reliable, we'll use the GLD ETF as a proxy for gold and we'll use the GDX ETF as a proxy for mining stocks - so that the opening and ending hours of the sessions are identical.
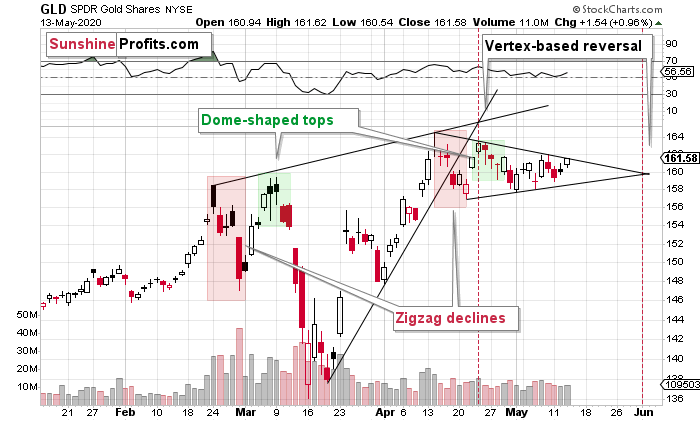
GLD just moved higher yesterday, and that was the highest daily closes of May.
And the GDX?
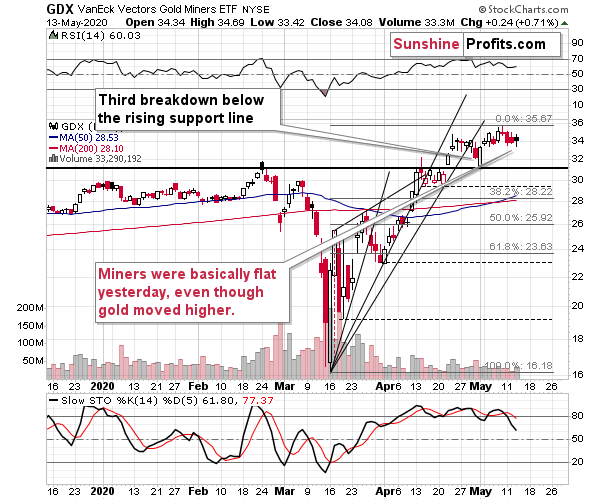
The GDX did almost nothing yesterday. It moved a bit higher, but yesterday's close was still almost 3% below the highest close of this month. What does it tell us?
It's a sign that gold is likely topping here. The 2011 example showed a much more profound top than the one that we likely see right now. After the 2011 high, gold declined for years, and given the looming stagflation, gold is unlikely to decline for long. If the upcoming decline is likely to be short, then a more short-term topping signal seems to be an appropriate trigger. And that's what the very recent GDX performance provides.
Consequently, even despite the very positive outlook for gold for the following years, it seems that it will still decline in the following weeks. Naturally, this gold forecast is based on more factors than just the two intra-market relationships that we discussed today, but they serve as a good confirmation of the bearish outlook.
Thank you for reading today's free analysis. In the full version of the analysis, we also feature our preferred way of taking advantage of the current situation and the analogies to the previous price moves.
Subscribe at a discount today and read today's issue ASAP.
Sincerely,
Przemyslaw Radomski, CFA
Editor-in-chief, Gold & Silver Fund Manager -
Will Stocks Lead the Way Lower for Miners?
May 13, 2020, 5:20 AMThe precious metals market did almost nothing yesterday, and consequently we have relatively little to comment on today. There are two subtly bearish signs that we would like to feature, nonetheless.
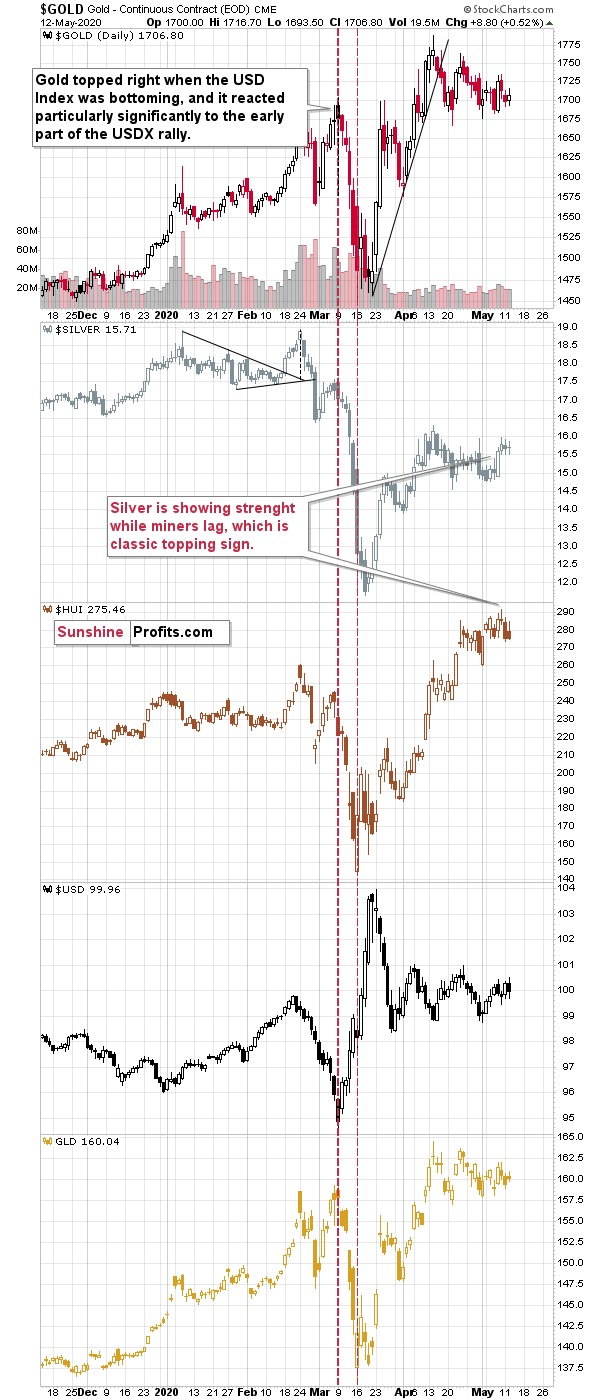
The first subtly bearish sign is the change in the way the USD Index "topped" this month. In early April, and then in late April, the USDX reversed close to the 101 level and then moved lower in a decisive way, until declining below 99. This time has already proved to be different.
In early May, the USDX reversed and declined a bit, but instead of continuing its decline in the following days as it used to do in April, the US currency moved back up, and touched its previous highs. The shape of the decline is clearly different, so perhaps the outcome will be different as well. Perhaps instead of a move below 99, we'll finally see a confirmed breakout above 101.
Again, it's a relatively subtle indication, but still something that we noticed yesterday. Other factors that we discussed in the previous days are more important.
The second small sign is the mining stocks' weakness. Even though gold, and the GLD ETF moved higher yesterday, the HUI Index - proxy for gold stocks - was practically flat. The GDX ETF - another proxy for the miners - closed lower.
This would normally be an important sign - not a small one - but yesterday's weakness could be explained by a quite significant daily decline in the main stock indices.
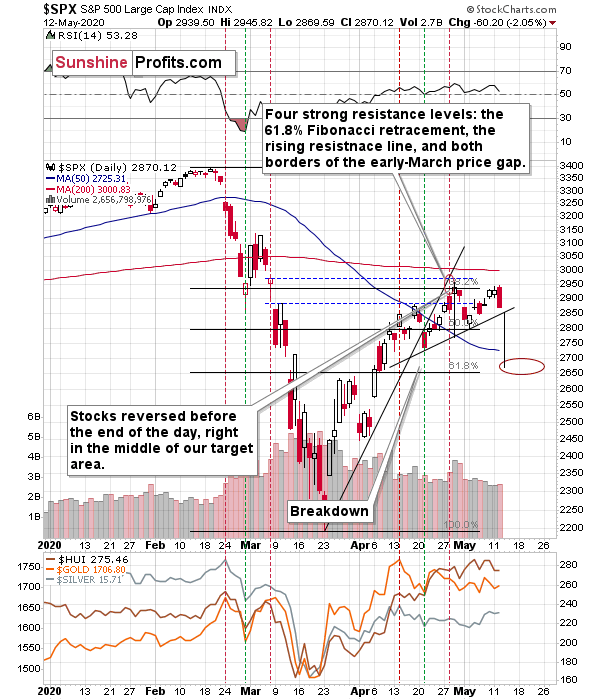
The daily slide in the S&P 500 was likely to affect miners - and it did. Consequently, it's no wonder that yesterday, miners disappointed relative to gold.
Still, let's keep in mind that the stocks traded higher previously, and miners lagged, while silver leaped the gold price, so the bearish implications of the relative performance analysis remain intact. It's just that yesterday's session was not as meaningful as the previous ones were.
If stocks decline more and break below the 2850 level, they will create a bearish head-and-shoulders top pattern, with the target slightly below 2700. We don't think that this level would stop the decline for long, but a decline - if it is to follow at all - has to start in some way. A move to 2700 or so based on the head-and-shoulders pattern seems a quite likely way for this move to start.
Let's keep in mind that back in 2008 (and the current situation is still very similar to 2008 due to the sudden nature of the crisis) the final slide in gold started when the USD Index rallied decisively, breaking above the previous highs.

The USD Index has been trading back and forth for several weeks now without a meaningful breakout whatsoever. Perhaps the confirmed breakout above the 101 level will be what triggers the first part of what we think is going to be the final washout slide in the precious metals market.
All in all, gold's outlook for the next few years is very bullish, but the outlook for the next several weeks remains bearish.
Thank you for reading today's free analysis. In the full version of the analysis, we also feature our preferred way of taking advantage of the current situation and the analogies to the previous price moves.
Subscribe at a discount today and read today's issue ASAP.
Sincerely,
Przemyslaw Radomski, CFA
Editor-in-chief, Gold & Silver Fund Manager -
Gold Stocks' Major Invalidation and Major Implications
May 12, 2020, 6:05 AMToday's free analysis will include just one detail, but a quite important one.

We previously described the above HUI Index chart in the following way:
The HUI Index declined significantly, and then it rebounded significantly.
Both are likely linked. Miners first declined more sharply than they did in 2008, so the rebound was also sharper. Based on the stimulus and gold reaching new yearly highs, miners also rallied and tried to move to new yearly highs. It's not surprising.
However, if the general stock market is going to decline significantly one more time, and so will gold - and as you have read above, it is very likely - then miners are likely to slide once again as well. This would be in tune with what happened in 2008.
At this time, it may seem impossible or ridiculous that miners could slide below their 2015 lows, but that's exactly what could take place in the following weeks. With gold below their recent lows and the general stock market at new lows, we would be surprised not to see miners even below their 2020 lows. And once they break below those, their next strong resistance is at the 2016 low. However, please note that miners didn't bottom at their previous lows in 2008 - they moved slightly lower before soaring back up.
Please note that the HUI Index just moved to its 2016 high which serves as a very strong resistance. Given the likelihood of a very short-term (1-2 days?) upswing in stocks and perhaps also in gold (to a rather small extent, but still), it could be the case that gold miners attempt to rally above their 2016 high and... Spectacularly fail, invalidating the move. This would be a great way to start the next huge move lower.
The gold miners have indeed moved slightly above the 2016 highs in intraday terms, and on Friday, they closed below the highest intraday price of 2016. They did close above the highest 2016 daily and weekly close, though. This breakout is not yet confirmed, but if it gets confirmed, the implications might be bullish. We doubt that this will be the case and we expect to see a clear invalidation of the breakdown instead. And as we wrote previously - it would be an excellent way for the final slide to start.
The key detail is that's exactly what we saw yesterday. HUI's highest daily close of 2016 is 284.14 and it closed at 275.34 yesterday. The HUI's breakout was invalidated shortly after gold invalidated its own breakout above the declining resistance line. The implications are bearish.
Thank you for reading today's free analysis. Please note that it's just a small fraction of today's full Gold & Silver Trading Alert. It - together with yesterday's issue - also includes the fundamental analysis of the Great Lockdown with the emphasis on the dramatic changes on the US jobs market, as well as technical discussion of silver, mining stocks, USD Index, platinum, and palladium. They say that the partially informed investor is just as effective as partially trained surgeon... You might want to read the full version of our analysis before making any investment decisions. Especially that we just made a change in our trading positions.
Subscribe at a discount today and read today's issue ASAP.
Sincerely,
Przemyslaw Radomski, CFA
Editor-in-chief, Gold & Silver Fund Manager -
Gold Investors Shouldn't Be Losing Focus
May 11, 2020, 8:29 AMThe recent volatility in most markets was really extreme, which means that it was easy to lose focus on the things that matter the most in case of the gold market. It was relatively easy to keep one's focus as far as the fundamental outlook for gold is concerned - it's quite obvious that the economies around the world are in deep trouble and that the various QEs and money-printing mechanisms are likely to be inflationary, which together is likely to result in stagflation - which gold loves.
On the other hand, it was easy to lose focus with regard to one of gold's key short- and medium-term drivers - the USD Index. If the USD Index soars, then gold is likely to plunge in the short run, regardless of how favorable other fundamentals are.
Consequently, in today's free article, we'll discuss the situation in the USD Index, with emphasis on two key similarities.

The USD Index was previously (for the entire 2019 as well as parts of 2018 and 2020) moving up in a rising trend channel (all medium-term highs were higher than the preceding ones) that formed after the index ended a very sharp rally. This means that the price movement within the rising trend channel was actually a running correction, which was the most bullish type of correction out there.
If a market declines a lot after rallying, it means that the bears are strong. If it declines a little, it means that bears are only moderately strong. If the price moves sideways instead of declining, it means that the bears are weak. And the USD Index didn't even manage to move sideways. The bears are so weak, and the bulls are so strong that the only thing that the USD Index managed to do despite Fed's very dovish turn and Trump's calls for lower USD, is to still rally, but at a slower pace.
We previously wrote that the recent temporary breakdown below the rising blue support line was invalidated, and that it was a technical sign that a medium-term bottom was already in.
The USD Index soared, proving that invalidation of a breakdown was indeed an extremely strong bullish sign.
Interestingly, that's not the only medium-term running correction that we saw. What's particularly interesting, is that this pattern took place between 2012 and 2014 and it was preceded by the same kind of decline and initial rebound as the current running correction.
The 2010 - 2011 slide was very big and sharp, and it included one meaningful corrective upswing - the same was the case with the 2017 - 2018 decline. Also, they both took about a year. The initial rebound (late 2011 and mid-2018) was sharp in both cases and then the USD Index started to move back and forth with higher short-term highs and higher short-term lows. In other words, it entered a running correction.
The blue support lines are based on short-term lows and since these lows were formed at higher levels, the lines are ascending. We recently saw a small breakdown below this line that was just invalidated. And the same thing happened in early 2014. The small breakdown below the rising support line was invalidated.
Since there were so many similarities between these two cases, the odds are that the follow-up action will also be similar. And back in 2014, we saw the biggest short-term rally of the past 20+ years. Yes, it was bigger even than the 2008 rally. The USD Index soared by about 21 index points from the fakedown low.
The USDX formed the recent fakedown low at about 96. If it repeated its 2014 performance, it would rally to about 117 in less than a year. Before shrugging it off as impossible, please note that this is based on a real analogy - it already happened in the past.
In fact, given this month's powerful run-up, it seems that nobody will doubt the possibility of the USD Index soaring much higher. Based on how things are developing right now, it seems that the USD Index might even exceed the 117 level, and go to 120, or even higher levels. The 120 level would be an extremely strong resistance, though.
Based on what we wrote previously in today's analysis, you already know that big rallies in the USD Index are likely to correspond to big declines in gold. The implications are, therefore, extremely bearish for the precious metals market for the following months.
On the short-term note, it seems that the USD Index has finished or almost finished its breather after the powerful run-up. While the base for the move may be similar to what happened between 2010 and 2014, the trigger for this year's sharp upswing was similar to the one from 2008. In both cases, we saw dramatic, and relatively sudden rallies based on investors seeking safe haven. The recent upswing was even sharper than the initial one that we had seen in the second half of 2008. In 2008, the USDX corrected sharply before moving up once again, and it's absolutely no wonder that we saw the same thing also recently.
In fact, on March 23rd, just after the USDX closed at 103.83, we wrote that "on the short-term note, it seems that the USD Index was ripe for a correction.
But a correction after a sharp move absolutely does not imply that the move is over. In fact, since it's so in tune with what happened after initial (!) sharp rallies, it makes the follow-up likely as well. And the follow-up would be another powerful upswing. Just as a powerful upswing in the USD Index triggered gold's slide in 2008 and in March 2020, it would be likely to do the same also in the upcoming days / weeks.
Please note that the 2008 correction could have been used - along with the initial starting point of the rally - to predict where the following rally would be likely to end. The green lines show that the USDX slightly exceeded the level based on the 2.618 Fibonacci extension based on the size of the correction, and the purple lines show that the USDX has approximately doubled the size of its initial upswing.
Applying both techniques to the current situation, provides us with the 113 - 114 as the next target area for the USD Index. A sharp rally to that level (about 13-14 index points) would be very likely to trigger the final sell-off in gold, silver, and mining stocks.

On a short-term basis, we just saw a daily move lower in gold, while the USD Index declined and reversed before the end of the day. This - by itself - is a sign of gold's weakness, but it's a sign of strong weakness, when one takes into account gold's recent technical development.
Namely, gold recently moved above its declining resistance line - the upper border of the triangle / pennant. A decline in the USD Index was a bullish factor for gold and it should have easily held ground. Namely, it should have rallied further and confirmed the breakout. Gold didn't manage to do that. Instead, it declined and invalidated the breakdown. This is a profound sign of weakness.
Interestingly, while gold showed weakness, silver showed daily strength by rallying higher despite a move lower in gold. That's exactly what we quite often see right before big declines in the precious metals market.
The above is the most important short-term technical development in gold, so we don't discuss it separately from this point of view, but we would like to draw your attention to the following monthly gold chart.

In 2008, after the initial plunge, and a - failed - intramonth attempt to move below the rising support line, gold came back above it and it closed the month there. The same happened in March 2020.
During the next month in 2008, gold rallied and closed visibly above the rising support line. The same was the case in April, 2020.
In the following month - the one analogous to May 2020 - gold initially moved higher, but then it plunged to new lows and finally closed the month below the rising support line. We might see something very similar this month.
Speaking of this month in particular, let's check how gold usually (seasonally) performs in May.

In short, gold usually tops in the first half of the month, and bottoms in its second half. It then recovers, but moves to new highs only in June. This more or less fits what we expect to see later this month also this year.
All in all, the outlook for the USD Index is bullish, which is likely to trigger a decline in the price of gold. Ultimately, gold is likely to recover and soar in the following years, but the opposite seems more likely for the following weeks.
Thank you for reading today's free analysis. Please note that it's just a small fraction of today's full Gold & Silver Trading Alert. It also includes the fundamental analysis of the Great Lockdown with the emphasis on the dramatic changes on the US jobs market, as well as technical discussion of silver, mining stocks, USD Index, platinum, and palladium. They say that the partially informed investor is just as effective as partially trained surgeon... You might want to read the full version of our analysis before making any investment decisions.
Subscribe at a discount today and read today's issue ASAP.
Sincerely,
Przemyslaw Radomski, CFA
Editor-in-chief, Gold & Silver Fund Manager -
Acting on Yesterday's PMs Moves
May 8, 2020, 4:11 AMThere are multiple questions that one might be asking based on yesterday's price moves in gold, silver, and mining stocks, but most of them boil down to this: has anything changed regarding the outlook?
In short, our reply is that it might have, but the outlook still remains bearish overall. The economic outlook is still gloomy, stocks are likely to decline in the following weeks (we are making money on stocks' quick upswing, and we're doing the same in crude oil, though) and the USD Index remains in a long-term uptrend. However, if the technical signs start pointing to a different outcome in the short term, we won't argue that the long- or medium-term trends have to continue right away. After all, markets can be illogical in the short run. They can for instance just assume that there will be negative interest rates in the US without an indication thereof from the Fed. That's why examining technicals is so important - they allow us to detect if something really changed on the emotional side of the market or not. And to check whether what we saw, was rather a price noise or something profound.
As in the previous days, let's start with silver.
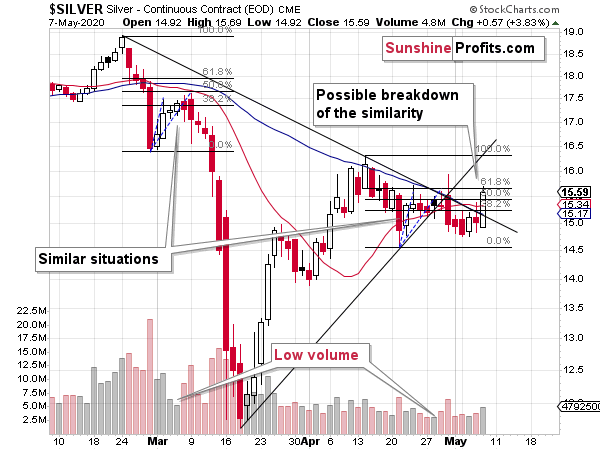
In the previous Alerts, we wrote that the similarity to what happened in early March remained relatively clear and intact. Based on yesterday's upswing and today's pre-market move higher (silver futures are trading at $15.80 at the moment of writing these words, they are slightly above the late-April high), so it might be the similarity to March correction just broke down. They key word here is "might".
Even in late April, we saw that the back and forth movement since the mid-April bottom was taking longer than what we saw in March. Based on the shape of the late-April daily decline and how high silver moved on an intraday basis, we knew that the analogy in terms of price is not perfect either. So, perhaps this consolidation simply takes longer in general, just as the topping pattern is the stock market is broad, as opposed to the quick pause that we saw in the first half of March. It's probably too early to discard the March-May similarity in its entirety, and it's definitely too early to discard the bearish outlook in general.
Both the mining stocks and silver tend to behave specifically during tops. Silver catches up, while miners don't perform as well as they did previously. Silver definitely caught up yesterday and is catching up today - what about the miners' performance?
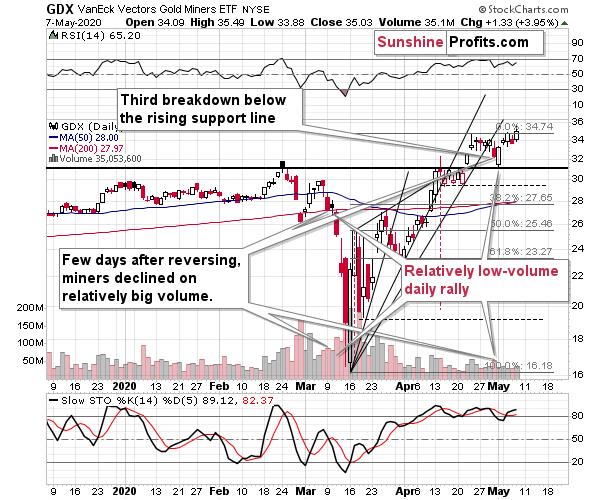
Miners moved higher, but compared to silver, their upswing was not even similarly profound. Taking the last two trading days into account, miners are barely up, while silver is up significantly. This could mean that silver is up, precisely because it's the final part of the upswing.
As far as today's pre-market trading is concerned, at the moment of writing these words, gold is up by 0.24% and silver is up by 1.49% - the white metal is clearly outperforming in the very short term.
With decreased volatility, the times are becoming "more normal" and with this, "more normal" trading techniques become more useful. Looking at miners and silver's relative performance is one of them.
Thank you for reading today's free analysis. Its premium version includes the detailed description of the change in the trading position that we just made. With new information, new decisions have to be made...
Gold Investment News
Delivered To Your Inbox
Free Of Charge
Bonus: A week of free access to Gold & Silver StockPickers.
Gold Alerts
More-
Status
New 2024 Lows in Miners, New Highs in The USD Index
January 17, 2024, 12:19 PM -
Status
Soaring USD is SO Unsurprising – And SO Full of Implications
January 16, 2024, 8:40 AM -
Status
Rare Opportunity in Rare Earth Minerals?
January 15, 2024, 2:06 PM


