

-
S&P 500 Is Knocking on the Doors of Early June Highs
July 20, 2020, 9:03 AMThree doji days in a row, and yet the S&P 500 action is telling. After breaking above the mid-June highs, Friday's close is within spitting distance of the June 8 top. And stocks are primed to overcome it.
It's because they've been consolidating below the resistance without dropping lower meaningfully. While the sentiment has turned greedier, it's still a shadow of the pre-corona days. For the week just in, there is 31% bulls, 45% bears and 24% neutral (AAII data) - hardly a screaming picture of all out greed.
Too many expect a bearish outcome along the double top lines - and there is no shortage of negative catalysts waiting in the wings. But the bets on new stimulus and unemployment impact softened are winning the day. What's the best black swan indicator anyway? Sharply rising USDX - and look where it is instead. Gold isn't getting sold off - there is no liquidity crunch present.
I also look at the healthy rotation into value stocks - into beaten down sectors - amid the froth being taken off in technology. But given the strong leadership from semiconductors, tech is still favored to join the party sooner than those looking at the P/E ratios think. Yes, rotation is what bull markets are made of.
S&P 500 in the Medium- and Short-Run
I'll start today's flagship Stock Trading Alert with the weekly chart perspective (charts courtesy of http://stockcharts.com ):

The rebound off the 50-week moving average goes on as the S&P 500 extended gains in the past week. While the weekly volume isn't outstanding, it's still a tad higher than was the case a week ago.
The sizable lower knot of the week just in, got us the hanging man candlestick. That's a bearish pattern indicating exhaustion of the buyers, but considering everything covered in today's analysis, I wouldn't trust it.

The blue resistance based on mid-June tops has turned into support, and the index is undergoing a healthy consolidation close to the early June highs.
Stocks are just taking their time, in line with my Thursday's thoughts about the potential double top and the selling nearby:
(...) the pressure to go higher is building under the surface in my opinion. I says so because should the bears be willing to sell heavily in the 3220-3230 zone (potential double top area), they would have done so - the fact they haven't been willing to push prices materially lower, is telling by itself.
Yes, the volume behind the upswing off the late June lows hasn't been outstanding, but only prices falling sharply and preferably also on rising volume, would make it a double top.
Prices consolidating just below are a show of latent strength to me. And even more so when I look at the credit markets.
The Credit Markets' Point of View

The action in high yield corporate bonds (HYG ETF) is growing increasingly supportive. Friday's doji formed at a higher level, and on increasing volume compared to Thursday. I wouldn't be surprised to see it carry over into Monday's session - the swing structure and indicators support more gains to come.

And so do the ratios - both investment grade corporate bonds (LQD:IEI) and high yield corporate bonds (HYG:SHY) keep pointing the same way. Their path of least resistance being undeniably higher, is in tune with more stock gains.

Looking at Friday's dynamic alone, the high yield corporate bonds to short-term Treasuries (HYG:SHY) ratio is gently pushing the overlaid S&P 500 closing prices (black line) to rise. There are no new sudden dislocation striking the eye - the relative momentum in both, is intact. The upswing is merely taking time, and the charts don't scream danger.
S&P 500 Sectors in Focus

The talk of the tech bubble has helped to take off some froth from the sector with P/E ratios at nosebleed levels. Technology (XLK ETF) isn't breaking down, just looking for a short-term direction in its newfound trading range. It's more likely than not it would eventually break out higher, and timing is the only question as the continuing outperformance in semiconductors (XSD ETF) foretells.
I view this as a healthy development, and even more so given that the tech money isn't leaving the stock market, but moving into other plays. Considered undervalued, or taking the baton, the rotation's winners are many.

Healthcare (XLV ETF) is taking initiative after a prolonged consolidation following an even sharper rebound off the March 23 lows than technology enjoyed.

Materials (XLB ETF) are also on fire - and little surprise given the massive money printing. Consumer discretionaries (XLY ETF) are also making new 2020 highs. Even the defensive plays (utilities and consumer staples - XLU ETF, XLP ETF respectively) are seeing gains as market players seek undervalued stock assets instead of moving to the sidelines.
It's been on June 5 precisely, when I made the coming inflation a central theme of the stock bull run in the article Reaping the Early Benefits of Inflation in Stocks. Yes, both the monetary and fiscal stimulus is overweighing the corona shocks that I covered extensively on April 12 in the article S&P 500 in the Aftermath of Fed's $2.3T Backstop.
It's not until we see inflation on the ground making a return that the stock bull would become endangered. The stimulus (existing and in the pipeline) is powerful enough to keep overwhelming the corona aftershocks (and unless lockdowns get out of hand again, the newly incoming shocks too) for a good more than a few months to come.
Corona Panic and Reality
A parting factual look at the corona deaths beyond the CDC-provided declining weekly figures that I featured in the July 9 article The Renewed S&P 500 Upswing Is Coming. Let's see this comparison (chart courtesy of Lew Rockwell and Zero Hedge) between the Spanish flu that killed an estimated 50-100 million worldwide, and corona.

Tell me, which one was more deadly and dangerous? The country was at war, and there were no lockdowns, and the ability to make a living wasn't crippled. People just strove to be productive, and were responsible about doing so.
Summary
Summing up, the S&P 500 is ready for more gains, and the sentiment isn't excessively greedy as the put/call ratio shows. Smallcaps (IWM ETF) are joining in, emerging markets (EEM ETF) are doing great, and the healthy rotation within S&P 5000 sectors is on. The dollar again rolled over as I called for it to do, pointing out that the shelf life of whatever disturbances (think China, corona fear politics) is probably very temporary.
The following verbatim quote from my Friday's summary rings true also today. Yes, I think the 3230ish area will be overcome - and I say forget the barrage of negative news and look instead how the markets are just shaking them off. That's a strong bull run to me, higher in the face of negative news or the Fed on pause. Read the charts, follow the money - the signs of something fishy will manifest themselves well ahead. For now, the overall path of least resistance in the S&P 500 remains higher.
Thank you for reading today's free analysis. If you would like to receive daily premium follow-ups, I encourage you to sign up for my Stock Trading Alerts to also benefit from the trading action described - the moment it happens. The full analysis includes more details about current positions and levels to watch before deciding to open any new ones or where to close existing ones.
Thank you.
Monica Kingsley
Stock Trading Strategist
Sunshine Profits: Analysis. Care. Profits. -
Get Ready, the S&P 500 Leg Higher Is Getting Underway
July 17, 2020, 9:23 AMWednesday and yesterday are two uneventful doji days. Wrong! The quiet breakout above the mid-June highs just got confirmed, meaning that the S&P 500 is primed to go higher eventually, I think. And in today's analysis, I'll lay out the case why it's only our patience that is getting tested here.
S&P 500 in the Short-Run
I'll start with the daily chart perspective (charts courtesy of http://stockcharts.com ):
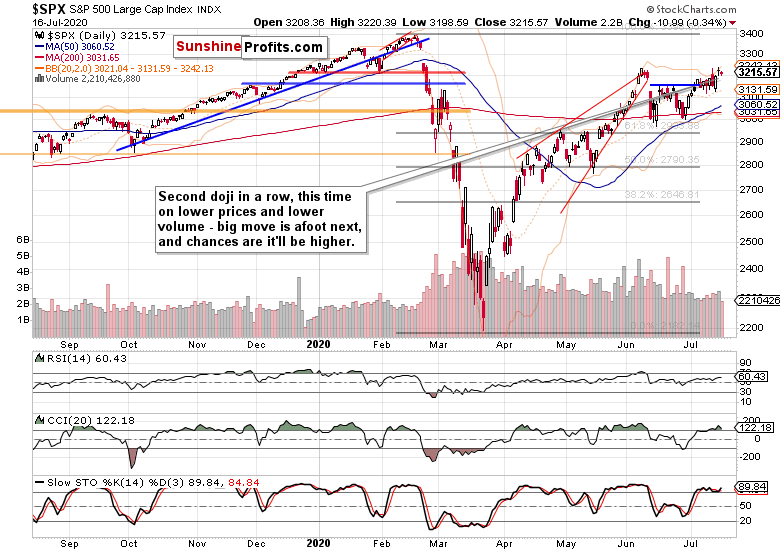
S&P 500 didn't get pretty much anywhere yesterday, but the third daily close above the blue resistance marks its turn into a support now. Decreasing volume of yesterday's lower close is also a slightly bullish omen in disguise.
Such were my thoughts yesterday about the potential double top and the selling nearby:
(...) the pressure to go higher is building under the surface in my opinion. I says so because should the bears be willing to sell heavily in the 3220-3230 zone (potential double top area), they would have done so - the fact they haven't been willing to push prices materially lower, is telling by itself.
Yes, the volume behind the upswing off the late June lows hasn't been outstanding, but only prices falling sharply and preferably also on rising volume, would make it a double top. Prices merely approaching previous local top don't make it so, and could trick the bulls into taking profits off the table prematurely. The battle to overcome them might not turn out to be all that fierce in the end.
Have the scales tipped into the bulls' favor some more with yesterday's action in the creadit markets arena?
The Credit Markets' Point of View
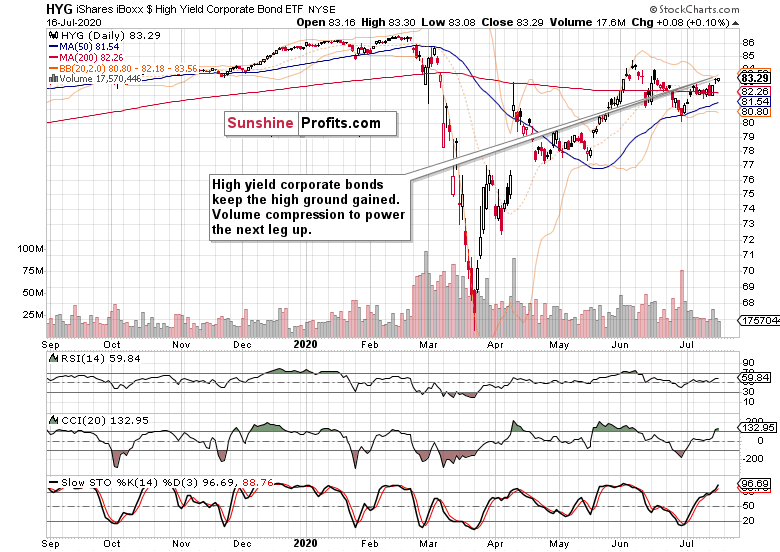
The action in high yield corporate bonds (HYG ETF) is positive. They're keeping above the trading range of recent sessions, and the decreasing volume isn't an issue - quite to the contrary, as its drying up on a slight move lower hints that the market really wants to go in the opposite direction, and not down.
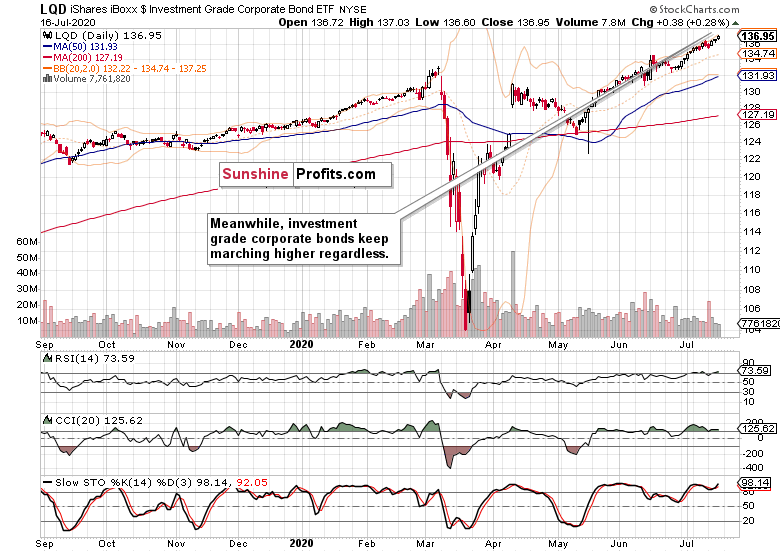
Investment grade corporate bonds (LQD ETF) confirm the bullish HYG takeaway, and are making new highs. Their path of least resistance is undeniably higher.
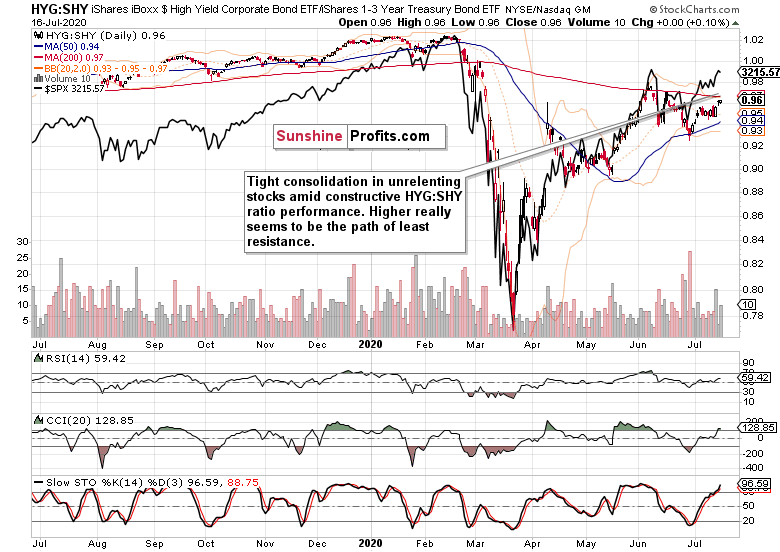
Both the high yield corporate bonds to short-term Treasuries (HYG:SHY) ratio and the overlaid S&P 500 closing prices show no new sudden dislocation striking the eye. Both are moving higher, just taking their time.
As I wrote about the stock upswing yesterday:
(...) Looking under the hood of the S&P 500 thus reveals that stocks aren't getting vulnerable and extended in any dramatic way. Their upswing continuation is amply supported by the credit markets.
Smallcaps and Technology Speak
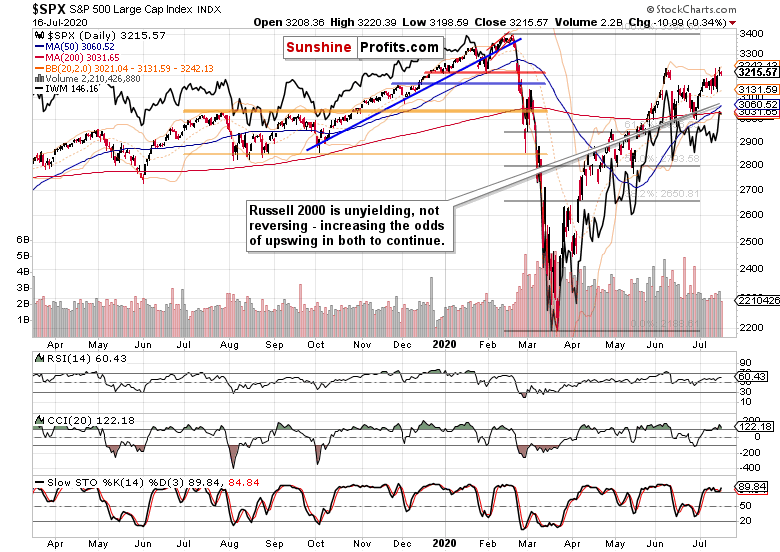
While Wednesday's sprint higher in the Russell 2000 (IWM ETF) hasn't been extended yesterday, the high ground gained has been maintained. And that bodes well for the upswing in both indices to continue.
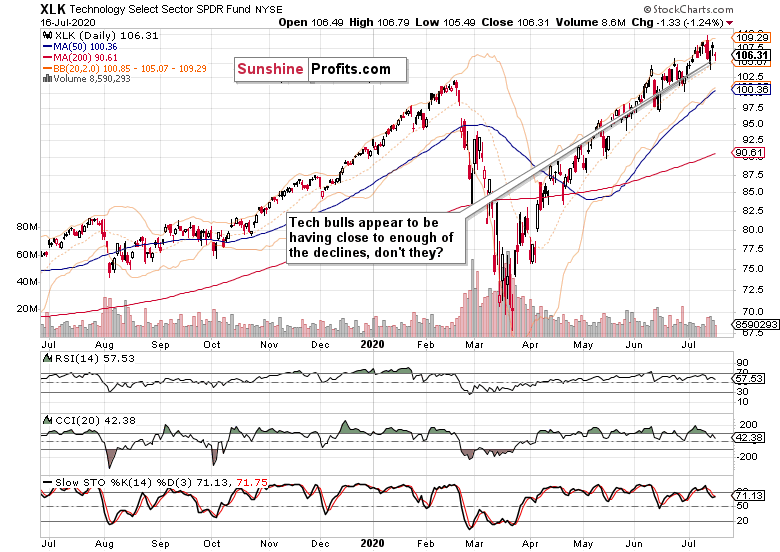
Meanwhile in tech (XLK ETF), the waves of selling appear to be running into brick walls. It doesn't matter that yesterday's upswing got rejected - what counts to me more, are the noticeable lower knots of the two recent sessions that point to buying power emerging to buy the dip.
From the Readers' Mailbag
Q: Well I see TLH at record levels, only a notch smaller than its peak at march. This was not the case in June, and it is steady rising since then. I'd be very cautuous with Monica call to disregard everything and stare at these 3 points ahead. What about the 17 points downside risk to DMA? It was crossed many times now, will it hold every time?
A: It's true that both TLH and TLT (ETFs for longer-dated Treasuries) are trading at high levels. The tape though supports the stock bulls. While it's no ploughing in on the long side at any price, the buyers are the ones favored by the market action.
Next, some thoughts about the stock and bond bull runs.
In a bull market, bonds top first, and are followed by stocks then. The bond guys get it right most of the time - just as they did earlier in 2020. As for commodities, they top the last as e.g. the memorable oil run in 2008 shows.
On one hand, rising bond yields lend credibility to the recovery story. On the other hand, decreasing real interest rates (the reward for holding bonds once the rate of inflation is reflected) drive the TINA trade (the there-is-no-alternative trade is supported also by the dividends' side of the story - who would have thought that selected blue chip bonds would carry a higher coupon many years or better decades ago?).
That's an argument for why I am not concerned by the Treasuries' bull run - it adds more fuel to the stock's one.
Summary
Summing up, the waiting in tech appears close to being over, cyclicals aren't throwing in the towel in any way, and the S&P 500 appears ready to take on the early June highs once more, regardless of emerging markets suffering a setback yesterday. The dollar is playing games of deceptively strong appearance only to roll over next, meaning that the credit-market supported high odds of the S&P 500 invalidating the double top theory are gaining a new lease of life.
Yes, I think the 3230ish area will be overcome - and I say forget the barrage of negative news and look instead how the markets are just shaking them off. That's a strong bull run to me, higher in the face of negative news or the Fed on pause. Read the charts, follow the money - the signs of something fishy will manifest themselves well ahead. For now, the overall path of least resistance in the S&P 500 remains higher.
Thank you for reading today's free analysis. If you would like to receive daily premium follow-ups, I encourage you to sign up for my Stock Trading Alerts to also benefit from the trading action described - the moment it happens. The full analysis includes more details about current positions and levels to watch before deciding to open any new ones or where to close existing ones.
Thank you.
Monica Kingsley
Stock Trading Strategist
Sunshine Profits: Analysis. Care. Profits.
Free Gold &
Stock Market Newsletter
with details not available
to 99% investors
+ 7 days of Gold Alerts
Gold Alerts
More-
Status
New 2024 Lows in Miners, New Highs in The USD Index
January 17, 2024, 12:19 PM -
Status
Soaring USD is SO Unsurprising – And SO Full of Implications
January 16, 2024, 8:40 AM -
Status
Rare Opportunity in Rare Earth Minerals?
January 15, 2024, 2:06 PM

