

-
The Brightening Outlook for S&P 500 Bulls
July 13, 2020, 6:48 AMI doubted that Thursday's downswing was a shot across the bow courtesy of the bears, and instead laid out the case for why the stock upswing is likely to renew itself when I looked at the big picture. And so far, the stock bull run remains intact, regardless of all the non-confirmations out there.
As always, I'll lay out the facts in search of market's upcoming direction, and they still lead me to think that the stock uptrend has more chances of continuing than not.
The bulls are prevailing in the clashing narratives and facts on the ground:
(...) I say so despite the uptrend in new U.S. Covid-19 cases that has many states stepping back from the reopening, rekindling lockdown speculations. I say so despite the Fed having its foot off the pedal in recent weeks, which makes for more players looking at the exit door.
Treasuries aren't relenting. It's corona vaccine and expensive treatment hype against fear. Fear of surging cases and lockdowns that would derail the fragile real economy even more.
Just as I wrote in Friday's Stock Trading Alert:
(...) Central banks are standing ready to act, and money printing remains in our future. The greatest real policy risks I see, concern lockdown miscalculations and new stimulus measures.
Any corona progress hopes lift up the cyclicals, and it isn't just the tech, healthcare or materials that are having a good day. There is no mad rush into dollars, just into selected U.S. sectors and Treasuries. Greed is rising but isn't at extremes. The stock bull isn't breaking down - there is no sign of it.
Let's dive right into the S&P 500 performance.
S&P 500 in the Medium- and Short-Run
I'll start today's flagship Stock Trading Alert with the weekly chart perspective (charts courtesy of http://stockcharts.com ):

After the prior rebound off the 50-week moving average, the S&P 500 extended gains in the past week. The weekly volume has encouragingly improved, if ever so slightly. Couple that with the weekly indicators though, and that still isn't enough to call the chart unequivocally bullish.
Bullish, yes. That's part of the anticipated rocky ride through the summer. Elections uncertainty isn't rocking the markets as much as when November 3 comes knocking on the door. Real economy rebound, employment data, and corona policy responses will play a greater role these weeks.
All in all, the weekly chart is bullish-to-neutral in its implications.

If the second peek above the horizontal line connecting mid-June tops didn't stick, perhaps the third one will. The volume print doesn't help deciphering that, but chances are the strong runup to Friday's closing bell would carry over into Monday's session.
Still, the current dynamics reminds me of the S&P 500 taking on the late April and early May highs. After a prolonged consolidation with stocks trading more often than not above the resistance, the S&P 500 just spurted higher one day. Chances are we'll see history repeated.
Credit markets support this assessment.
The Credit Markets' Point of View

High yield corporate bonds (HYG ETF) quickly overcame the weak selling wave, and marched higher throughout the regular session. After the flag-like consolidation, the upswing looks ready to go on, regardless of not spectacular volume on Friday.

Both the high yield corporate bonds to short-term Treasuries (HYG:SHY) and investment grade corporate bonds to longer-dated Treasuries (LQD:IEI) are positioned supportively for the stock upswing to continue.

And as you can see on the HYG:SHY chart with the overlaid S&P 500 closing prices (black line), stocks aren't getting ahead of themselves any more dramatically since their late June upside reversal.

The stocks to Treasuries ratio ($SPX:$UST) isn't breaking down, far from it. Risk appetite is making a comeback into the market place, as the junk corporate bonds to all corporate bonds (PHB:$DJCB) ratio's unwillingness to decline any more in the short run is also hinting at.
As said on Friday, credit markets are telling me that the sky isn't falling:
(...) should I see it start to, I'll change my mind and let you know about it. With the Fed waiting in the wings, the path of least resistance remains higher. And don't forget about the infrastructure bill or the second stimulus check either.
Some More on Stocks, USDX and Copper

The daily market breadth indicators are still positioned constructively for the upswing to continue. They're not disagreeing or pointing to a changing character in the market. Yes, people might be looking suspiciously on liquidity-driven rallies, and the pace of money creation is truly unprecedented.
But such a rally can go on longer than thought. Equally so, the subsequent reversal might come in as really sharp. Do we see such froth currently? Not yet.

The Russell 2000 (IWM ETF) underperformance goes on, and Friday's upswing isn't a game changer. But such underperformance can go on for months while both indices march mostly higher, which is what I think comes next.

The greenback isn't flashing a warning sign of a deflationary squeeze ahead, and that's conducive for risk assets. Had I seen rising Treasuries, rising dollar, and wavering stocks - that would be a different cup of tea entirely.

There is the China recovery, there are issues at copper-producing nations and mines. But gold is holding up greatly, and generally rising since the March liquidity crunch. Even as it's over $1800, copper is doing greatly too! Just as emerging markets (EEM ETF) are.
The copper-to-gold ratio has risen considerably. Does the red metal smell economic recovery fueled not merely by the electric car mandates? I think that the ratio's performance is a gentle nod in favor of the stock bull run to continue.
From the Readers' Mailbag
Q: First off. you're the reason I subscribed to Sunprofits, your team analysis are well thought through, it's just read and relax. Speaking of fundamentals, looking at Change in EPS vs Change in Price for Q2. Do we have to wait for a wave of bankruptcies before dot-crash II happens? Are the trends similar?
A: Thank you for the appreciation, it's great to know my analyses are helping you! P/E ratios as a prominent decision-making tool rise in prominence for long-term investors. As I seek to capture short- and medium-term moves, they're less useful on a daily basis. And the same goes for their quarterly comparison. As I wrote recently, it's the P in P/E that counts for more, which in other words means that it's about the price charts.
Bubbles can go on for longer than most people think, and the same is true for the current Fed-has-our-back one. Corporate bankruptcies are rising already, yet the S&P 500 marches higher regardless of most stocks trading below their 200-day moving averages. It's hard to say what would be the catalyst, the pin if you will, that will prick the current stellar rise off the March 23 lows. It might coincide, precede, or lag behind the anticipated wave of bankruptcies you mention - and of course, it depends upon how one defines a wave exactly.
But this pricking doesn't need to happen in Q2. I still think that we'll take on the S&P 500 Feb highs this year, and stand a good chance of overcoming them before 2020 is over.
Summary
Summing up, Friday's upside reversal is giving the stock bulls the anticipated upper hand in the short-run, which is in line with the medium-term assessment too, Credit markets are supporting the stock upswing, and appear likely to do so even more in the near future. The Russell 2000 underperformance is amply outweighed by the S&P 500 market breadth, dollar's weakness and surging emerging markets and copper. The breakout above the short-term resistance formed by the mid-June S&P 500 tops has thus good prospects of succeeding shortly.
If you enjoyed the above analysis and would like to receive daily premium follow-ups, I encourage you to sign up for my Stock Trading Alerts to also benefit from the trading action described - the moment it happens. The full analysis includes more details about current positions and levels to watch before deciding to open any new ones or where to close existing ones.
Thank you.
Monica Kingsley
Stock Trading Strategist
Sunshine Profits: Analysis. Care. Profits. -
Why the Sky Isn't Falling for the S&P 500
July 10, 2020, 9:23 AMWednesday's efforts to break above the mid-June highs got thoroughly tested yesterday, and the stock bulls barely managed to stage a comeback. Is that a warning shot fired by the bears, or a show of strength by the bulls? I think I have an answer for that - and it might surprise you. It's that it's neither - neither the bears, nor the bulls did really show they were strong yesterday.
As such, I wouldn't read too much into the rocky nature of yesterday's S&P 500 move, or into today's premarket ones for that matter. I would focus on the big picture - on answering whether the stock bull run is intact or not.
Was yesterday's volume convincing in any way? How is the weekly candlestick shaping up? What about the credit markets? Any strong hints the smallscaps are sending? Does the tech still lead, or not?
These are the facts you'll see examined in today's article, and they still lead me to think that the stock uptrend has more chances of renewing itself than not.
The bulls are still slated to prevail in the clashing narratives and facts on the ground:
(...) I say so despite the uptrend in new U.S. Covid-19 cases that has many states stepping back from the reopening, rekindling lockdown speculations. I say so despite the Fed having its foot off the pedal in recent weeks, which makes for more players looking at the exit door.
The put/call ratio slightly declined, the dollar stopped materially rising in the very short run, and emerging markets aren't exactly breaking down. Central banks are standing ready to act, and money printing remains in our future. The greatest real policy risks I see, concern lockdown miscalculations and new stimulus measures.
Q2 earnings are ahead, and Biden laid out his economic plans, calling for corporate America to pay its fair share in taxes. How would that work for E in the P/E ratio? But jobs coming back (to be seen in declining continuing claims), is a more immediately pressing matter right now.
First things first - let's dive into yesterday's S&P 500 performance.
S&P 500 in the Short- and Medium-Run
I'll start with the daily chart perspective (charts courtesy of http://stockcharts.com ):

The second peek above the horizontal line connecting mid-June tops, didn't stick, and the S&P 500 bulls had a hard time reversing intraday losses. Yet, prices closed at the resistance.
The volume isn't sending signals that a particularly fierce battle has been fought - it looks like a rather average one. In other words, back-and-forth trading during a relatively calm week.

The weekly chart in progress highlights the short-term indecision. Yet, the swing structure still favors the upswing to continue - today's close will be telling.
Whenever markets start acting jittery, it pays to remember the daily chart's big picture:
(...) Recapping the obvious, stocks are on the upswing after the bears just couldn't break below the 200-day moving average, which means that the momentum is with the bulls now. The daily indicators keep supporting the unfolding upswing, and volume doesn't raise red flags either.
Until I see credible signs that the markets are getting spooked by corona, botched policy responses or anything else, there is little point in acting as if the sky is falling. It isn't the case - to be clear, the time to turn really bearish would come, but we're not there yet.
That was it for the illustration of zoomed out perspectives. It certainly seems premature to call for a market breakdown, given what I am going to write next.
The Credit Markets' Point of View

Just like the S&P 500 yesterday, high yield corporate bonds (HYG ETF) opened encouragingly. Early gains turned into quite steep losses, but the beaten down bonds caught a bid to close relatively little changed.
On one hand, there wasn't real willingness to sell more heavy, on the other hand, an upside reversal would call for higher accumulation than we have seen. Thus, we might need to go through some more of the current relatively directionless trading before seeing a decisive move. Still, upswing continuation is the favored eventual outcome here.

Now, that's a bullish chart. Investment grade corporate bonds (LQD ETF) have reversed Wednesday's losses, and rose mightily. That bodes well for the HYG ETF down the road.

The caption covers it all, as the LQD:IEI ratio appears ready to lead HYG:SHY higher. Just like I said yesterday, the overreaching dynamic is one of an uptrend, which is why I look for the daily non-confirmation to be resolved with an upside move, in both ratios.

A look at the HYG:SHY chart with the overlaid S&P 500 closing prices (black line) reveals that we haven't really seen a ground-breaking move that would have messed with the recent dynamics of their relationship.

The ratio of high yield corporate bonds to all corporate bonds (PHB:$DJCB) has ticked up yesterday, which isn't exactly what to expect in any stock slide's opening chapter. That increases the likelihood of the HYG:SHY upswing to reassert itself.
Credit markets are telling me that the sky isn't falling - should I see it start to, I'll change my mind and let you know about it. With the Fed waiting in the wings, the path of least resistance remains higher. And don't forget about the infrastructure bill or the second stimulus check either.
Market Breadth, Smallcaps and Technology

Market breadth isn't sending clear signals apart from moving to the bearish territory in the short run. Arguably, that makes its rebound in the coming week likely, as the late-April and late-June experience shows. I don't see a proof that the market character would have changed.

Yes, Russell 2000 (IWM ETF) underperformance goes on, but I can't say that smallcaps would be breaking down right now.

Yesterday's volume doesn't scream that distribution is here. Actually, its level isn't out of the ordinary, and given the values seen at previous local bottoms and tops, it favors the Russell 2000 upswing to restart, as the caption says.
If I saw IWM ETF weakening while the individual stock heavyweights in the S&P 500 went higher still, that would be concerning. That's because once the smallcaps roll over to the downside, the S&P 500 would follow eventually as the generals wouldn't just prop it up indefinitely. And this isn't happening.
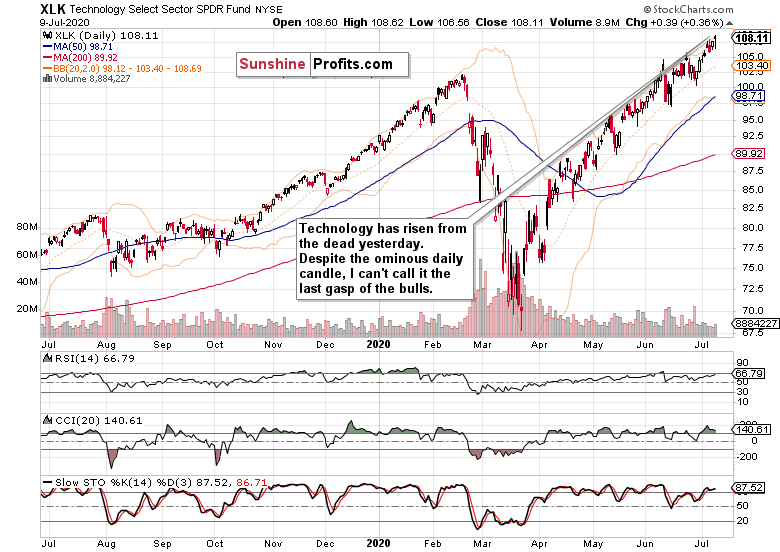
Technology (XLK ETF) certainly isn't going to hell in a handbasket. While prices are extended, yesterday's session showed that buy the dip still rules. In a such a strongly bullish chart, it's dangerous to be calling tops.

Semiconductors (XSD ETF) certainly hint at the tech upswing having further to go. It's not merely because of their greater intraday strength yesterday - it's that just like tech, they are also trading at new 2020 highs.
I don't see a deterioration in this leading segment that would justify turning bearish on tech. Or on the S&P 500 for that matter.
Summary
Summing up, Thursday's decline in the S&P 500 isn't of a world-ending nature. Given the credit market performance, it's most likely merely a short-term hiccup for the stock bulls to deal with. Amid the market breadth deterioration, there are encouraging signs speaking for an uptick in risk-on appetite. Technology and semiconductors certainly don't appear to be on their last legs. Once the upswing across the corporate bonds gathers steam again, stocks would get the much needed ally to break above the short-term resistance formed by the mid-June tops.
If you enjoyed the above analysis and would like to receive daily premium follow-ups, I encourage you to sign up for my Stock Trading Alerts to also benefit from the trading action described - the moment it happens. The full analysis includes more details about current positions and levels to watch before deciding to open any new ones or where to close existing ones.
Thank you.
Monica Kingsley
Stock Trading StrategistSunshine Profits: Analysis. Care. Profits. -
The Renewed S&P 500 Upswing Is Coming
July 9, 2020, 9:29 AMAs expected, the S&P 500 closed back above the mid-June highs resistance yesterday. The volume slightly rose but I wouldn't read too much into it - after all, the early June highs of around 3230 should provide for a bit stiffer battle. How the market reached the current 3160-ish levels, is what counts more.
And after the daily ride higher throughout the Independence Day week, we're experiencing a shallow sideways correction now. When we look in retrospect, will it remind us of bullish flag? In other words, can we expect the market to power higher and soon?
I think so. Higher stock prices are likely despite the high yield corporate bonds having lagged yesterday, or the investment grade corporate bonds suffering a rare daily decline. Market reaction to today's unemployment claims won't probably support the bulls to a great extent, yet I expect the push higher in stocks to continue.
In today's analysis, I'll cover the reasons why, and also discuss the non-confirmations that I would like to see resolved constructively.
I think the breakout will be confirmed shortly, and that the bulls will prevail in the clashing narratives and facts on the ground:
(...) I say so despite the uptrend in new U.S. Covid-19 cases that has many states stepping back from the reopening, rekindling lockdown speculations. I say so despite the Fed having its foot off the pedal in recent weeks, which makes for more players looking at the exit door as the rising put/call ratio shows.
The dollar is taking it on the chin, and emerging markets are seeing stellar gains, boding well for the U.S. markets. V-shaped recovery being real or not, corona vaccine hype or not, stocks love little things more than the central banks standing ready to act. And the punch bowl isn't about to be removed any time soon.
The only policy risk is a lockdown miscalculation - did you see how the ASX 200 Composite (take that as Australia's S&P 500) took to Victoria's 6-week lockdown institution? Thankfully for the U.S. economy, Larry Kudlow (speaking for Fox Business) is in no mood for a second nationwide lockdown.
Yes, corona cases are rising, but testing has risen too. What about deaths? As the below CDC chart shows, any news of their spike would be an exaggeration, as Mark Twain would probably say.

Food for thought and inquisitive minds. Sticking with the markets, let's check upon yesterday's S&P 500 performance.
S&P 500 in the Short-Run
I'll start with the daily chart perspective (charts courtesy of http://stockcharts.com ):

On Wednesday, prices rose back above the horizontal line connecting mid-June tops, on a not so extraordinary volume. But is that a necessarily bearish omen? I don't think so - the swing structure gives the bulls the benefit of the doubt. Please note that in the latter half of May (when stocks were peeking above the late April highs), the volume on those days wasn't outstanding either.
Such were my yesterday's thoughts as to the daily indicators:
(...) Both the CCI and Stochastics keep supporting the upside move - it's only the RSI that feels tired. This doesn't concern me that much - it's not flashing a bearish divergence, it isn't languishing at an extreme reading. In short, it doesn't preclude the rally from going on once the current breather is over.
And until I see credible signs that the markets are getting spooked by corona, botched policy responses or anything else, there is little point in acting as if the sky is falling. It isn't the case - to be clear, the time to turn really bearish would come, but we're not there yet.
Whenever markets start acting jittery, it pays to remember the big picture:
(...) Recapping the obvious, stocks are on the upswing after the bears just couldn't break below the 200-day moving average, which means that the momentum is with the bulls now. The daily indicators keep supporting the unfolding upswing, and volume doesn't raise red flags either.
Let's check the credit markets' message next.
The Credit Markets' Point of View

Yes, high yield corporate bonds (HYG ETF) scored an upswing yesterday, but are still trading below Monday's closing prices. To justify turning more bullish on stocks, renewed animal spirits in the junk corporate bonds arena would be needed.
And not only in junk corporate bonds - it's that the investment grade ones (LQD ETF) have wavered yesterday. But similarly to the HYG ETF move, the volume in LQD ETF hasn't been remarkable, which is why I am not jumping to conclusions (and definitely not bearish ones) just yet.

The respective ratios (HYG:SHY and LQD:IEI) mirror that short-term indecisiveness perfectly. The overreaching dynamic is though one of an uptrend, which is why I look for the daily non-confirmation to be resolved with an upside move.
Encouragingly, the ratio of high yield corporate bonds to all corporate bonds (PHB:$DJCB) has turned higher yesterday. That's a gentle nod in favor of the HYG:SHY ratio's upswing.
As said, I don't see a proof that the sky is falling - should I see one, I'll change my mind and let you know about it. With the Fed waiting in the wings, the path of least resistance remains higher. And don't forget about the infrastructure bill or the second stimulus check either.
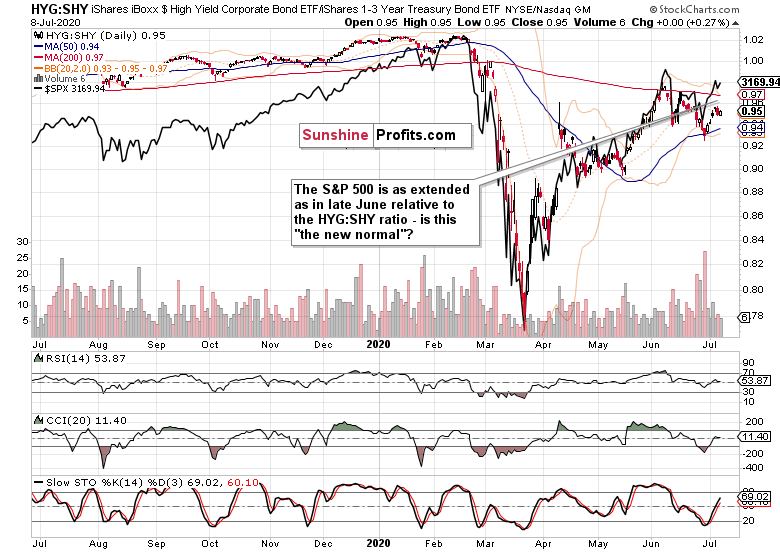
As the HYG:SHY chart with the overlaid S&P 500 closing prices (black line) shows, stocks didn't really get more extended than they were since the late June bottom. While this condition might not last all too long into the future, I don't expect stocks to be brought immediately down courtesy of this factor alone.
From the Readers' Mailbag
Q: Although SPX and NDX keep rallying as you predicted, RUT is not participating much and most of the stocks other than major stocks are not rising with the index. Does that concern you? When do you think RUT will participate in the rally in significant way? Does it have to wait until COVID second wave is resolved in some way or after the second quarter reports are out?
A: Thank you, technology (XLK ETF) has indeed reached new 2020 highs yesterday, and it's leading the index higher. In a sign of confirmation, semiconductors are also challenging their early June highs.

Russell 2000 (IWM ETF) has been indeed underperforming since the March 23 bottom. But the caption says it all - both indices have been climbing higher nonetheless. Of course, the S&P 500 outlook would be more bullish if e.g. IWM ETF traded also above its 200-day moving average.
Given the unfolding S&P 500 upleg and recovering risk appetite (see e.g. the PHB:$DJCB ratio, or the room for growth in XLF:XLU and XLY:XLP), I think it's a question of time when Russell 2000 breaks above its 200-day average too.
But this isn't strictly about the underperformance for any S&P 500 investor to get spooked by. I would focus on whether I see signs of distribution in the IWM ETF. There are none currently.
If I saw IWM ETF weakening while the individual stock heavyweights in the S&P 500 went higher still, that would be concerning. That's because once the smallcaps roll over to the downside, the S&P 500 would follow eventually as the generals wouldn't just prop it up indefinitely. And this isn't happening.
I think the Covid-19 second wave fear is a distraction - smallcaps can rise regardless. Any policy missteps would be more concerning for small- and medium-sized businesses. The same goes for the Q2 earnings and the usual games around bringing down previously upbeat expectation in order to have a better chance to exceed them. In other words, it's the P that counts for more in the P/E ratio.
Summary
Summing up, Tuesday's decline in the S&P 500 was indeed merely of short-term nature, and the credit markets tentatively support the stock upswing to go on. Market breadth isn't at daily extreme readings, emerging stocks are outperforming, and the dollar isn't an obstacle to further stock gains. I look for the breakout above short-term resistance formed by the mid-June tops to succeed shortly as the rally's internals including technology, semiconductors and risk-on metrics are improving.
If you enjoyed the above analysis and would like to receive daily premium follow-ups, I encourage you to sign up for my Stock Trading Alerts to also benefit from the trading action described - the moment it happens. The full analysis includes more details about current positions and levels to watch before deciding to open any new ones or where to close existing ones.
Thank you.
Monica Kingsley
Stock Trading Strategist
Sunshine Profits: Analysis. Care. Profits.
Free Gold &
Stock Market Newsletter
with details not available
to 99% investors
+ 7 days of Gold Alerts
Gold Alerts
More-
Status
New 2024 Lows in Miners, New Highs in The USD Index
January 17, 2024, 12:19 PM -
Status
Soaring USD is SO Unsurprising – And SO Full of Implications
January 16, 2024, 8:40 AM -
Status
Rare Opportunity in Rare Earth Minerals?
January 15, 2024, 2:06 PM

