

-
The Consequences of Yesterday's Bullish S&P 500 Session
April 7, 2020, 8:58 AMThe bulls opened on a strong note on Monday, and relentlessly headed higher since. As such a strong showing has changed the stock landscape, let's examine the current balance of forces and the clues for upcoming moves.
We'll start today's analysis with the daily chart examination (charts courtesy of http://stockcharts.com).

Stocks broke out of their consolidation, and it was not to the downside despite the preceding indications. Last week's bearish gap is history, and the buyers created their own bullish gap yesterday. Stock prices have been adding to their gains, overcoming last week's highs.
Thanks to this price action, the daily indicators gave up their bearish positioning, and they're now supporting continuation of the move higher. As another supportive indicator, the volume of yesterday's upswing has matched the highest daily volume of arguably the most bearish session of the preceding week.
So, does that mean that the local bottom is in? We could have asked whether THE bottom is in, but let's stick with this minimalistic question.
In the search for clues, we'll examine two debt markets - one that the Fed intervenes on, and one where it doesn't.
The high-yield corporate debt (HYG ETF) is the unsupported one.
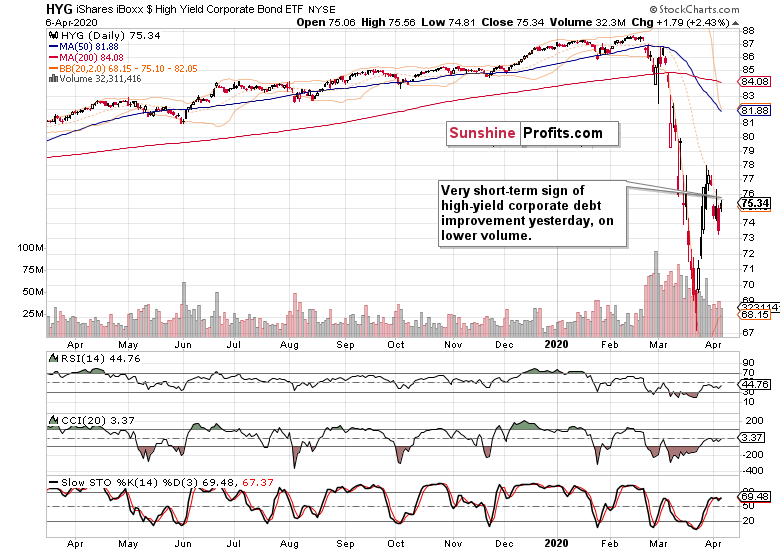
Friday's slide was erased on yesterday's open, and the market hasn't moved much since. Overall though, it sent a bullish hint yesterday.
What about municipal bonds that are on the Fed's shopping list?
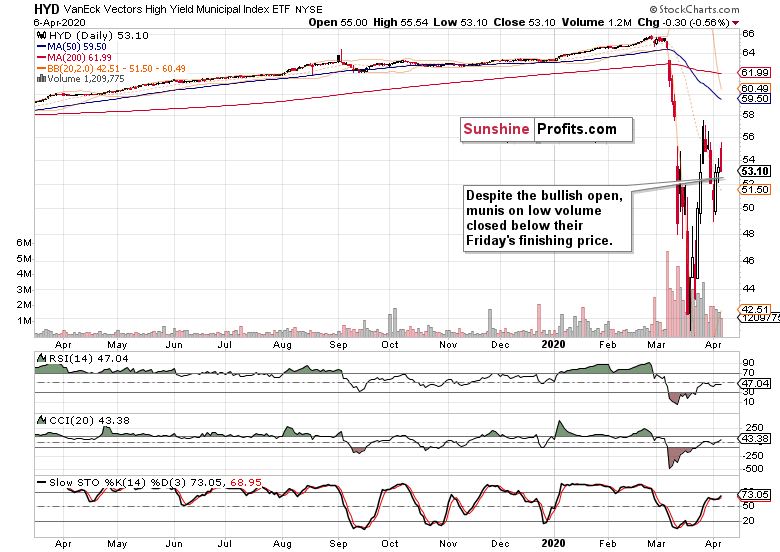
They too have opened higher, but erased all of their gains to close below their Friday's closing prices. That's a bearish message sent. But their daily indicators remain positioned still somewhat constructively - they have not yet flipped bearish.
Overall, both markets are sending a mixed picture, but the bullish bias is starting to prevail in the debt markets.
Let's come back to stocks and have a look at two important metrics - the daily Force index (as it connects the price move with the volume behind it into one indicator) and daily volatility measure (examined from the perspective of Bollinger Bands Width).
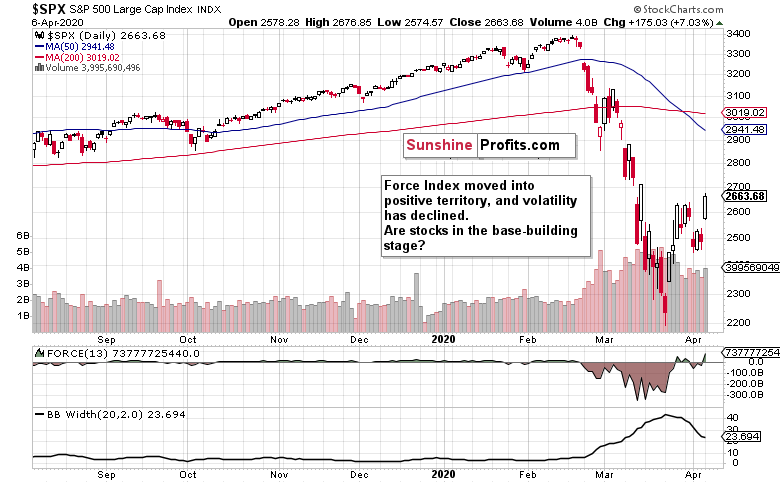
Thanks to yesterday's upswing, Force index moved to its positive territory, and has done so in a way that appears that it can last (today's premarket upswing in stock futures notwithstanding).
In conclusion, it appears that a local bottom is indeed in, and the short-term bias has flipped from down-to-sideways instead to bullish.
These were our yesterday's parting observations:
(...) As a result, stocks aren't out of the woods yet, not by a long shot. We expect the return of the bears despite the improvement in coronavirus death counts over the weekend that came in from NYC, Spain or Italy. The pain, its recognition and economy restart will be a time-consuming process and not a one-way road.
Despite the short-term bullish S&P 500 move, the fluid coronavirus impact situation will facilitate the return of the bears. For the coming days though, it appears that the bulls have the reins.
Summing up, the bulls seized the short-term momentum, and a short-term bottom looks very likely to be in. Despite the upswing though, stocks aren't out of the woods just yet. While bidding their time, the sellers are highly likely to become active at the nearest opportunity, which however doesn't appear to be at hand. The bulls enjoy the benefit of the doubt.
If you enjoyed the above analysis and would like to receive daily premium follow-ups, we encourage you to sign up for our Stock Trading Alerts to also benefit from the trading action we describe - the moment it happens. The full analysis includes more details about our current positions and levels to watch before deciding to open any new ones or where to close existing ones.
Thank you.
Monica Kingsley
Stock Trading Strategist
Sunshine Profits - Effective Investments through Diligence and Care -
Can the Efforts to Turn S&P 500 Around Really Stick?
April 6, 2020, 7:14 AMWhile Friday's session turned out kind of undecided, it was still a down session with the bears bringing home the bacon. Can the same conclusion be reached when examining the weekly chart? And what about other valuable clues as to the upcoming S&P 500 move?
Let's start today's analysis with the weekly chart examination (charts courtesy of http://stockcharts.com).

These were our last Monday's weekly chart comments:
(...) Prices invalidated their breakdown below the red support zone marked by the December 2018 lows. But this invalidation was marked by lower volume compared to the preceding breakdown, and was also accompanied by the bulls giving up a sizable part of their weekly - not to mention last Monday's push lower, which created a comparably large lower knot.
This points to the conclusion that the breakdown invalidation is far from a foregone conclusion. This is also supported by the weekly indicators still leaning bearish - regardless of the Stochastics buy signal or the RSI leaving the oversold territory.
The latest weekly candle shows that the upswing attempt was rejected and prices declined again. Weekly indicators still remain in bearish territory, and their curling higher has run into stiff headwinds. There is one cautionary sign for the bears though. It is the lower volume of the downswing when compared against the preceding upswing' one. This can either mark a normal pause in the continuing downswing, or herald a move higher.
Let's take a look at the daily chart to see which one of these possibilities is more likely.

These were our Friday's observations:
(...) After Thursday's session, the daily indicators are overall positioned more bearishly than the day before, lending credibility to the claim of yesterday's session being merely a pause in the downswing. The bearish gap continues to support the sellers, and we certainly expect the downside move to continue over the coming days.
The daily indicators' positioning hasn't changed on Friday, and Wednesday's bearish gap survived Friday unchallenged. While a bit smaller than in the days before, volume behind the downswing hasn't dried up.
How does that combine with the overnight upswing that took S&P 500 futures over 2585?
Let's take a good look at the debt markets to assess what the stock rally is made of.
We'll start with the high-yield corporate debt (HYG ETF). Its encouraging slide on Friday made us expect further pressure on stock prices. This is a quote from our Friday's intraday Alert, which we issued after the regular Stock Trading Alert was published:
(...) Stocks are holding up relatively well while HYG is having a bad day, trading below 73.80.
And that's how Friday's session finished in HYG.

Closing near the daily lows, and on increased volume. Daily indicators are bearishly positioned, supporting more downside.
We should point out that high-yield corporate debt doesn't (yet) belong among the asset classes eligible for Fed buying. This can't be said about municipal bonds though. Let's check the HYD ETF then.

Yes, they declined last week too, but have been rising on Thursday and Friday. Does it mark an attempt to front-run the Fed, and bid up munis just before they stuff them on their balance sheet? One can't get rid of the nagging feeling that these too show persisting signs of stress despite their direct support by the Fed.
And what about emerging markets government bonds? These must surely be asset classes directly unsupported by the Fed. Let's see how their local central banks with all the currency swaps at their disposal, are doing in the battle against the deflationary coronavirus implications.

That's sort of a middle ground - these too had a down week but didn't close at the weekly lows. Still, the signs of stress are evident in this chart as well. One could come to similar conclusions from looking at the dynamics in the LIBOR/OIS spread, TED spread, or various credit default swaps, too. Rising spreads show that liquidity is being withdrawn from the system, which is a bearish leading indicator for stocks. Falling Treasury yields send the same message.
As a result, stocks aren't out of the woods yet, not by a long shot. We expect the return of the bears despite the improvement in coronavirus death counts over the weekend that came in from NYC, Spain or Italy. The pain, its recognition and economy restart will be a time-consuming process and not a one-way road.
Summing up, the bears enjoy the upper hand as can be seen on both the weekly and daily charts. Despite the overnight upswing in the futures, stocks don't appear out of the woods just yet. While bidding their time, the sellers are highly likely to become active at the nearest opportunity. The daily indicators, high-yield corporate debt market and fundamental prospects of more coronavirus pain and its reflection in market prices mean that our open short position remains justified.
If you enjoyed the above analysis and would like to receive daily premium follow-ups, we encourage you to sign up for our Stock Trading Alerts to also benefit from the trading action we describe - the moment it happens. The full analysis includes more details about our current positions and levels to watch before deciding to open any new ones or where to close existing ones.
Thank you.
Monica Kingsley
Stock Trading Strategist
Sunshine Profits - Effective Investments through Diligence and Care -
Stocks Hanging By the Fingernails?
April 3, 2020, 7:53 AMAfter Wednesday's slide, the S&P 500 moved higher yesterday. While the move itself hadn't surprised us as we've earlier called for a pause in the downswing, the question is whether we can expect some more upside shortly.
Long story short, that's unlikely. Let's open today's analysis with the daily chart examination (charts courtesy of http://stockcharts.com).

Considering Wednesday's bearish gap, stocks have retraced a measly part of the preceding decline. Let's recall our Wednesday's observations:
(...) Stocks closed near the daily lows on Tuesday, and did so on higher volume than was the case on Monday. Another point speaking for the bears is that yesterday's upswing attempt was again soundly rejected. And still, the daily indicators are increasingly and tellingly curling lower.
After Thursday's session, the daily indicators are overall positioned more bearishly than the day before, lending credibility to the claim of yesterday's session being merely a pause in the downswing. The bearish gap continues to support the sellers, and we certainly expect the downside move to continue over the coming days.
But doesn't yesterday's action in the high-yield corporate debt (HYG ETF) constitute a fly in the ointment? After all, the intraday move made us issue this intraday Alert yesterday after the regular Stock Trading Alert was published:
(...) Stocks not merely paused, but also slightly recovered during today's session so far to trade slightly below 2500 currently. Yet it's the corporate debt market that is the reason behind this intraday Alert. It recovered and the bulls attempted to close yesterday's sizable gap. Despite their failure and HYG trading close to its yesterday's closing prices, stocks are trading higher than they were yesterday - in line with the discussed need to pause in their downswing.
However, should HYG continue its recovery attempts, that wouldn't be without consequences for the S&P 500. While we continue to think that the stock downswing will carry on in the coming days, it makes sense to tighten the trade position's parameters and improve its risk-reward ratio - please see the trading position for full details.
The exact position details are reserved for our subscribers. Let's quote from our yesterday's regular Alert first as it explains why the debt market is key to stocks:
(...) Comparing the magnitude of yesterday's downswing shows that stocks are a bit ahead in the sliding game. Unless HYG declines more meaningfully today, stocks are likely to take a short-term pause as they have declined more profoundly yesterday. The emphasis here goes to short-term (which implies that any potential upswing certainly isn't going to be a tradable opportunity) - unless we see a turnaround in the debt market, any potential stock upswing doesn't really have legs.
Now, we'll take a joint look at the HYG action that made us cautious:

The upswing ran farther than expected, and while the odds remain stacked against its possible repetition, it pays to be reasonably suspicious and conservative in one's trading decisions. After all, we're in it for the long run and in order to help people fulfill their many dreams.
Summing up, the bears enjoy the upper hand as can be seen on both the weekly and daily charts. The renewed downswing is underway, and lower S&P 500 (and SPY ETF) values are ahead. The daily indicators, high-yield corporate debt market and fundamental prospects of more coronavirus pain and its reflection in market prices mean that our open and increasingly profitable short position remains justified.
If you enjoyed the above analysis and would like to receive daily premium follow-ups, we encourage you to sign up for our Stock Trading Alerts to also benefit from the trading action we describe - the moment it happens. The full analysis includes more details about our current positions and levels to watch before deciding to open any new ones or where to close existing ones.
Thank you.
Monica Kingsley
Stock Trading Strategist
Sunshine Profits - Effective Investments through Diligence and Care
Free Gold &
Stock Market Newsletter
with details not available
to 99% investors
+ 7 days of Gold Alerts
Gold Alerts
More-
Status
New 2024 Lows in Miners, New Highs in The USD Index
January 17, 2024, 12:19 PM -
Status
Soaring USD is SO Unsurprising – And SO Full of Implications
January 16, 2024, 8:40 AM -
Status
Rare Opportunity in Rare Earth Minerals?
January 15, 2024, 2:06 PM

