

-
The S&P 500 Bears Are Getting Started
April 21, 2020, 9:35 AMIn yesterday's flagship Stock Trading Alert, we have evaluated the week just over, and examined the health of the S&P 500 advance. As the S&P 500 declined profoundly yesterday, we'll revisit the credit markets and one key S&P 500 sector to assess just where are we in the unfolding S&P 500 downswing. Then, we'll turn to the Fed and go down the rabbit hole.
Let's start with the S&P 500 itself, and check the weekly and daily perspectives (charts courtesy of http://stockcharts.com ).
S&P 500 in the Medium- and Short-Run
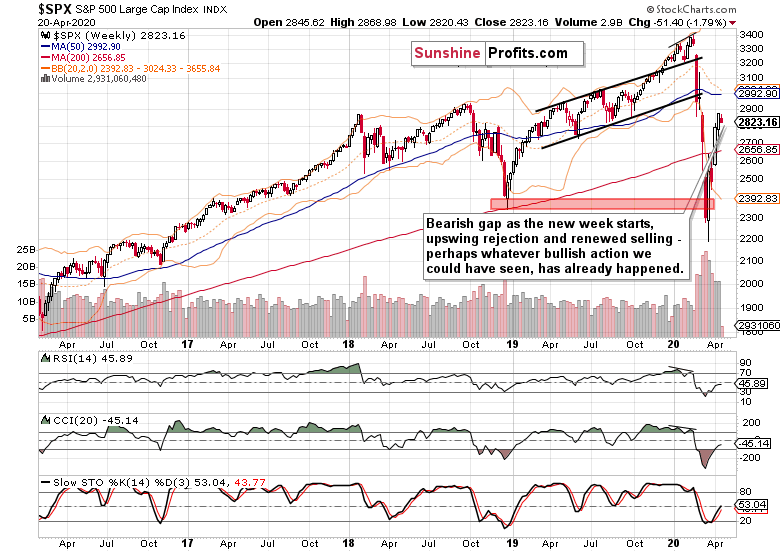
Last two weeks brought us higher prices, but the upside momentum decreased in the prior week as the bears reemerged. Had the volume behind the rally been higher, it would have made the price recovery more credible.
This week opened with a bearish gap, erasing all upswing attempts and the sellers are holding the reins. It's more than a rhetorical question to ask whether we've seen all there was to see in the bullish run already.Let's check Monday's action on daily chart.
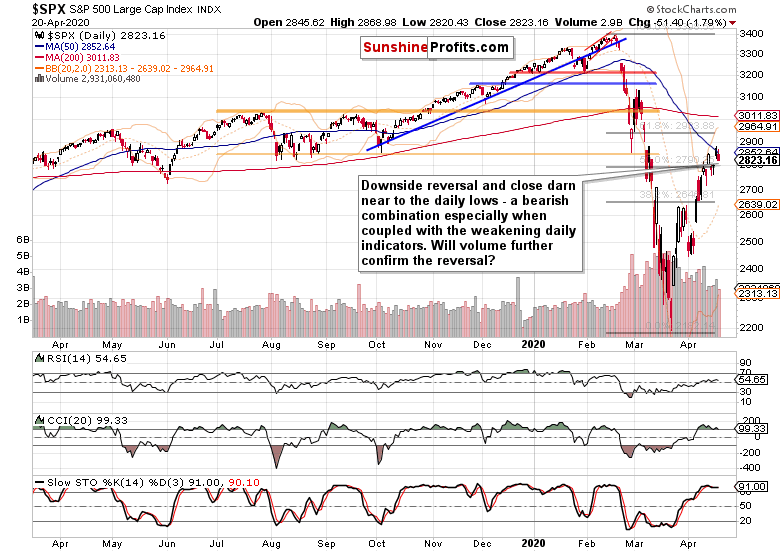
Prices clearly rolled over to the downside yesterday, closing near the daily lows. The volume was not too shabby but it could have been higher. But we're not living in an ideal world where all the ducks always line up in one row. Suffice to say that Friday's volume is sticking out like a sore thumb, lending credibility to the unfolding reversal lower. Clearly, the breakout above the 50% Fibonacci retracement is in jeopardy.
These were our yesterday's comments regarding the daily indicators. They:
(...) are getting increasingly extended, with both CCI and RSI struggling to keep from rolling over. Stochastics' overbought readings will arguably take longer than it is the case with CCI to flash its upcoming sell signal. These increase the likelihood of the S&P 500 taking a breather shortly.
Just like we've seen quite a few bullish gaps in the recent days and early April, bears may respond with some of their own making (and today may be first such day as the S&P 500 futures trade at around 2825 as we speak).
While there's no noticeable change in the daily indicators posture to speak of, we've certainly seen the first bearish gap in quite a few days. And indeed also today, the S&P 500 is bound to open lower as it trades around 2760 as we speak.
As we move to the credit markets next, let's repeat our Thursday's intraday commentary as it keeps standing the test of time:
(...) the credit market metric of high yield corporate bonds to short-term Treasuries keeps trading down. That serves to confirm thin air as the S&P 500 challenges 2800, and actually points to a disconnect between the two markets. And it's the bond guys who usually get it right, which is one more reason apart from the fundamental coronavirus fallout, why we expect renewed selling in stocks.
The Credit Markets' Point of View
If we had to pick just one metric for today, it would be the high yield corporate bonds to Treasuries ratio. What can we deduce from its day-to-day move?
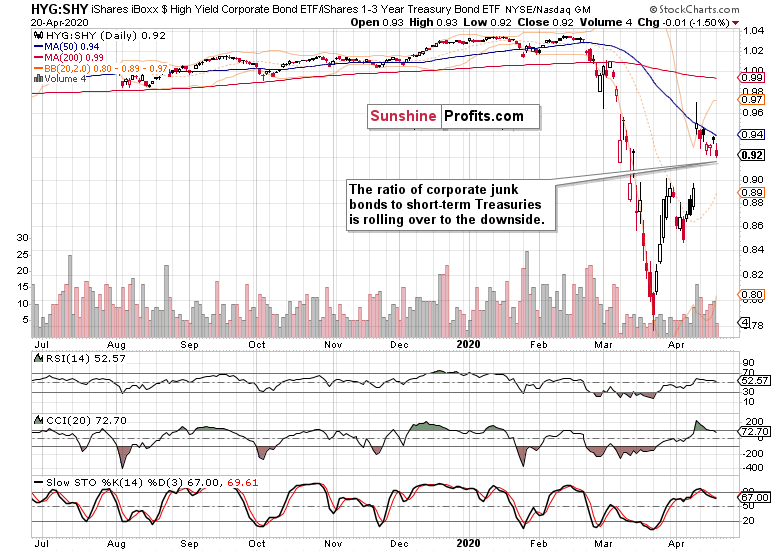
Houston, we have a problem. The ratio is moving to the downside, confirming our yesterday's point about the defensive nature of the S&P 500 rally. In one breath though, we've pointed out the strong showing of the technology sector (XLK ETF).
Let's see exactly how it did yesterday.
The S&P 500 Technology Sector
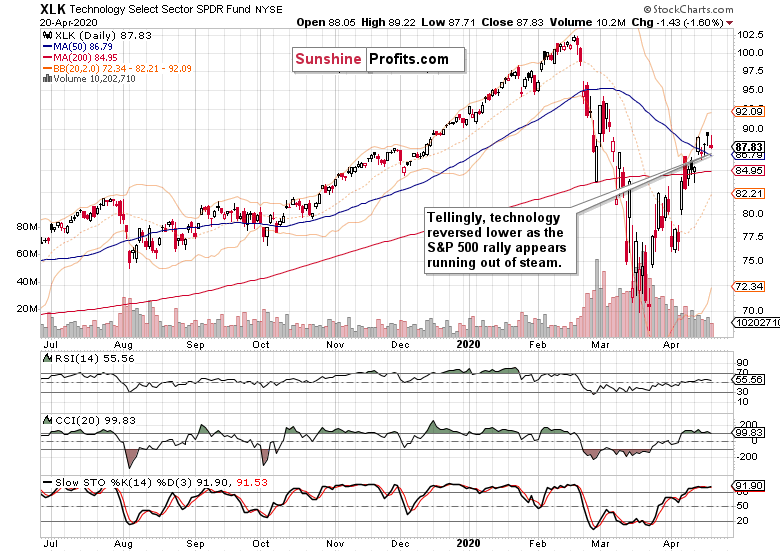
The shape of its daily candle is very similar to another engine of the recent S&P 500 upswing - the healthcare sector (XLV ETF). Both are not so subtly but rather tellingly bearish, illustrating the headwinds the bull run is facing. Such price action doesn't really point to bright short-term prospects in stocks.
The Fundamental S&P 500 Outlook
Please see yesterday's flagship Stock Trading Alert as it went to great lengths covering these. Today, we'll enrich the perspective with yet another angle that goes to support the poor prospects for the S&P 500 this week. It's the volume of Fed's interventions in the Treasury market - the liquidity pump has been progressively turning the volume down.
Originally, the Fed had come in with a $75bn per day cashbook. That volume gradually decreased to $30bn per day on average during the past week. And throughout this week, we're slated to see it halved to around $15bn per day merely. That's certainly a lot less dough propping up the many asset classes (stocks included as we have seen in their decreasing upswing momentum on a weekly basis) and just goes to show the degree of Fed's capture of the market. Additionally, this underscores the issues of finding different qualifying bonds after such a buying spree. Even monetary policy has its limits - what would the Fed put next on its wish list? Stocks as Bank of Japan did already?
From the Readers' Mailbag
Q: Am I imagining things or does the trading in the general stock market seem a little "funny" to you over the last 2-3 weeks? In other words, do you think the stock market is being "artificially" buoyed?
It seems to me that every time the daily trading shows a "bearish pattern" and should go down, it doesn't.
Personally I don't know who in the world would buy stocks at this time anyway!!?? No one knows how hard earnings are going to be hit in the quarters ahead, except that they will be clobbered to a greater or lesser degree.
I warn all my friends to go to cash in their 401Ks, however "their guy" says just hold put. But still who wants all their money exposed to stocks right now??
Well, the Fed has quite a history of intervening in the markets, and this isn't going away any time soon. If you look at the moments where various QE programs have been initiated, it was during decisive, even technically turning points. QE2 serves as a good example of the "when in doubt, inflate" approach. We have to live with the many and increasingly inventive monetary interventions, and take them into account in our decision making. The above peek into this week's Fed's buying plans serves as a good example as it's one more tailwind arguing for lower stock prices (besides the shaky medical progress on coronavirus new infections and increasingly dashed hope of meaningfully lifting the lockdown "right now").
We certainly agree that earnings are going to be hit hard, and are on the record as saying that their decline would be way bigger than is currently being projected for the quarter(s) ahead.
We also agree that a better time to buy stocks will emerge, and we don't think that the buy-and-hold mindset would win the day. Being nimble will be handsomely rewarded over the many coming weeks and months - that's what we deal with at Stock Trading Alerts.
For those with a longer timeframe on their minds, we'll be launching next week Stock Investment Updates - these weekly publications will lay out our outlook on the S&P 500 across various time horizons while still digging deep into the S&P 500 performance in the present.
Summing up, the S&P 500 upswing has been challenged yesterday, and will be up for scrutiny even more so today. As the Fed is tapering its asset purchases and the fundamental headwinds remain unchanged since our yesterday's analysis, the bulls can be expected to be on the defensive very much throughout this week. The breakout above the 50% Fibonacci retracement looks increasingly likely to be invalidated, the credit markets continue to underperform, and the formerly leading S&P 500 sectors have stalled yesterday. We didn't have to wait too long to see stocks roll over to the downside it seems. As the coronavirus fallout gets worse before getting better and as the battle gets broadly recognized as being far from won, the drive to reopen the economy will suffer - and its elusive nature actually drive exasperation among the public at large. Technically, the renewed selling pressure has arrived, and the bears have their sights on the March lows. Our short position remains justified.
If you enjoyed the above analysis and would like to receive daily premium follow-ups, we encourage you to sign up for our Stock Trading Alerts to also benefit from the trading action we describe - the moment it happens. The full analysis includes more details about our current positions and levels to watch before deciding to open any new ones or where to close existing ones.
Thank you.
Monica Kingsley
Stock Trading Strategist
Sunshine Profits - Effective Investments through Diligence and Care -
The Detailed Anatomy of the S&P 500 Upswing
April 20, 2020, 7:43 AMToday's extensive Alert will evaluate the week that just passed, and examine the health of the S&P 500 advance. We'll look both at various credit market metrics, and at the key S&P 500 sectors and ratios. Putting the pieces of the puzzle together will enable us to make profitable trading decisions as the bullish fever is rising. Just how much is that sentiment justified?
Let's start with the S&P 500 itself, and check the weekly and daily perspectives (charts courtesy of http://stockcharts.com ).
S&P 500 in the Medium- and Short-Run

The weekly chart shows how far the rally has reached. The breakdown below the red support zone marking the Dec 2018 lows has been invalidated, and the subsequent bears' push lower has failed. Last two weeks brought us higher prices, but the upside momentum decreased in last week as the bears reemerged.
Were the volume behind the upswing larger, it would make the price recovery more credible. It's true that the weekly indicators are by and large on their buy signals, but how much can they be trusted?
Let's check the detailed daily chart to find out.

Friday's session opened with a bullish gap well above the 50% Fibonacci retracement, and while the sellers took price action back to its proximity, the buyers staged a strong comeback in the session's final hour. Failing that, many of the below bullish-leaning points couldn't have been made.
Encouragingly, it happened on higher volume than what characterized the last two down days. While the volume was slightly higher than that of Tuesday's push higher, it was lower than last Friday's one (that was the day when the 50% Fibonacci retracement was first tested). This raises some doubts about the bulls' ability to extend their gains considerably higher in the coming days.
The daily indicators are getting increasingly extended, with both CCI and RSI struggling to keep from rolling over. Stochastics' overbought readings will arguably take longer than it is the case with CCI to flash its upcoming sell signal. These increase the likelihood of the S&P 500 taking a breather shortly.
Just like we've seen quite a few bullish gaps in the recent days and early April, bears may respond with some of their own making (and today may be first such day as the S&P 500 futures trade at around 2825 as we speak). Remember, many of those declining days in March were characterized by sudden bursts of buying within the final hour - this pattern is not exclusive to the up days since the Mar 23 low.
Not only have prices reached the 50-day moving average that's serving as resistance, but also the lower border of the sizable early March bearish gap, which is reinforced by the 61.8% Fibonacci retracement at its upper end.
As we move to the credit markets assessment, let's bring up our Thursday's intraday commentary as it remains valid also today - and given the S&P 500 closing prices, even more so:
(...) the credit market metric of high yield corporate bonds to short-term Treasuries keeps trading down. That serves to confirm thin air as the S&P 500 challenges 2800, and actually points to a disconnect between the two markets. And it's the bond guys who usually get it right, which is one more reason apart from the fundamental coronavirus fallout, why we expect renewed selling in stocks.
The Credit Markets' Point of View
So, what about corporate bonds to Treasuries? While the investment-grade corporate bonds (LQD ETF) keep trading in a tight range much closer to their recent highs than the high-yield ones (HYG ETF), it's the riskier ones that should be leading higher in a risk-on rally. Otherwise, it would represent flight to quality along the lines of Treasuries' outperformance (SHY and IEI ETFs). In other words, we would still be in a risk-off environment.

The ratio of corporate junk bonds to short-term Treasuries didn't start leading higher on Friday either. It's still trading well below the Fed $2.3T bombshell highs, pointing to the defensive nature of the S&P 500 rally.
Talking short-dated Treasuries, let's see with what kind of veracity they moved lower as the S&P 500 moved above the 50% Fibonacci retracement.

That's not what we would call a turning point or downside break exactly. Such action supports the notion of risk aversion.
Examination of the S&P 500 performance by various key sectors and their ratios should help us refine the picture.
S&P 500 Sectors' Analysis
We'll start with the leading metric of risk-taking: the ratio of financials to utilities.

As the ratio appears ready to beat late-March lows and take on the March panic bottom next, it shows that financials as the risk-on asset class are declining relative to the defensive utilities sector.
Are utilities (XLU ETF) really as strong here - just as Treasuries would imply? What are the other bright spots in the S&P 500 rally? And what about financials (XLF ETF)? Let's check all three.

Utilities are clearly among the best-performing S&P 500 sectors. As they're consolidating their post-Fed announcement gains, they haven't performed as well as the short-term Treasuries (SHY ETF) or investment-grade corporate bonds (LQD ETF), but still have outperformed the credit markets (HYG and HYD ETFs).

Healthcare is a star performer among the S&P 500 sectors, closing higher than any day in March. While the daily indicators are extended, the volume doesn't warn of an impending reversal.

Having repelled the selling pressure to close the opening gap (just like S&P 500) in the final hour of trading, technology shares are another sector leading the S&P 500 higher. Apart from the extended daily indicators, the key watchout is the volume that's trending down since the second half of March. This shows that the bulls aren't as strong as they appear to be. Remember, tops form when there's no one left to buy. Just how close are we to this point?

Financials are clearly lagging behind. Similarly to the leaves that fall off a tree one-by-one as autumn progresses, a stock market rally stalls and rolls over as more and more sectors refuse to move higher. In other words, a rising number of troops don't follow the generals uphill.
Even if the S&P 500 rally goes on a bit longer in the short-term, this constellation doesn't bode well for its prospects. Neither does the weak performance of the energy sector shown below.

They're the laggards, and over at Oil Trading Alerts, we're making a killing shorting oil as you can see in its most recent Alert. Such a weak performance is a bad omen for stocks, despite the low weight of the energy sector in the index.
Kicking off with the financials-to-utilities ratio, we've have already covered the three top-share S&P 500 sectors (technology, healthcare and financials). But there is one more highly informative ratio to look at. It's the consumer discretionaries to consumer staples.

The caption says it all. The ratio isn't yet trending up, and reveals the badly-shaken consumer. It reflects the stunning drop of Wednesday's retail sales data (changed consumer attitudes and outlook), and doesn't really point to its turnaround in May. That's similar to what we see in the financial sector - banks are raising the loan losses provisions as the pain is slowly but surely cascading through the system. The current earnings projections are also overly optimistic, which goes to show that should stocks keep trading at these levels, they'll become relatively more expensive than in the recent past as the P/E ratio would show. Coming back to the discretionaries to staples, it shows no return of the consumer just yet and highlights caution.
The Fundamental S&P 500 Outlook
It's totally appropriate to quote our Friday's lengthy analysis:
(...) how come stocks are showing such strength amid the divergencies and faced with grim fundamental data?
Just as we've seen late last week flattening of the coronavirus curve in some of the hotspots such as NYC, yesterday's unemployment claims (as unprecedented as the figure is) have come below the 6000K+ mark of two prior weeks. Is it a satisfactory flattening of the labor market curve? The bleeding is there, sizable and without an end in sight really. More layoffs are coming as the cascading through the real economy proceeds. Even the Fed's Beige Book dating to April 15 is saying so.
Talking flattening of the coronavirus curve, the news on the ground doesn't fully support the optimism. Tuesday and Wednesday brought us the record number of coronavirus casualties, with 2,364 and 2,371 dead respectively. If that's the new normal, it shows that we've reached no US-wide plateau yet, despite the lockdown in hardest-hit NYC going into effect on Mar 22. That's quite a few weeks already and that's the case for the overwhelming majority of other states too.
In fact, the lockdown contribution to halting the exponential spread might be exaggerated, as Mark Twain would himself say regarding reports of his death. Take a look at the comparisons to Sweden, where no lockdown has been instituted, and the country remains open for business. The country is faring reasonably well on a per capita basis.
Trump understands the need to reopen the economy, and has earlier in March called for it to happen by Easter. While that hasn't been the case, the idea has gained traction also within Democratic strongholds on the East and West Coasts. While the governors may disagree on timing, they're moving in the same direction.
This brings us to the catalyst of yesterday's aftermarket upswing in the S&P 500. It has been known already on Wednesday that the President plans to unveil federal guidelines to reopen America for business. And the moment of glory came late yesterday Eastern Time.
But where is the beef, as the memorable Wendy's ad says?
The offered guidelines are about letting some US states and employers to do away with most social distancing measures within several weeks. Discussing preconditions and stages of relaxation, the document is exactly what it's called - a guideline. In other words, it's a federal outline.
Please remember that it's the States' Governors that are responsible for the action on the ground. All the lockdowns have been initiated by Governors, and sometimes even Mayors. None originated at the federal level. While the Trump guidelines are sending an important message, its impact lies in the PR arena as it steals the spotlight while nothing groundbreaking has just yet happened statewide.
While the S&P 500 futures like it and are clinging to most of the overnight gains (trading around 2865 currently), it's far from a safe bet that the courage to start returning life to normal won't backfire, and that the US won't experience another sharp increase in new infections. Look no further than to Singapore for a second wave of the outbreak. The situation in Spain is again worsening after allowing the estimated 300K workers to resume their roles.
Coming back to the Opening Up America Again guidelines, do they mean that the consumer is coming back in a big way?
We're doubtful, and had this to say about the recovery prospects:
(...) In short, the V-shaped recovery is a fantasy. We've discussed the disruptions in our Sunday's special Stock Trading Alert, and encourage you to read it if you hadn't done so already.
Take a look at China - overnight, they've reported the quarterly GDP figures. The drop of -6.8% is unprecedented, and their fixed asset investment and retail sales still keep falling like a hard rock on a year-on-year basis. We fully expect a similar dynamic to play out in the US as well.
These points remain valid, and we've seen resurgence of cases in Japan as the Land of the Rising Sun declares national emergency and the UK extends lockdown for at least another three weeks. Meanwhile in the US, ramped up coronavirus testing on a per capita basis would sharpen the picture...
Many governors seek more test kits and testing so as to move forward with reopening the economies. Getting past the peak doesn't mean that new infections and deaths would plummet to zero just like that. The public is waking up to the economic damage, and we've seen certain protests already. These go to show that the return to status quo ante will be a long process where pressing a button doesn't translate into the economy springing back to life overnight. It's not only in the US - the uncertainties regarding reopening for business persist globally.
We're in the earnings season, with heavy reporting and guidance this week, and even more so the coming one. Market's optimistic assessment will meet the on-the-ground reality of dealing with the economic disruptions, apart from the expect bunch of incoming data.
Still within Friday's Alert, we went on to explore the weekly and daily message copper is sending. The metal with PhD. in economics closed up on the day, supporting the S&P 500 upswing. While extended, the red metal can still move higher in the short run. But is it out of the woods, pointing to a continuing recovery in the S&P 500?
Let's check another metric of the risk-on/risk-off - the copper to gold ratio.

While the ratio gapped higher and can clearly add to its gains in the short-term, it just illustrates the deep fall off the cliff, supporting the conclusion that stocks are still far from sounding the all-clear.
From the Readers' Mailbag
Q: I am reading about trouble in the European Bond market (negative rates have destroyed it), and the possible imposition of a digital currency there. Germany and the Netherlands might be forced to shoulder the debt. Do you follow this and factor it in in some way? Along with this is the Repo market and the Fed's juggling act to balance it. So there are many macro-economic forces at play here.
A: The coronavirus crisis is putting strains on the European debt market, and Italian debt market is actually among the biggest ones in the world. The rise in Italian yields brings back the memories of PIIGS crisis with the familiar fault line between the Club Med countries and the richer North. We've seen it in the failed coronabonds negotiations. We're certainly paying attention also to the gentle nudges towards cashless society - these are all being discounted in the market action on an ongoing basis. Similarly to the Repo crisis and pre-corona strains in some of the incoming US data, there are many moving parts in this saga. As the market decides what to listen to and how to interpret it, you can count on us to bring the truly breaking news and their impact to your attention.
Q: ... it would be helpful to discuss the impending impact of financial crises.
A: As there are parallels between the 2008 and current situation, let's take a look at the Great Recession and stock market performance back then. There have been many false dawns and great volatility, especially in the months of October and November. In the Hope and Change sentiment of the day, stocks scored many sharp rallies in the short run as bad economic news kept coming in. But early in March 2009, they've stopped reacting to poor data that kept pouring in long after the March 09 bottom.
And we expect it to be the case regarding the coronavirus crisis as well. Again, the stock market will reach the bottom earlier than the real economy does. Leaving aside the question whether we have reached the bottom on March 23 or not (we actually might), the risk of a downswing remains high. Markets don't just come off all-time highs without developing some kind of a trading range next.
Summing up, the S&P 500 added to opening gap's gains in the final hour of trading, which certainly helped in brightening the short-term outlook for the bulls. The breakout above the 50% Fibonacci retracement stands a chance as the 50-day moving average and the lower border of the sizable early March bearish gap (reinforced by the 61.8% Fibonacci retracement at its upper end) are being tested. As the credit markets continue to underperform, the S&P 500 rally is being led by defensive sectors and technology. The financials-to-utilities and discretionaries-to-staples ratios don't paint a picture of lasting price recovery. Neither does the copper-to-gold ratio. While we expect stocks to roll over to the downside as the coronavirus fallout gets worse before getting better, that needn't happen tomorrow or the day after. The drive to reopen the economy may come back to bite the decision-makers as the flattened coronavirus curve still appears elusive. Sideways trading followed by renewed selling pressure taking on the March lows, is the optimistic scenario here.
If you enjoyed the above analysis and would like to receive daily premium follow-ups, we encourage you to sign up for our Stock Trading Alerts to also benefit from the trading action we describe - the moment it happens. The full analysis includes more details about our current positions and levels to watch before deciding to open any new ones or where to close existing ones.
Thank you.
Monica Kingsley
Stock Trading Strategist
Sunshine Profits - Effective Investments through Diligence and Care -
What A Brave S&P 500 Bulls' Move!
April 17, 2020, 9:14 AMToday's article will dive deep into yesterday's market action, including the aftermarket one. After another dreadful weekly unemployment claims report coming in at well over 5000K, the S&P 500 obliged lower, yet came back after two bouts of heavy selling. But it was the not-so-surprising Trump announcement that arguably stole the spotlight. Is it a game-changer?
Let's check the S&P 500 price action during yesterday's regular session (charts courtesy of http://stockcharts.com ).
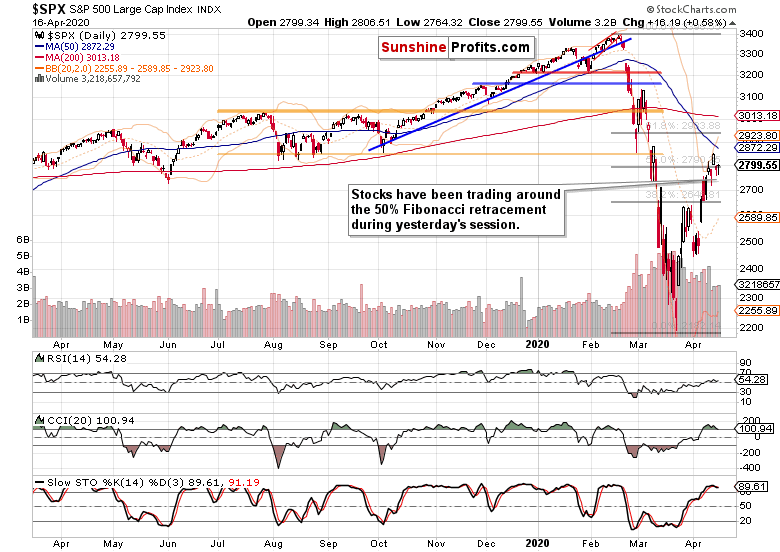
These were our Wednesday's observations:
(...) Yes, stocks broke above the 50% Fibonacci retracement and closed darn near their intraday highs. But note the low daily volume. One can be easily forgiven when looking for a much higher one on such a key resistance breakout - expecting a higher reading is justified. Moves that happen on comparatively low volume, are best viewed with a healthy dose of suspicion.
(...) Stochastics just flashed its sell signal. As it happened in its overbought territory, quite a few traders (us included) wouldn't take it at face value, and would prefer to wait for the indicator to clear the overbought area first. CCI points to decreasing strength behind the stock upswing, and is on the verge of generating its own sell signal, while the RSI is struggling around its midline. Quite a bearish combination overall.
There hasn't been any breaking-news technical development that would invalidate the above words. Speaking of which, we've commented on yesterday's intraday comeback of the bulls this way:
(...) As disconcerting as yet another retracement of the opening S&P 500 losses may appear, there hasn't been any breaking-news development.
(...) the credit market metric of high yield corporate bonds to short-term Treasuries keeps trading down. That serves to confirm thin air as the S&P 500 challenges 2800, and actually points to a disconnect between the two markets. And it's the bond guys who usually get it right, which is one more reason apart from the fundamental coronavirus fallout, why we expect renewed selling in stocks.
The debt markets haven't turned around before the closing bell. Let's check their performance in-depth.
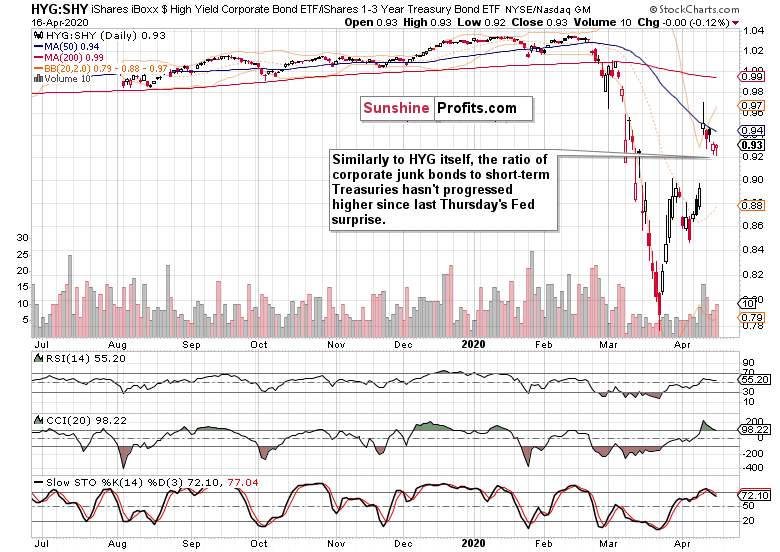
Mirroring the daily action in HYG ETF, the high yield corporate bonds to short-dated Treasuries ratio kept trading close to unchanged yesterday. While it didn't decline profoundly, it hadn't rallied either. And high yield corporate bonds did much better yesterday than their municipal counterparts. Munis (HYD ETF) have actually closed lower than on Wednesday. In light of such a weak performance, how did Treasuries do?
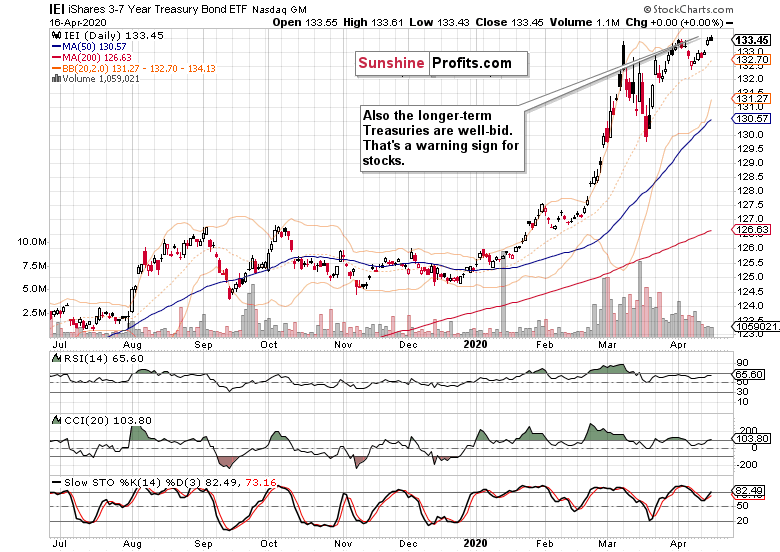
Even the longer-dated ones (IEI ETF) aren't selling off - so, it's not just the short-term Treasuries (SHY ETF) that are holding up more than nicely. And whenever the most secure bonds out there remain this well-supported, it sends a message of no smooth sailing ahead for stocks.
How have stocks actually fared against Treasuries recently?

Let's take long-dated ones - should the animal spirits be returning, that's where the coming inflation should show up first. The fact that it doesn't, reveals that we're not experiencing an inflationary storm currently.
And indeed, even the long-dated Treasuries (TLT ETF) have been outperforming the general stock market in recent days.
So, how come we've seen such a sharp S&P 500 upswing in the light aftermarket trading yesterday? But first of all, how come stocks are showing such strength amid the divergencies and faced with grim fundamental data? Answering the second question will help us deal with the first one more efficiently.
Just as we've seen late last week flattening of the coronavirus curve in some of the hotspots such as NYC, yesterday's unemployment claims (as unprecedented as the figure is) have come below the 6000K+ mark of two prior weeks. Is it a satisfactory flattening of the labor market curve? The bleeding is there, sizable and without an end in sight really. More layoffs are coming as the cascading through the real economy proceeds. Even the Fed's Beige Book dating to April 15 is saying so.
Talking flattening of the coronavirus curve, the news on the ground doesn't fully support the optimism. Tuesday and Wednesday brought us the record number of coronavirus casualties, with 2,364 and 2,371 dead respectively. If that's the new normal, it shows that we've reached no US-wide plateau yet, despite the lockdown in hardest-hit NYC going into effect on Mar 22. That's quite a few weeks already and that's the case for the overwhelming majority of other states too.
In fact, the lockdown contribution to halting the exponential spread might be exaggerated, as Mark Twain would himself say regarding reports of his death. Take a look at the comparisons to Sweden, where no lockdown has been instituted, and the country remains open for business. The country is faring reasonably well on a per capita basis.
Trump understands the need to reopen the economy, and has earlier in March called for it to happen by Easter. While that hasn't been the case, the idea has gained traction also within Democratic strongholds on the East and West Coasts. While the governors may disagree on timing, they're moving in the same direction.
This brings us to the catalyst of yesterday's aftermarket upswing in the S&P 500. It has been known already on Wednesday that the President plans to unveil federal guidelines to reopen America for business. And the moment of glory came late yesterday Eastern Time.
But where is the beef, as the memorable Wendy's ad says?
The offered guidelines are about letting some US states and employers to do away with most social distancing measures within several weeks. Discussing preconditions and stages of relaxation, the document is exactly what it's called - a guideline. In other words, it's a federal outline.
Please remember that it's the States' Governors that are responsible for the action on the ground. All the lockdowns have been initiated by Governors, and sometimes even Mayors. None originated at the federal level. While the Trump guidelines are sending an important message, its impact lies in the PR arena as it steals the spotlight while nothing groundbreaking has just yet happened statewide.
While the S&P 500 futures like it and are clinging to most of the overnight gains (trading around 2865 currently), it's far from a safe bet that the courage to start returning life to normal won't backfire, and that the US won't experience another sharp increase in new infections. Look no further than to Singapore for a second wave of the outbreak. The situation in Spain is again worsening after allowing the estimated 300K workers to resume their roles.
Coming back to the Opening Up America Again guidelines, do they mean that the consumer is coming back in a big way?
We're doubtful, and had this to say about the recovery prospects:
(...) In short, the V-shaped recovery is a fantasy. We've discussed the disruptions in our Sunday's special Stock Trading Alert, and encourage you to read it if you hadn't done so already.
Take a look at China - overnight, they've reported the quarterly GDP figures. The drop of -6.8% is unprecedented, and their fixed asset investment and retail sales still keep falling like a hard rock on a year-on-year basis. We fully expect a similar dynamic to play out in the US as well.
In the short-term though, the S&P 500 futures are about to open with a sizable bullish gap today, well over the 50% Fibonacci retracement. That's an unconfirmed breakout and today's session will reveal just how much momentum is really there fueling the upswing. Stocks can certainly go higher, but can the bulls sustain the rally faced with bonds refusing to break down?
And should the buyers keep the momentum, which targets can they aim at?
The nearest resistance will be provided by the 50-day moving average, which is slightly above 2870 and reinforced by the sizable early March bearish gap. Then, it's the 61.8% Fibonacci retracement at above 2980. The stock upswing has been having too many issues with the 50% Fibonacci retracement already to consider it a new bull market upleg, and is currently struggling at the 50-day moving average.
With the credit markets effectively nationalized, let's take a look at the metal with PhD. in economics - does copper send a bullish message?

The weekly chart would technically favor the upswing but there are two signs of caution. First, the decreasing weekly volume marking each of the preceding white candle weeks, with the currently rather sideways one bound to end up with higher volume. Should the red metal's price have indeed stalled, that would mark a first sign of selling pressure's return. Second, this and previous week's sizable upper knots point to the sellers taking advantage of the relatively weak recovery from the March lows.
On balance, the message is bearish-to-neutral here, but more bearish than neutral in our opinion.
What about the short-term copper outlook?

The shaky recovery is being tested as prices have pointed lower in recent days. While the daily indicators are sending a toppy message, the lower volume of recent days points to interim indecision. The risks though are clearly skewed to the downside.
Just like the credit markets, copper is sending out a message of non-confirmation of the S&P 500 advance.
Summing up, whilethe stock bulls repelled part of yesterday's downswing, they didn't magically turn the outlook bullish. Tuesday's breakout above the 50% Fibonacci retracement has been invalidated and despite today's bullish opening gap, remains unconfirmed on a closing basis (let alone three consecutive closes). Notably, the credit markets continue to underperform the S&P 500. Copper isn't either leading higher exactly. The risk-reward ratio simply isn't on the bulls' side as dreadful economic data are hitting the markets on a daily basis, and the fallout is likely to get worse before it gets better, and surprise the markets. The drive to reopen the economy may come back to bite the decision-makers as the flattened coronavirus curve still appears elusive. Sideways trading followed by renewed selling pressure taking on the March lows, is the optimistic scenario here. The medium-term outlook for stocks remains bearish.
If you enjoyed the above analysis and would like to receive daily premium follow-ups, we encourage you to sign up for our Stock Trading Alerts to also benefit from the trading action we describe - the moment it happens. The full analysis includes more details about our current positions and levels to watch before deciding to open any new ones or where to close existing ones.
Thank you.
Monica Kingsley
Stock Trading Strategist
Sunshine Profits - Effective Investments through Diligence and Care
Free Gold &
Stock Market Newsletter
with details not available
to 99% investors
+ 7 days of Gold Alerts
Gold Alerts
More-
Status
New 2024 Lows in Miners, New Highs in The USD Index
January 17, 2024, 12:19 PM -
Status
Soaring USD is SO Unsurprising – And SO Full of Implications
January 16, 2024, 8:40 AM -
Status
Rare Opportunity in Rare Earth Minerals?
January 15, 2024, 2:06 PM

