

-
Opportunities in the Aftermath of Yesterday's Bloodbath
February 26, 2020, 10:48 AMTuesday's session brought us another day of strong selling that overpowered whatever buying attempts emerged. And it turned out that yesterday's premarket upswing was the key one. Before the closing bell, stocks slid through not one, but two important supports. Will today's overnight recovery have a different fate?
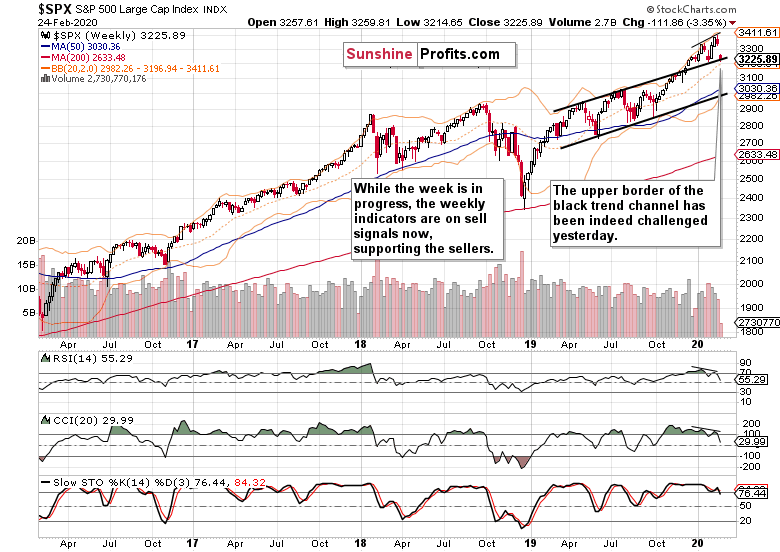
Regardless of the week being very much in progress, let's check yesterday's price action in the weekly chart's context (charts courtesy of http://stockcharts.com).

Yesterday's slide turned the weekly indicators' sell signals even more into negative territory. The bulls woefully failed to lift prices and this week's sizable bearish gap stands unchallenged. Both the gap and the indicators continue to support the bears.
The resolution to the preceding divergencies hasn't stopped yesterday. Let's quote our Monday's observations when we discussed the comparison between:
(...) the levels of both of these indicators with the price action. Stocks have been rising while both the RSI and CCI made lower highs. You can see it marked on the above chart with thin black lines. We have two divergences here - in other words, they didn't confirm the price advance.
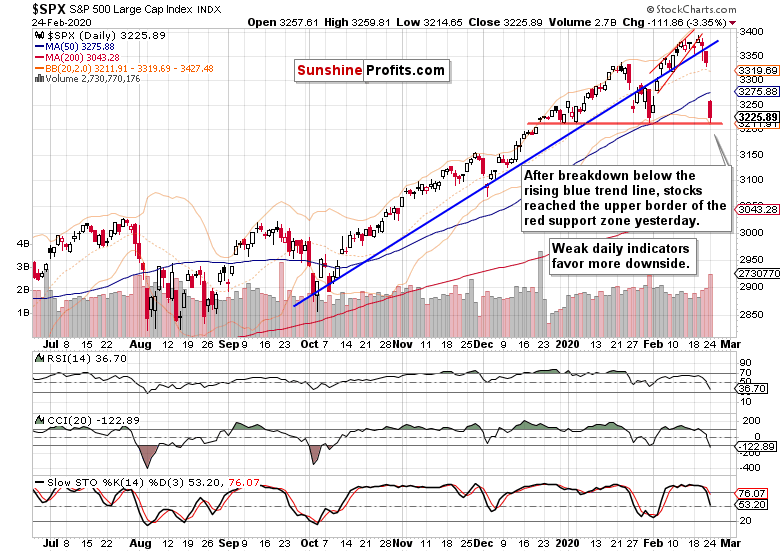
Now, let's see yesterday's session playing out on the daily chart. Where are the nearest supports?

Stocks stopped for a moment above the red support zone, yet the bears powered through early into the session. The plunge continued unabated and neither the blue support zone stopped it.
Today's premarket bounce appears too weak to take stocks back above the blue support. In essence, it follows in the footsteps of the previous premarket recovery that reached 3260 before fizzling out. And the current one looks running out of breath as well - stock futures are trading at around 3140 as we speak.
The only difference between the two is the presence of a significant support. Yesterday, we had that, today there's none to stop another wave of selling should the bears take over again.Where is the nearest support that the bulls can rely on? In our opinion, the horizontal one marked by the early-December bottom, is too weak to count. The orange support zone created by the July and September 2019 tops, is much stronger. Additionally, the lower border of the rising black trend channel on the weekly chart, is relatively nearby.
The bears showed strength with yesterday's close near the session lows. The volume has overcome preceding day's one, confirming the bears' strength. The daily indicators also universally support them. As a result, we can expect more downside.
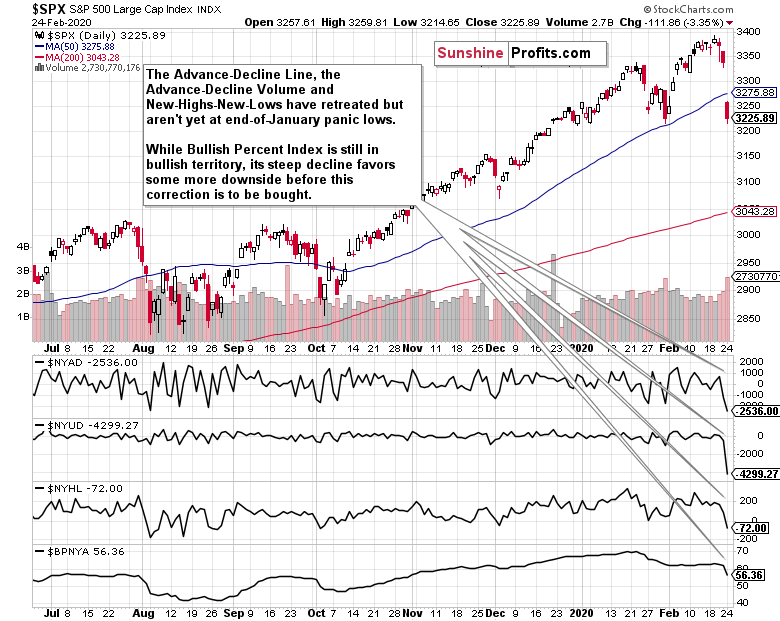
And how did yesterday's slide reflect upon the market breadth indicators?

The advance-decline line, the advance-decline volume and new highs minus new lows - they're all scoring new lows. They have overcome the panic lows reached at the end of January and all their 2019 readings. Is that a signal that the selloff is over now?
Our answer is the same as yesterday - not necessarily. Moreover, the slide just seen flipped the bullish percent index below 50%, which marks bearish territory and changing short-term character of the market. The bears are holding the upper hand at this moment.
Let's quote from our yesterday's Alert where we wrote that:
(...) The takeaway for the coming sessions is that buy-the-dip mentality won't probably rule as strongly as before. While we're still in a bull market, the bulls need to stabilize prices first.
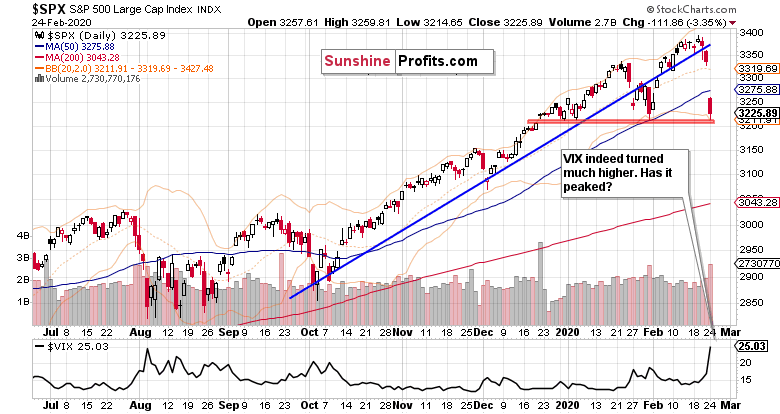
Would the VIX support the view that prices have stabilized now?

The volatility measure has overcome its August highs. On a daily basis, that could mark the top. But our yesterday's observations remains valid also today:
(...) on a weekly basis, volatility could spike even more to match the December 2018 highs.
But that's not everything to story.
As stocks started their recovery earlier in February, it was driven by the widespread assessment that coronavirus would be contained and dealt with within China. That has clearly not happened and there're multiple signs that the crisis is far from over. So are its economic costs and supply chain disruptions.
Let's recount the facts. The Iranian coronavirus strain is different from the Wuhan one, highlighting its ability to mutate. We now face self-sustaining outbreaks around the world. Just how have they leapfrogged the harsh quarantines in China? The fear around the world is palpable and the US is starting to catch up. Incidentally, the CDC announcement that it's a question of when rather than if coronavirus reaches America, poured fuel to the fire.
And the array of industries affected by the hits to their production and logistics lines is growing. That affects both product rollouts and earnings expectations. We've seen that earlier e.g. with Apple. The virus fallout is growing, and the narrative has taken over the market place. US - China trade war or other issues are very much on the back burner now. Unless the central banks step in more aggressively, the virus fallout recognition will rule the day.
While the bets on Fed rate cuts coming soon have increased, we haven't seen any shift attributable to coronavirus in Fed governors' rhetorics just yet. As the charts below (courtesy of Google Trends) show, the US still remains relatively complacent on coronavirus compared to the rest of the world. Human nature is universal, and once confirmed positives start cropping up, the Americans' fear level will move higher as well.
And taking into account that the second wave of spike in fears is virtually guaranteed to surpass the first one, we've quite a way to go in the States. With the speading count of infections in various countries, the world is becoming recognized as coronavirus' oyster now. And this would bring more attention and consequences than when it was perceived as a China affair only.


On top of all the above, that's one more reason for why the panic selling isn't likely over yet. Remember, we haven't seen a buying catalyst, and yesterday's session proves that the bulls gave up on an important support without much of a fight.
Also, the coronavirus knock-on effects could be more than on par with the Fed tightening-triggered stock selloff in December 2018. After all, the central banks can flood the markets with liquidity, lower rates, turn them negative et cetera, but they just can't print goods to keep the factories running, supply smooth and maintain confidence in general that it's all really contained now.
Unless we see response on par with the People's Bank of China interventions, which would radically change the game, S&P 500 rallies should be viewed with a hefty dose of skepticism.
Let's recall our yesterday's notes:
(...) Downside moves during bull markets are here to either scare you out, or wear you out. This is the formed case. Let's remember the big picture though - we're in a stock bull market, actually the longest-running one, and there're sizable gains ahead to enjoy down the road.
That's true despite all the damage we would see on the monthly chart when February is over, but arguably, we've not yet reached the moment of blood in the streets. Yesterday's notable absence of the bulls is a not-so-subtle proof of that.
While it's true that markets and forward-looking and discounting mechanisms, they appear not to have yet digested the coronavirus impact whose count is rising day-by-day.
Therefore, it makes sense to look for an opportunity to sell the rally and ride the very likely downswing all the way to the next important support. Depending on the commitment of the bulls and breaking announcements, we'll manage the would-be open trade accordingly.
Summing up, the medium-term S&P 500 outlook has shifted to bearish, and more downside remains probable before this correction is over both in time in in price. Both the daily and weekly charts attest to that. The divergencies between RSI, CCI and stock prices are yet finished being resolved to the downside. Two important supports haven't arrested the slide yesterday. While the daily volatility is at recent record highs, the weekly one still has a way to go. The notable absence of the bulls yesterday favors more downside before the panic selling is over. We've not yet seen a catalyst that would facilitate the reversal higher, and buy-the-dip mentality didn't exactly win the day yesterday. While the stock bull market remains intact in the long term, it appears too early to bet on letting its many bullish factors work to our benefit today.
If you enjoyed the above analysis and would like to receive daily premium follow-ups, we encourage you to sign up for our Stock Trading Alerts to also benefit from the trading action we describe - the moment it happens. The full analysis includes more details about our current positions and levels to watch before deciding to open any new ones or where to close existing ones.
Thank you.
Monica Kingsley
Stock Trading Strategist
Sunshine Profits - Effective Investments through Diligence and Care
-
Is the Stock Selloff Over Now?
February 25, 2020, 9:41 AMSome would call yesterday's session Black Monday. Little wonder as the S&P 500 finished down more than 100 points from Friday's closing bell. The overnight recovery in the futures gave up most of its gains, and stocks are again hanging close to yesterday's closing prices. How close to the end in this correction are we?
Regardless of the week being very much in progress, let's check yesterday's price action in the weekly chart's context (charts courtesy of http://stockcharts.com).
Yesterday's slide turned the weekly indicators on their sell signals. Unless the bulls lift prices and seriously attempt to close this week's sizable bearish gap, the indicators will continue to support the bears.
This is what a resolution to the preceding divergencies looks like. Let's quote our yesterday's observations when we discussed the comparison between:
(...) the levels of both of these indicators with the price action. Stocks have been rising while both the RSI and CCI made lower highs. You can see it marked on the above chart with thin black lines. We have two divergences here - in other words, they didn't confirm the price advance.
Now, let's see yesterday's session playing out on the daily chart.
The large bearish gap is impossible not to notice. The bearish factors discussed in our Alerts both on Friday and Monday, played out with vengeance. The downside momentum continued throughout yesterday's session, yet the upper border of the red support zone withstood the selling pressure. Still, stocks closed relatively near to their intraday lows.
That's a strong sign that the bulls haven't really stepped in with enthusiasm during yesterday's trading hours, which means that one more downswing as a minimum remains likely.
This fact isn't changed by the overnight futures rally up to 3260. At the moment of writing these words, they change hands at around 3240 as uncertainty regarding the evolving coronavirus spead and impact grips the market place.
It's practically a foregone conclusion that today's close will bring us confirmation of the breakdown below the blue trend line. Coupled with the daily indicators' sell signals, it favors more downside.
Let's again turn to our yesterday's Alert where we mentioned that:
(...) throughout the February advance, the daily indicators have been slowly losing breath, and not confirming higher prices - in other words, they've been diverging just like the weekly indicators.
And how do the market breadth indicators look like after yesterday's slide?
The advance-decline line, the advance-decline volume and new highs minus new lows - they've all flipped to the bearish territory, overcoming the panic lows reached at the end of January. Is that a signal that selling is over now?
Not necessarily. While the bullish percent index remains well above 50%, it has steeply turned lower, indicating the changing short-term character of the market. The takeaway for the coming sessions is that buy-the-dip mentality won't probably rule as strongly as before. While we're still in a bull market, the bulls need to stabilize prices first.
Can that happen during today's session? Looking at how meekly they have stepped in yesterday and earlier today, we're unlikely to see that without more hesitation first. On the other hand, any indecisive move in the short run would relieve the steep decline seen in the daily indicators to some degree. Then, we wouldn't have to worry about the upper border of the rising black trend channel on the weekly chart suffering a confirmed breakdown.
If the red support zone on the daily chart doesn't stop the decline, which other area could? The horizontal support marking the November 2019 peak at above 3150 fits the description.
Either way, a retest of yesterday's lows remains a viable possibility. It would give us a favorable entry point from the risk-reward perspective, and there is one more reason why it's likely.
The VIX has matched its August highs on a daily basis yesterday.
The question is whether yesterday was the top. On a daily basis, that could be true. This would also support a pause in the downswing's viciousness and perhaps make the bulls buy more heavily.
Taking all the above into account, it makes sense to both move our limit buy order a bit higher and to tighten our stoploss. Depending on the commitment of the bulls, we'll manage the open trade accordingly. That's because on a weekly basis, volatility could spike even more to match the December 2018 highs.
Let's recall our yesterday's observations about the red support zone:
(...) that is formed by the December bullish gap, late-December and early-January lows. It has already stopped the slide at the end of January. By the way, that's reinforced by the proximity of the upper border of the rising black trend channel on the weekly chart.
In order to take advantage of the anticipated push lower, we're placing a limit buy order at ... (the exact price point is reserved for our subscribers) as both the daily and weekly charts show strong support there. This area would mark a favorable setup to enter on the long side.
Downside moves during bull markets are here to either scare you out, or wear you out. This is the formed case. Let's remember the big picture though - we're in a stock bull market, actually the longest-running one, and there're sizable gains ahead to enjoy down the road.
Summing up, the medium-term S&P 500 outlook has deteriorated, and more downside remains probable before this correction is over both in time in in price. This is also apparent on the daily chart. First, the index has broken down below the rising wedge, then also below the rising support line. The latter breakdown is now confirmed. As expected, the divergencies between RSI, CCI and stock prices are being resolved to the downside. But the daily volatility examination shows limited upside, which means that stocks might not fall much further in the very short term. Thus, we would like to take advantage of perfectly natural pullback and get back in on the long side to reap more fruits of this stock bull market. It remains intact and much higher prices are to come. Our aim is to let the many bullish factors in this stock bull market keep working to our benefit. The bulls' commitment in the nearest session will send a strong signal and we'll manage the open position accordingly.
If you enjoyed the above analysis and would like to receive daily premium follow-ups, we encourage you to sign up for our Stock Trading Alerts to also benefit from the trading action we describe - the moment it happens. The full analysis includes more details about our current positions and levels to watch before deciding to open any new ones or where to close existing ones.
Thank you.
Monica Kingsley
Stock Trading Strategist
Sunshine Profits - Effective Investments through Diligence and Care -
Is This What Falling Through the Floor Looks Like in Stocks?
February 24, 2020, 10:04 AMWhile last week brought us higher stock prices, Thursday and Friday were bad days for the bulls. And little wonder, as the technical deterioration continues to play out. Looking at both the closing prices on Friday and today's premarket action, how close to the end in this correction are we?
Let's check yesterday's price action in the weekly chart's context (charts courtesy of http://stockcharts.com).

After two weeks of strong gains, the bulls just couldn't keep up the momentum. New highs reached evaporated faster than you can blink. Yet why the bearish tone when stocks closed still comfortably above the upper border of the rising black trend channel?
The answer lies in the weekly indicators. It's not only that they're stretched, but the RSI went on its sell signal and the CCI is very close to doing the same.
Now, let's compare the levels of both of these indicators with the price action. Stocks have been rising while both the RSI and CCI made lower highs. You can see it marked on the above chart with thin black lines. We have two divergences here - in other words, they didn't confirm the price advance.

The daily chart reveals the deterioration in more detail. The very short-term rising red wedge predictably didn't contain the price action. Neither did the rising blue trend line, and stocks closed on Friday not too far from the session lows.
While the breakdown below the blue trend line isn't confirmed yet, the increasing volume on the downswing days coupled with the bearish positioning of the daily indicators, makes the confirmation very likely to materialize.
Both the daily RSI and CCI have been pointing lower, and Stochastics with its sell signal will likely soon leave its overbought area, which would increase the sell signal's reliability. Please also note that throughout the February advance, the daily indicators have been slowly losing breath, and not confirming higher prices - in other words, they've been diverging just like the weekly indicators.
Let's examine the market breadth indicators in the very short-term.

The recent downswing can be clearly seen in the advance-decline line, the advance-decline volume and new highs minus new lows - they're all pointing lower. Their values however haven't yet moved to the panic lows reached at the end of January. That also indicates there's more downside to come.
At the same time though, the bullish percent index remains well above 50%, indicating prevailing buying interest. In other words, we're still in a bull market.
What about volatility - has it reached or at least approached its recent extremes already? Let's check the VIX.

As the bulls stumbled, the volatility measure started turning higher and higher. So far, it still remains below its January high though. Will it reach this reading, or even overcome it?
It's almost a sure bet it will. As the stock futures trade around 3250 currently, it means they'll open with a sizable bearish gap of almost 90 points. That spells acceleration on the downside. Hands up if you just thought of the Wall Street adage "buy when there's blood in the streets".
But should it reach that far, where is the downswing likely to meet an important support? Enter the red support zone that is formed by the December bullish gap, late-December and early-January lows. It has already stopped the slide at the end of January. By the way, that's reinforced by the proximity of the upper border of the rising black trend channel on the weekly chart.
Taking into account all of the above, it's our opinion that a favorable moment to enter on the long side is fast approaching. This correction has entered its highly volatile phase, and doesn't appear to be over yet. In order to take advantage of the likely downside momentum continuation, we're placing a limit buy order at ... (the exact price point is reserved for our subscribers). Both the daily and weekly charts show strong support there.
Downside moves during bull markets are here to either scare you out, or wear you out. This is the formed case. Let's remember the big picture though - we're in a stock bull market, actually the longest-running one, and there're sizable gains ahead to enjoy down the road.
Summing up, the medium-term S&P 500 outlook has deteriorated, and more downside remains probable. This is also apparent on the daily chart. It's the breakdown first below the rising wedge, then below the rising support line. There're also notable divergencies between RSI, CCI and stock prices. Coupled with the volatility examination and today's bearish gap, it points to more to come in this correction before it's over. Yet, we're of the opinion that a favorable setup is approaching to get back in on the long side to reap more fruits of this stock bull market. It remains intact and much higher prices are to come. Our aim is to let the many bullish factors in this stock bull market keep working to our benefit.
If you enjoyed the above analysis and would like to receive daily premium follow-ups, we encourage you to sign up for our Stock Trading Alerts to also benefit from the trading action we describe - the moment it happens. The full analysis includes more details about our current positions and levels to watch before deciding to open any new ones or where to close existing ones.
Thank you.
Monica Kingsley
Stock Trading Strategist
Sunshine Profits - Effective Investments through Diligence and Care -
As Stocks Fell Through the Floor Yesterday, Is the Selling Over Now?
February 21, 2020, 10:03 AMAfter a two-day flirt with breaking below the short-term bearish technical formation, stocks finally declined yesterday. Well before the closing bell though, the bulls stepped in and erased most of the plunge that happened during the first hour of trading. Has it been all there is to see in this correction?
Let's check yesterday's price action in the daily chart's context (charts courtesy of http://stockcharts.com).
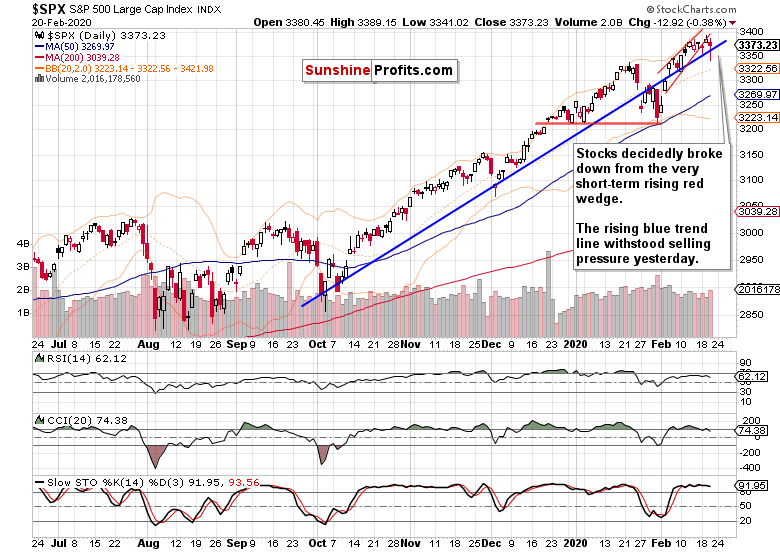
Stocks opened with a bearish gap yesterday, and the bulls' attempts at higher prices were quickly dealt with. In a selling frenzy, stocks promptly reached the 3340 mark before staging a recovery. The long lower knot tells this story precisely.
The slide resulted not only in a clear breakdown from the very short-term rising red wedge, but also in an intraday breakdown below the rising blue support line. Looking at closing prices though, the bears didn't power through.
But how likely is it that this is the end of the selling episode? As S&P 500 futures trade at around 3355 at the moment of writing these words, the bears are yet again pushing below the above-mentioned blue support line. Such a price level means a sizable bearish gap at the open, which would likely encourage the bears to sell even harder later today.
So, are we back to selloff Fridays that marked three prior weeks except for the one a week ago? Taking a look at the coronavirus developments, it's perfectly understandable that the markets are jittery and trigger happy to sell. On one hand, we have the rising Shanghai Composite Index, which ties in well with the earlier way of keeping track of the infections. On the other hand, the growing count of coronavirus cases outside of China that raises fears of turning such places into self-sustaining hotspots with corresponding hits to their economic activities.
Turning back to the technicals, how did yesterday's slide affect the daily indicators?
The CCI has now issued its sell signal, and the RSI has turned lower from near the 70 level. Stochastics keeps looking extended in its overbought territory.
Yes, there has been deterioration in their posture yesterday - but it's the volume that tells the story best. And it also points at the things to come next. You see, yesterday's volume has been noticeably higher than that of the previous upswing days. That tips the scales in favor of the bears, and has implications for the coming sessions.
Therefore, we are of the opinion that there is more selling to come. Just take a look at the decreasing power of the bulls on a daily basis. Can they stage a comeback before we see more short-term price deterioration?
Let's recall our yesterday's notes on the Force Index and its divergencies with prices:
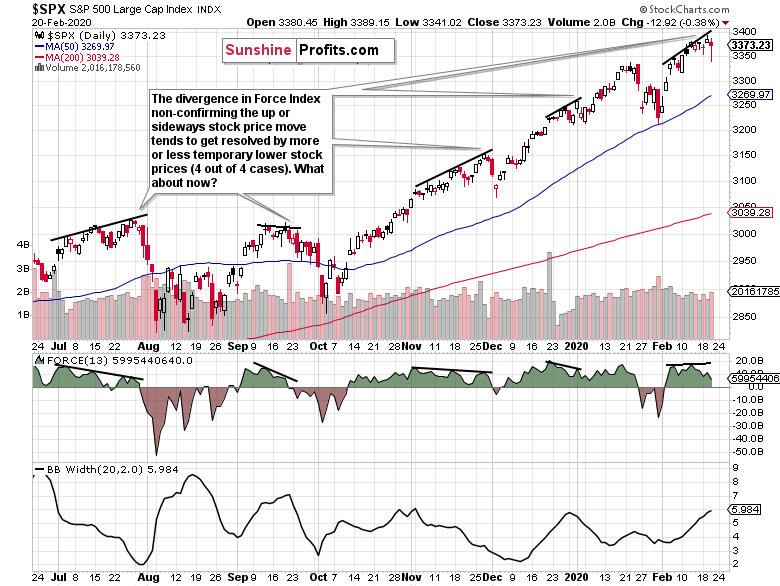
(...) We've marked several cases when Force Index has been unable to make new highs while remaining in the positive territory on the above daily chart. Take a good look what have been stock prices doing in the meantime - either scoring new highs, or slowly losing their breath.
And what happened once Force Index declined more noticeably? Prices followed to the downside - on a more or less temporary basis, but nonetheless declined. In all 4 out of the 4 cases examined.
Instead of a slow grind higher, Force Index favors the case for waning bulls' power. And as volatility expressed by the Bollinger Band Width doesn't seem to have peaked yet, that calls for more selling to come.
Today's session close will be insightful, because it would give us weekly closing prices as well. Considering all the above though, it seems more likely that prices wouldn't stage a steep recovery today, and thus the S&P 500 would finish this week in red. On Monday, we'll examine the learnings, so stay tuned!
Taking into account all of the above, it's our opinion that this correction isn't over yet. The bulls confirmed their not-so-apparent weakness that we told you about in our Wednesday's Alert, and we haven't seen a convincing sign that their strength has returned.
In other words, the very short-term risks continue to be skewed to the downside. However, keeping in mind the Tuesday-discussed bullish outlook on the weekly chart, such a downswing would offer us a favorable setup to again enter on the long side and enjoy the gains still ahead in this longest-running stock bull market.
Summing up, the medium-term S&P 500 outlook remains solidly bullish, yet the noticeable signs of deterioration on the daily chart continue to not only to persist, but also to show up. It's the breakdown below the rising wedge, deteriorating Force Index posture and divergence. Coupled with the volatility examination, it points to more to come in this correction before it's over. A downside move would offer us an opportune setup to get back in on the long side to reap more fruits of this stock bull market. It remains intact and much higher prices are to come. Our aim is to let the many bullish factors in this stock bull market keep working to our benefit - but the risk of more short-term downside remains too high to ignore.
If you enjoyed the above analysis and would like to receive daily premium follow-ups, we encourage you to sign up for our Stock Trading Alerts to also benefit from the trading action we describe - the moment it happens. The full analysis includes more details about our current positions and levels to watch before deciding to open any new ones or where to close existing ones.
Thank you.
Monica Kingsley
Stock Trading Strategist
Sunshine Profits - Effective Investments through Diligence and Care
Free Gold &
Stock Market Newsletter
with details not available
to 99% investors
+ 7 days of Gold Alerts
Gold Alerts
More-
Status
New 2024 Lows in Miners, New Highs in The USD Index
January 17, 2024, 12:19 PM -
Status
Soaring USD is SO Unsurprising – And SO Full of Implications
January 16, 2024, 8:40 AM -
Status
Rare Opportunity in Rare Earth Minerals?
January 15, 2024, 2:06 PM

