

-
How Much More Can the Stock Bulls Add to Their Gains?
March 3, 2020, 9:00 AMStocks opened on a strong note yesterday, and the bulls have been adding to their gains throughout the day. Forcing a close above the nearest resistance, does it mark the end of selling? In other words, have we seen a lasting turnaround?
Let's check the weekly chart for whether the current price action fits the bullish interpretation (charts courtesy of http://stockcharts.com).
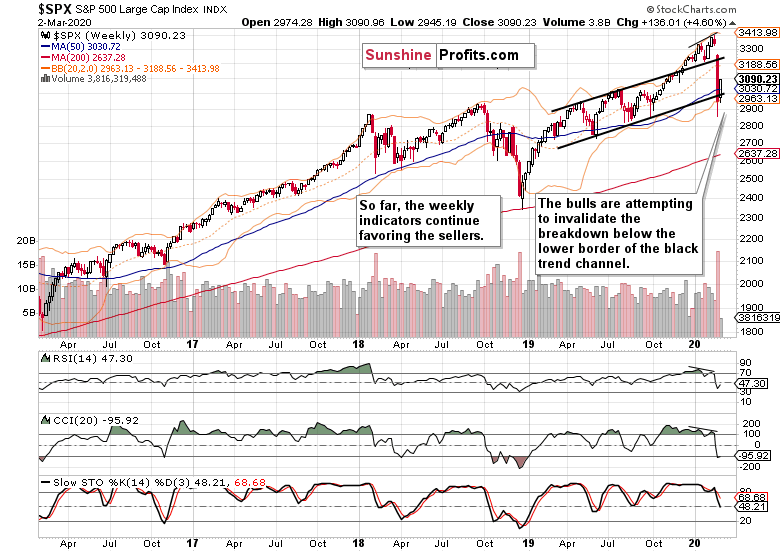
The price action smacks of invalidation of the breakdown below the lower border of the rising black trend channel. The weekly indicators are starting to turn higher but there're no buy signals to discuss in any kind of depth. And the week is far from over yet. Then, the volume extrapolation doesn't seem to be on track to outshine the volume of last week's bloodbath.
These points raise question marks over the strength of the current rebound.
How has yesterday's session changed the daily chart?
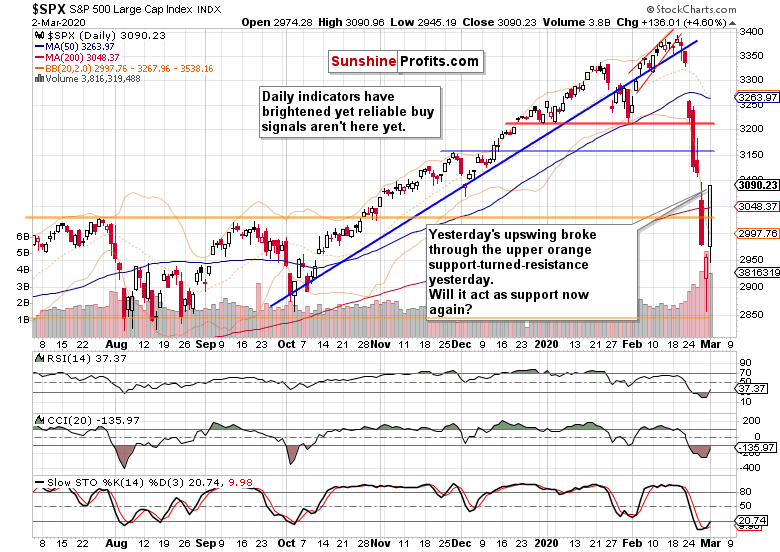
While the bears attempted to close the opening bullish gap yesterday, the bulls countered powerfully, and stocks broke through the upper orange support-turned-resistance. Despite stocks closing at the daily highs, the volume of yesterday's downswwing was lower than that of either two preceding trading days.
That makes it likely that yesterday's gains will be reversed before too long. CCI is still at readings marking strong downtrends, while the RSI disagrees and sends a bullish message instead.
While Stochastics is still in its oversold territory, it has flashed a buy signal already. As the oscillator hadn't yet left the oversold area though, acting on its buy signal can lead to a whipsaw. A pretty mixed bag, these daily indicators.
Let's quote our yesterday's observations as they are still valid today:
(...) looking at the overall picture the indicators are sending, it indeed appears premature to buy with confidence right now.
Look, the market is weighing the expectations of a monetary policy response to cushion the coronavirus blow. With the Fed meeting being two weeks away, and expectations of a hefty rate cut baked into the cake, it appears quite likely that the bears will at some point test the bulls' resolve. As a result, there would be more short-term risk to the downside rather than to the upside.
But is it the case right now?
With the S&P 500 futures changing hands at around 3075 currently, the buyers are set to open with a bullish gap. And we don't expect a ground-breaking announcement that would derail further gains today. Remember, yesterday's upswing hasn't fizzled out during the day, and broke back above an important resistance. While the invalidation is still unconfirmed, it deserves the benefit of the doubt as the bulls are likely to add some more to their prior gains.
As a result, opening long positions with a tight stop-loss appears to be justified at the moment of writing these words. The probable upswing offers us a favorable setup from the risk reward point of view. The position details are reserved for our subscribers.
Summing up, the medium-term S&P 500 outlook has improved with yesterday's price action, and while more downside remains probable before this correction is over both in time in in price, the very short-term balance of forces appears to favor the bulls. The monetary policy response expectations haven't been questioned yet, and there hasn't been any coronavirus-related development that would send stocks into a tailspin. Therefore, opening long positions is justified from the risk-reward perspective.
If you enjoyed the above analysis and would like to receive daily premium follow-ups, we encourage you to sign up for our Stock Trading Alerts to also benefit from the trading action we describe - the moment it happens. The full analysis includes more details about our current positions and levels to watch before deciding to open any new ones or where to close existing ones.
Thank you.
Monica Kingsley
Stock Trading Strategist
Sunshine Profits - Effective Investments through Diligence and Care -
Was Friday's Strong Run Before the Closing Bell the Turning Point in Stocks?
March 2, 2020, 9:50 AMAfter yet another bout of heavy selling on Friday, the bulls stepped in well before the day was over. Cheered by Fed assurances of being ready to support the economy, did they see the light at the end of the tunnel? Global markets are salivating at the prospects of a coordinated policy response, which begs the question. Is it really the end of the tunnel we're at, or are these the lights of an ongoing train? In other words, how probable is still more selling ahead after stocks suffered their worst week since 2008?
Let's put the sizable daily volatility into the context of the monthly chart (charts courtesy of http://stockcharts.com).
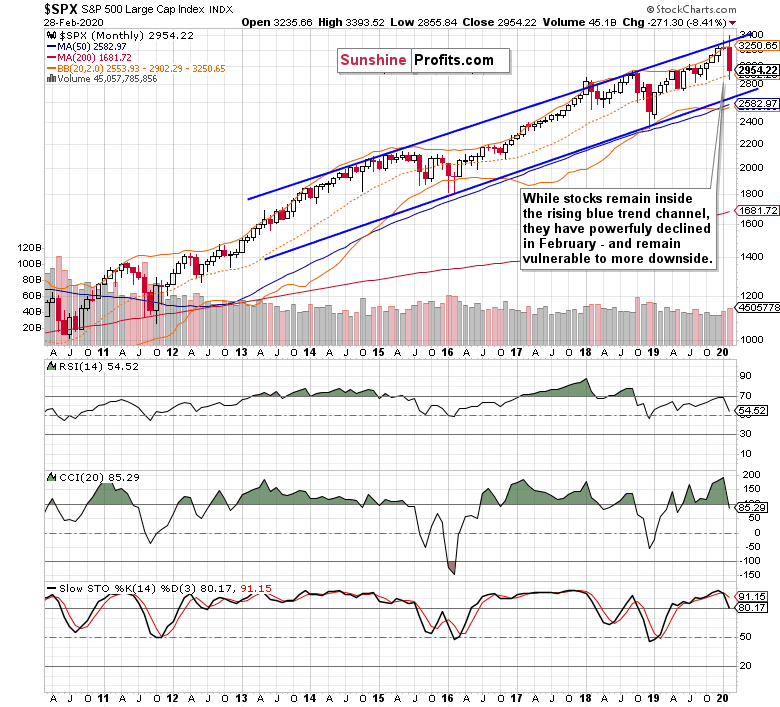
A bad start to the year indeed, February erased quite a few previous months' gains. Stocks keep trading inside the rising blue trend channel though, which means that it would be premature to talk about the end of the bull market.
The bull got bruised though. Let's check the damage on the weekly chart.
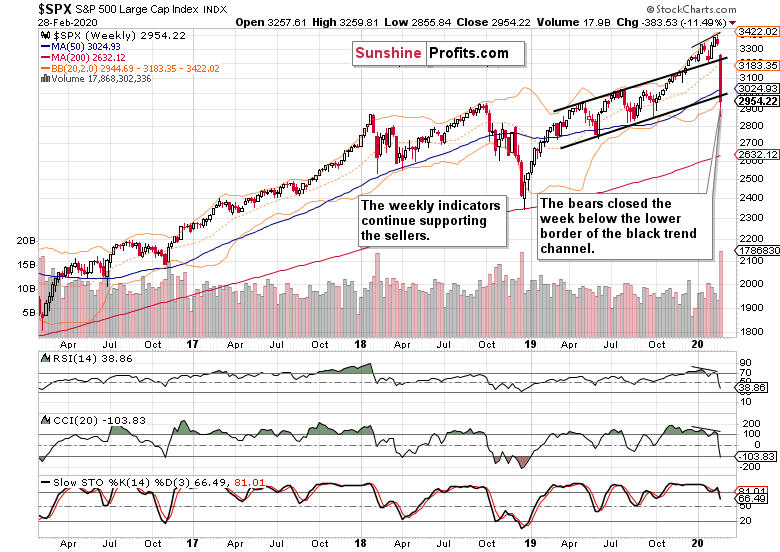
The key technical development is the break below the lower border of the rising black trend channel. The bulls didn't show up sufficiently strongly on Friday to prevent this from happening, and our assessment earlier posted that day, has been proven correct:
(...) unless the bulls really show up today, prices will close the week below the channel. And frankly, we don't expect them to.
Our Thursday's observations also ring as true today as they did throughout the previous week:
(...) Yesterday's slide turned the weekly indicators' sell signals even more into negative territory. The bulls woefully failed to lift prices and this week's sizable bearish gap stands unchallenged. Both the gap and the indicators continue to support the bears.
The preceding divergencies are still being resolved. Let's quote our Monday's observations when we discussed the comparison between:
(...) the levels of both of these indicators with the price action. Stocks have been rising while both the RSI and CCI made lower highs. You can see it marked on the above chart with thin black lines. We have two divergences here - in other words, they didn't confirm the price advance.
How does yesterday's session look on the daily chart?
Another day, another bearish gap. The opening bell was met with more selling, and we were ready, capturing almost 20 points of the downswing. Correctly assessing the high likelihood of a Friday upswing, we closed our short positions well before the first whiff of buying emerged.
On one hand, the bulls didn't manage to close the opening gap. On the other hand, we've seen the highest daily volume. However, the reversal in price wasn't as high as it could have been expected in a true and lasting reversal. And we seek to see both if a reversal is to be relied on.
The daily indicators have entered deeply oversold territory, yet Stochastics has flashed its buy signal already. Can it be trusted though? Acting on signals in overbought and oversold territories can lead to whipsaws, which is why many traders prefer that the indicator clears that territory first. And looking at the overall picture the indicators are sending, it indeed appears premature to buy with confidence right now.
What was the catalyst of Friday's rally? Expectations of a policy response announced. But when does it arrive? Will it be strong enough to satisfy the markets and keep stocks up? In the meantime, we can expect worsening situation on the ground, and the second coronavirus death in the US attests to that. For now however, it appears that stocks are positively discounting the steps to-be-announced that aim to soften the hit to economic activity.
And as we have seen in 2009, bad news can keep coming in long after stocks embark on an uptrend. That's fine because markets are forward-looking.Technically, prices are trading just in the middle of two orange zones. The upper one acts as a resistance (sending stocks lower in today's overnight trading), while the lower one acts as a support. Unless we see one or the other broken either way, prices are range-bound as the market asesses and reassesses the evolving impact of the coronavirus story.
But that doesn't mean there are no opportunities in such a sideways market. Short-term sideways until proven otherwise. The scenario we see as most likely, is an upswing attempt in the coming day(s) that would be followed by another wave of selling once the enthusiams about policy response expectations wears a bit off.
This fundamental hypothesis is supported by both the weekly and monthly charts. They're leaning in the direction of some more pain to come.
Therefore, this is what makes most sense to us from the risk reward-reward perspective - watch the bulls' performance at the nearest resistance just above 3000. Should the bulls falter, we'll consider opening short positions.
Summing up, the medium-term S&P 500 outlook has shifted to bearish, and more downside remains probable before this correction is over both in time in in price. Both the monthly and weekly charts attest to that. The daily charts' divergencies between RSI, CCI and stock prices aren't yet finished being resolved to the downside. While Friday's upswing may appear encouraging to the bulls, one swallow doesn't make summer. Despite today's higher prices, another wave of selling still appears likely. We'll keep a close eye on the bulls' performance and what kind of shape the monetary policy catalyst of today's higher prices takes, and act accordingly.
If you enjoyed the above analysis and would like to receive daily premium follow-ups, we encourage you to sign up for our Stock Trading Alerts to also benefit from the trading action we describe - the moment it happens. The full analysis includes more details about our current positions and levels to watch before deciding to open any new ones or where to close existing ones.
Thank you.
Monica Kingsley
Stock Trading Strategist
Sunshine Profits - Effective Investments through Diligence and Care
-
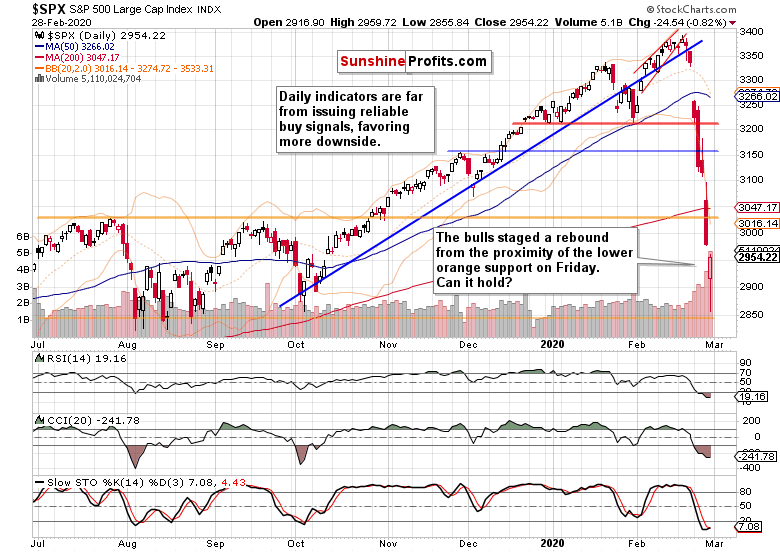
Stocks Cut Through Supports Like a Hot Knife Through Butter
February 28, 2020, 9:50 AMDuring the first half of yesterday's session, the bulls were in the driving seat after repelling sellers at the open. Yet again, their gains have evaporated, and stocks not only broke to new lows, but also closed there. Will today's session be any different?
With the sizable daily volatility, it's well worth checking the downswing on the weekly chart (charts courtesy of http://stockcharts.com).

Yesterday's plunge took prices all the way down to the lower border of the rising black trend channel, and then some. The breakdown hasn't been confirmed yet, but unless the bulls really show up today, prices will close the week below the channel. And frankly, we don't expect them to.
Our yesterday's observations ring as true today as they did throughout the week:
(...) Yesterday's slide turned the weekly indicators' sell signals even more into negative territory. The bulls woefully failed to lift prices and this week's sizable bearish gap stands unchallenged. Both the gap and the indicators continue to support the bears.
The preceding divergencies are still being resolved. Let's quote our Monday's observations when we discussed the comparison between:
(...) the levels of both of these indicators with the price action. Stocks have been rising while both the RSI and CCI made lower highs. You can see it marked on the above chart with thin black lines. We have two divergences here - in other words, they didn't confirm the price advance.
How does yesterday's session look on the daily chart?

Another day, another bearish gap. The opening bell was met with heavy selling, which took stocks right through the upper orange support, reaching 3006. The bulls stepped in and midway into the session, it appeared that the breakdown attempt would be invalidated. But as the closing bell draw nearer, the bears kept driving prices back through the orange support, forcing a close well below it.
Our subscribers have been ready, and we captured more than 95 points of the slide.
And what about today?
The bulls are attempting to lift prices in the premarket trading. Yet, they have reached only 2950 so far. Not a really convincing show of strength. It looks like we're in for yet another dead-cat bounce.
There are quite a few reasons for why this slide has more to go.
In yesterday's Alert, we have commented extensively on the evolving coronavirus situation the ground. The only thing to add today, is to pinpoint the likely catalyst - the first US case without any ties to China. Now, we'll expand the below assessment along the economic lines:
(...) In public consciousness, this has further to go before true panic has been reached. The reality is currently only starting to be recognized, there's still some denial present in the mix. Burying head in the sand, if you will.
Fundamentally, we haven't yet seen earnings impact. The same goes for mounting supply chain disruptions. Consumer confidence still remains high. So do sales. That's the low-hanging fruit...
It makes sense to strike an optimistic tone when addressing the crisis. It's about managing expectations and softening the blow the virus is making on economic activity and consumer perceptions. The toll is heavy already, and likely to get worse before it gets better again.
Some places are attempting to counter the economic impact. Hong Kong has announced cash handouts and tax relief to its residents in a confidence boost attempt. The bets on Fed taking action have sharply increased - will the rate cut come as early as March?
Let's check now how the risk-off trade has been doing since we showed you the US Treasuries and Japanese yen charts yesterday. Is it still hotly pursued as our yesterday's comments have indicated?
Let's start with US Treasuries - the 30-year bond yield has been plunging to new lows. When its yield goes down, it indicated that the demand for safety of US Treasuries is overwhelming the supply. Whenever yield plunges without end in sight, it indicates stress in the system. Little surprise that stocks are taking it on the chin. See for yourself the below chart.

Next, let's examine the key move underway in the Japanese yen. This safe-haven currency also points to the rising risk-off trade appeal:

The awaited breakdown below the declining black trend line came already yesterday, and the daily indicators continue favoring more downside. Looking at today's action so far, the rising red trend line has already been broken as the pair trades at around 108.65 currently. Will the 200-day moving average provide an excuse for the bulls to step in?
Both of these charts confirm the downside move in stocks and hint at more to come.
But where is the next support located? The daily chart shows that the lower orange support just below 2850 could be next in line. But is the momentum as strong so as to reach these August and October 2019 lows?
As the S&P 500 futures change hands at around 2925 currently, it appears likely that the bears will show up in force today as well. After all, they annihilated yesterday's 90 point rally within a few short hours. It's not unthinkable they'll repeat the same feat today should another relief rally arrive.
Let's quote our Wednesday's comments:
(...) Unless we see response on par with the People's Bank of China interventions, which would radically change the game, S&P 500 rallies should be viewed with a hefty dose of skepticism.
Therefore, we're of the opinion that a short position is justified from the risk-reward perspective. Our subscribers have the trade position details.
In the current environment, we aim to ride the very likely downswing all the way to the next important support and possibly beyond. Depending on the commitment of the bulls and breaking announcements, we'll manage our open trade accordingly.
Summing up, the medium-term S&P 500 outlook has shifted to bearish, and more downside remains probable before this correction is over both in time in in price. Both the daily and weekly charts attest to that. The divergencies between RSI, CCI and stock prices aren't yet finished being resolved to the downside. The slide continues and all we've been getting, were dead-cat bounces. While the daily volatility is at recent record highs, the weekly one still has a way to go. The failures of the bulls throughout the week favors more downside before the panic selling is over - and we aim to milk it for what it's worth. We've not yet seen a catalyst that would facilitate the reversal higher, and buy-the-dip mentality doesn't seem to be a winning proposition these days. While the stock bull market remains intact in the long term, it appears too early to bet on letting its many long-term bullish factors work to our benefit.
If you enjoyed the above analysis and would like to receive daily premium follow-ups, we encourage you to sign up for our Stock Trading Alerts to also benefit from the trading action we describe - the moment it happens. The full analysis includes more details about our current positions and levels to watch before deciding to open any new ones or where to close existing ones.
Thank you.
Monica Kingsley
Stock Trading Strategist
Sunshine Profits - Effective Investments through Diligence and Care -
Stock Performance in the Rising Coronavirus Fever
February 27, 2020, 8:57 AMThe bulls didn't really get their act together yesterday, and the early gains evaporated a few hours into the session. As stocks closed near their daily lows, what chances of invalidating Tuesday's breakdown below the important support do the buyers have?
Let's briefly check what kind of progress the bears made yesterday on the weekly chart (charts courtesy of http://stockcharts.com).

Having reached its midpoint, the bears are cutting ever deeper into the rising black trend channel. Our yesterday's observations ring as true today as they did yesterday:
(...) Yesterday's slide turned the weekly indicators' sell signals even more into negative territory. The bulls woefully failed to lift prices and this week's sizable bearish gap stands unchallenged. Both the gap and the indicators continue to support the bears.
The preceding divergencies are still being resolved. Let's quote our Monday's observations when we discussed the comparison between:
(...) the levels of both of these indicators with the price action. Stocks have been rising while both the RSI and CCI made lower highs. You can see it marked on the above chart with thin black lines. We have two divergences here - in other words, they didn't confirm the price advance.
Now, let's focus on yesterday's session on the daily chart below.

Despite the bullish opening gap and the buyers keeping momentum for a few hours after yesterday's open, stocks rolled over to the downside. As the index was giving up its opening gains, we've sent a quick intraday Alert to our subscribers, telling them about our decision to jump in on the short side.
And as you can see on the chart above, it was a profitable trading move. Especially if you take a look at today's premarket action - after yesterday's 3117 close, the futures are quoted at 3085 currently, and set to open with yet another bearish gap today. More power to the sellers.
We've seen another overnight bounce that fizzled out. The bulls made it to 3104, but were unable to keep gained ground again. Looks like one more dead-cat bounce that's over.
There are quite a few reasons for why this slide has more to go.
Yesterday, we have commented extensively on the coronavirus. Let's recall the key aspects and build up on them:
(...) As stocks started their recovery earlier in February, it was driven by the widespread assessment that coronavirus would be contained and dealt with within China. That has clearly not happened and there're multiple signs that the crisis is far from over. So are its economic costs and supply chain disruptions.
Let's recount the facts. The Iranian coronavirus strain is different from the Wuhan one, highlighting its ability to mutate. We now face self-sustaining outbreaks around the world. Just how have they leapfrogged the harsh quarantines in China? The fear around the world is palpable and the US is starting to catch up. Incidentally, the CDC announcement that it's a question of when rather than if coronavirus reaches America, poured fuel to the fire.
And the array of industries affected by the hits to their production and logistics lines is growing. That affects both product rollouts and earnings expectations. We've seen that earlier e.g. with Apple. The virus fallout is growing, and the narrative has taken over the market place. US - China trade war or other issues are very much on the back burner now. Unless the central banks step in more aggressively, the virus fallout recognition will rule the day.
While the bets on Fed rate cuts coming soon have increased, we haven't seen any shift attributable to coronavirus in Fed governors' rhetorics just yet. As the charts below (courtesy of Google Trends) show, the US still remains relatively complacent on coronavirus compared to the rest of the world. Human nature is universal, and once confirmed positives start cropping up, the Americans' fear level will move higher as well.
And taking into account that the second wave of spike in fears is virtually guaranteed to surpass the first one, we've quite a way to go in the States. With the speading count of infections in various countries, the world is becoming recognized as coronavirus' oyster now. And this would bring more attention and consequences than when it was perceived as a China affair only.
Have you seen the Trump and coronavirus Task Force press conference? Assurances and hints that the impact on the American people would be low. Knock-on effects appear being downplayed. That doesn't square off with the CDC's Nancy Messonier point on inevitability of community outbreaks, perceived lack of functioning testing kits on the ground, or the Atlanta airport GM saying that 200 passengers showing coronavirus symptoms being just told to self-quarantine...
Orange County declared emergency. Michigan is monitoring over 300 people for coronavirus but zero have been tested. In public consciousness, this has further to go before true panic has been reached. The reality is currently only starting to be recognized, there's still some denial present in the mix. Burying head in the sand, if you will.
Fundamentally, we haven't yet seen earnings impact. The same goes for mounting supply chain disruptions. Consumer confidence still remains high. So do sales. That's the low-hanging fruit...
It should not come as a surprise, that the risk-off trade is hotly pursued.
Let's explore its two leading metrics - we'll start with US Treasuries examination.
On the long end of the curve, there is the 30-year bond. Its yield has been plunging to new lows. That's what happens when there's high demand for the bond - its yield goes down as the holders demand a higher price to part with the bond. See for yourself the below chart.

It indicates fear, which puts pressure on risk-on assets such as stocks. We are talking stocks as a whole, the full spectrum - not the defensive ones such as healthcare, consumer staples or utilities - these usually perform better than their more sensitive peers in such times.
Another way to assess the flight-to-safety trade, is to look at the performance of Japanese yen. Similarly to Swiss franc, it acts as a safe-haven currency. These currencies rise as investors seek refuge, making even the mighty dollar suffer.
Remember, these are the carry trade currencies. Their negative yields serve as the incentive for traders to borrow in them, turn around and invest into yield-bearing assets elsewhere - be it the safety of Treasuries or various emerging markets' assets. These no-brainer trader work just great - until they don't. Unwinding these investments weighs on heavily on the markets.
So, let's see how the Japanese yen (both a safe-haven and carry trade currency) has been doing lately:

Breaking below the declining black trend line appears to be a question of a relatively short time. The daily indicators clearly favor more downside. The 50-day moving average or the rising red trend line can give the bulls the reason to step in, as yesterday's rally has clearly fizzled out.
Either way, there's quite some way to go on the downside. Fundamentally speaking, that would provide stiff headwind to stocks - just as the falling bond yields do.
Let's turn again to our yesterday's words:
(...) Downside moves during bull markets are here to either scare you out, or wear you out. This is the formed case. Let's remember the big picture though - we're in a stock bull market, actually the longest-running one, and there're sizable gains ahead to enjoy down the road.
That's true despite all the damage we would see on the monthly chart when February is over, but arguably, we've not yet reached the moment of blood in the streets. Yesterday's notable absence of the bulls is a not-so-subtle proof of that.
While it's true that markets and forward-looking and discounting mechanisms, they appear not to have yet digested the coronavirus impact whose count is rising day-by-day.
Taking all the above into account, our profitable short position remains justified (position details are reserved for our subscribers) and unless we see a true game changer, rallies are to be viewed with suspicion. In the current environment, we aim to ride the very likely downswing all the way to the next important support and possibly beyond. Depending on the commitment of the bulls and breaking announcements, we'll manage our open trade accordingly.
Summing up, the medium-term S&P 500 outlook has shifted to bearish, and more downside remains probable before this correction is over both in time in in price. Both the daily and weekly charts attest to that. The divergencies between RSI, CCI and stock prices aren't yet finished being resolved to the downside. The slide continues and all we've been getting, were dead-cat bounces. While the daily volatility is at recent record highs, the weekly one still has a way to go. The failures of the bulls throughout the week favors more downside before the panic selling is over - and we aim to milk it for what it's worth. We've not yet seen a catalyst that would facilitate the reversal higher, and buy-the-dip mentality doesn't seem to be a winning proposition these days. While the stock bull market remains intact in the long term, it appears too early to bet on letting its many long-term bullish factors work to our benefit.
If you enjoyed the above analysis and would like to receive daily premium follow-ups, we encourage you to sign up for our Stock Trading Alerts to also benefit from the trading action we describe - the moment it happens. The full analysis includes more details about our current positions and levels to watch before deciding to open any new ones or where to close existing ones.
Thank you.
Monica Kingsley
Stock Trading Strategist
Sunshine Profits - Effective Investments through Diligence and Care
Free Gold &
Stock Market Newsletter
with details not available
to 99% investors
+ 7 days of Gold Alerts
Gold Alerts
More-
Status
New 2024 Lows in Miners, New Highs in The USD Index
January 17, 2024, 12:19 PM -
Status
Soaring USD is SO Unsurprising – And SO Full of Implications
January 16, 2024, 8:40 AM -
Status
Rare Opportunity in Rare Earth Minerals?
January 15, 2024, 2:06 PM

