

-
Will Stocks Be Brady or Mahomes?
February 8, 2021, 9:24 AMOne week, Reddit bandits take on hedge funds and win, pumping up stocks like GameStop and AMC while the broader market sees its worst decline since October.
What a difference a week can make.
The indices then see their most significant gains the next week since Joe Biden's election victory and don't see a down day all week.
Now we're here- still amid a tug of war between sentiments. For now, though, things are looking rosy. That is, of course, unless you're Patrick Mahomes this morning.
Can the market keep up it’s winning streak this week? It’s possible. But I’d be surprised if we don’t see at least one sharp pullback before this Friday (Feb. 12).
Can the market keep up its winning streak this week? It's possible. But I'd be surprised if we don't see at least one sharp pullback this week.
Despite tailwinds moving the markets right now, such as stimulus progress, an ever-improving vaccine delivery, the possibility of an effective one-dose vaccine from Johnson and Johnson (JNJ), falling COVID numbers, and an improving economic outlook based on consistently falling jobless claims and corporate earnings that continue to crush, I want you to be wary of complacency and overvaluation.
Yes, I know I keep saying this. I also know that earnings are on pace to rise by over 20% in 2021. Since 1980, only 12 years have earnings increased by 15% or more. Except for 2018, the market gained an average of 12% in all of those years.
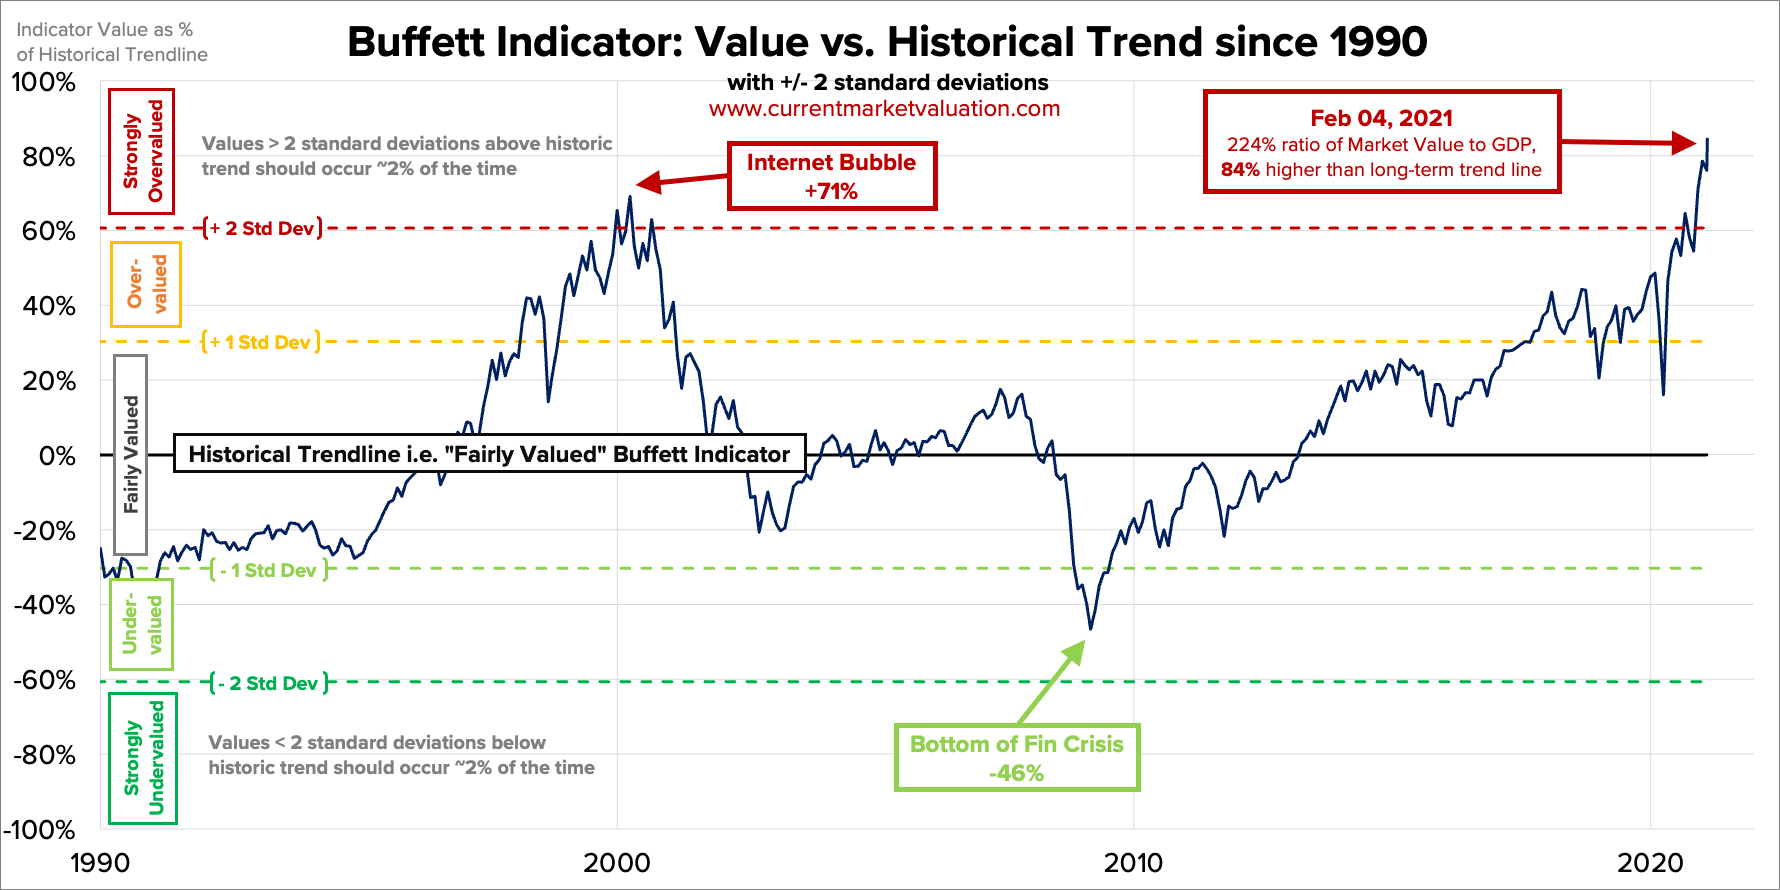
But consider some valuation metrics that scream “bubble.”
As of February 4, 2021, the Buffett Indicator, or the ratio of the total US stock market valuation to the GDP, was at a level not seen since the dotcom bubble. If you take the US stock market cap of $48.7 trillion and the estimated GDP of $21.7 trillion, we're nearly 224% overvalued and 84% above the historical average.

With the S&P 500, Nasdaq, and Russell 2000 all currently trading at record closes, fears of a bubble are genuine. The S&P 500’s forward 12-month P/E ratio is back to above 22 and well above the 10-year average of 15.8. The Russell 2000 is also back at a historic high above its 200-day moving average. Tech stock valuations are also approaching dot-com bust levels.
Yes, the outlook is healthy and for good reason. According to a recent Bank of America survey of 194 money managers, bullishness on stocks is at a three-year high, and the average share of cash in portfolios, a sign of protection from market turmoil, is at its lowest level since May 2013.
But always remember that when the market gets what it expects, and we’re expecting strength by mid-year, it’s usually a time to sell rather than buy.
While I don’t foresee a crash like we saw last March, I still maintain that some correction before the end of Q1 could happen.
Corrections are healthy and normal market behavior, and we are long overdue for one. They are also way more common than most realize. Only twice in the last 38 years have we had years WITHOUT a correction (1995 and 2017).
A correction could also be an excellent buying opportunity for what could be a great second half of the year.
My goal for these updates is to educate you, give you ideas, and help you manage money like I did when I was pressing the buy and sell buttons for $600+ million in assets. I left that career to pursue one where I could help people who needed help, instead of the ultra-high net worth.
With that said, to sum it up:
While there is long-term optimism, there are short-term concerns. A short-term correction between now and the end of Q1 2021 is possible. I don't think that a decline above ~20%, leading to a bear market will happen.
Hopefully, you find my insights enlightening. I welcome your thoughts and questions and wish you the best of luck.
How Frothy is Tech Again?

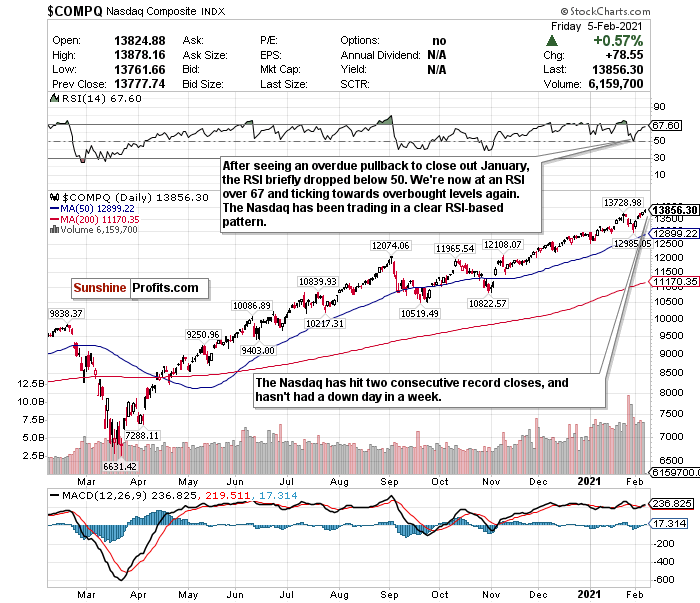
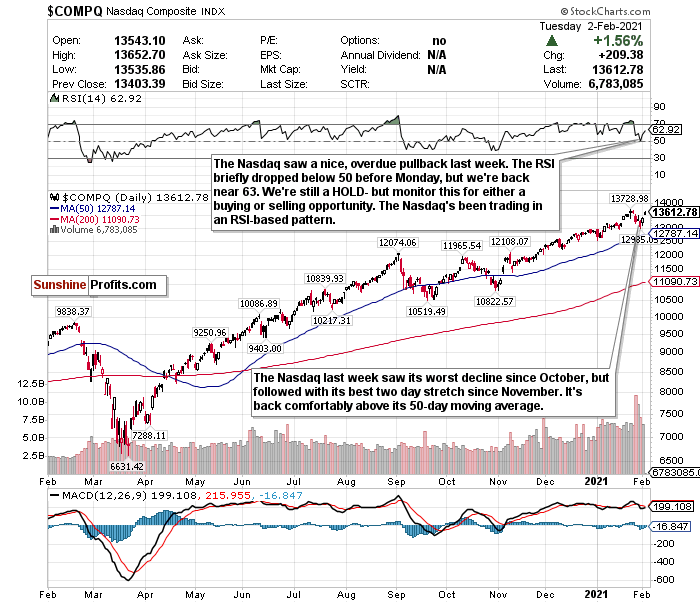
Figure 1- Nasdaq Composite Index $COMP
I remain bullish on tech. Its earnings continue to defy expectations with stocks like Amazon, Alphabet, PayPal, and eBay all crushing estimates last week. I’m also especially bullish on subsectors such as cloud computing, e-commerce, and fintech for 2021.
But please monitor the RSI.
The Nasdaq is opening the week at another record high and is continuing to show strength. But there are clear echoes of the dotcom bubble 20-years ago, and the index has been trading in an RSI-based pattern.
Let’s break down the Nasdaq since December and how it has reacted whenever the RSI has exceeded 70.
December 9- exceeded an RSI of 70 and briefly pulled back.
January 4- exceeded a 70 RSI just before the new year, and declined 1.47%.
January 11- declined by 1.45% after exceeding a 70 RSI.
Week of January 25- Exceeded an RSI of over 73 before the week, and declined 4.13% for the week.
Every single time the RSI exceeded 70, I switched my Nasdaq call to a SELL.
Why?
The Nasdaq is trading in a precise pattern.
The RSI is at around 67.50 so I’m not ready to switch my call again. But I am a bit concerned. Tech valuations, especially the tech IPO market, terrify me. SPACs don’t help either.
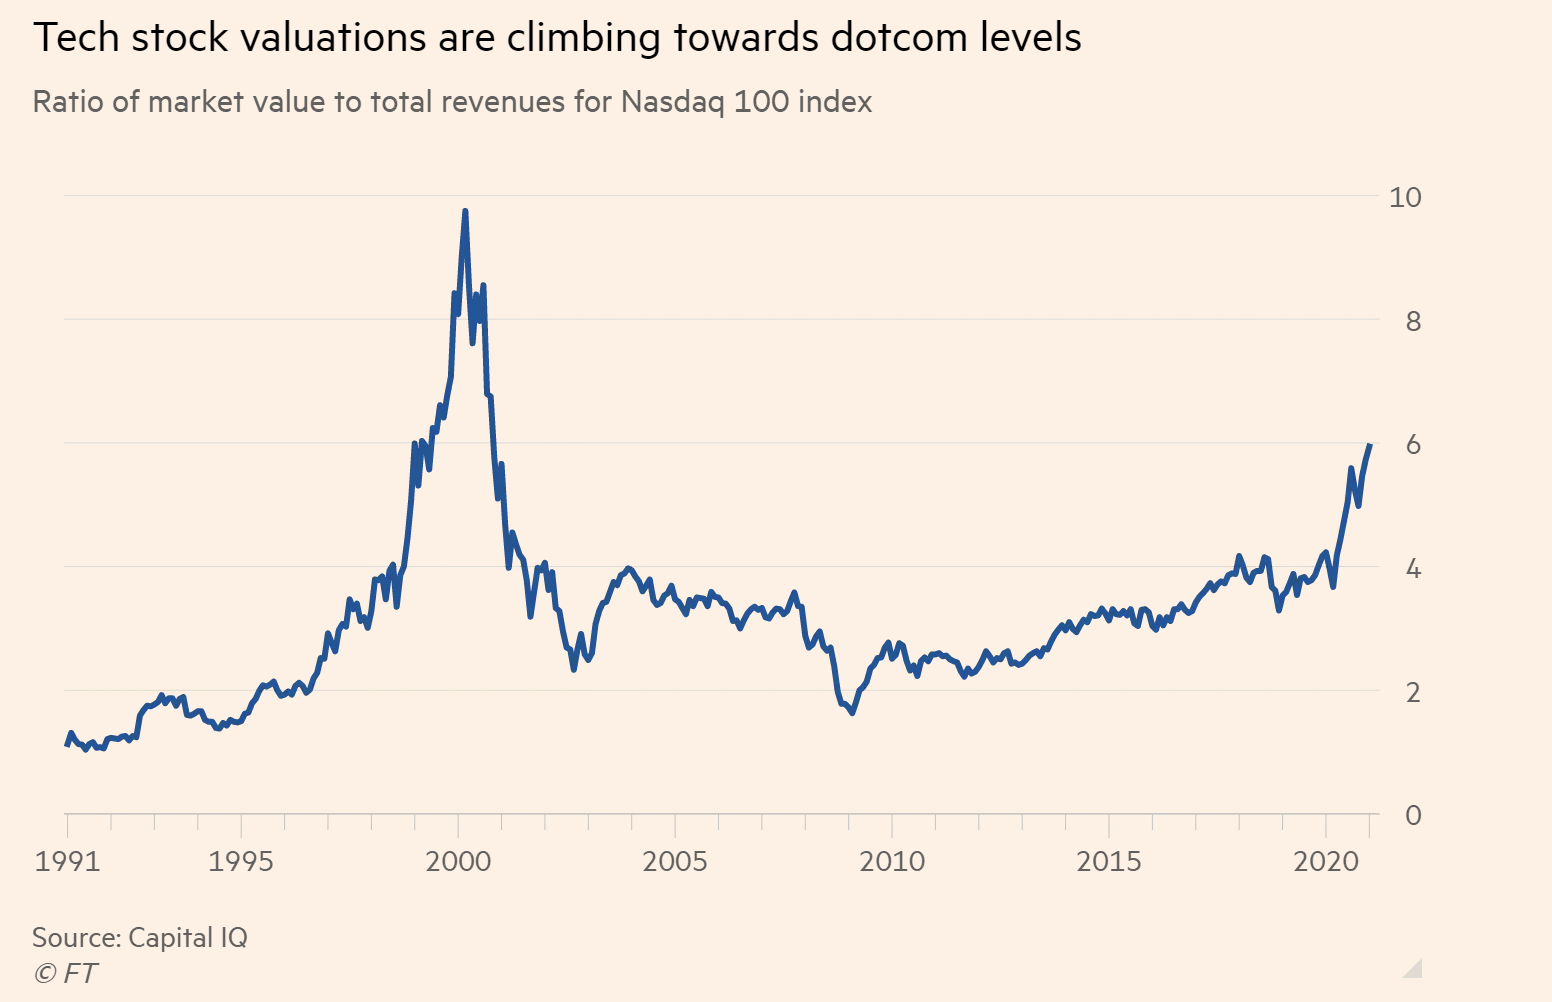
The ratio of market value to total revenues has also not been this high since the dotcom bust.

I still like tech and am bullish for 2021. But for now, I'm going to stay conservative and say HOLD while monitoring the RSI.
For an ETF that attempts to directly correlate with the performance of the NASDAQ, the Invesco QQQ ETF (QQQ) is a good option.
Thank you for reading today’s free analysis. If you would like to receive daily premium follow-ups, I encourage you to sign up for my Stock Trading Alerts to also benefit from the trading action described - the moment it happens. The full analysis includes more details about current positions and levels to watch before deciding to open any new ones or where to close existing ones.
Thank you.
Matthew Levy, CFA
Stock Trading Strategist -
Bulls on Stock Parade
February 5, 2021, 9:09 AMIs this week, dare I say, the first "normal" week of 2021? Let’s take a look at what has happened in January so far in what is supposed to be a more prosperous year than 2020.
Six days into 2021, the Capitol saw its first insurrection since 1814.
Two weeks later, we inaugurated a new president.
A week later, we saw class warfare before our eyes when Redditors from the "WallStreetBets" subreddit took on hedge funds and won.
After declining in two of the last four weeks, the indices haven't seen a single down day all week. If Friday (Feb. 5) futures stay the same, we might not have a down day all week.
Bulls on parade.
Good morning investors, thanks for finally caring about strong earnings and not paying attention to GameStop (GME) (that was fun while it lasted, though).
The sentiment is rosey and for good reason. Earnings continue to crush. Some form of President Biden’s aggressive stimulus could also pass within days. Jobless claims fell for the third consecutive week and hit the lowest level since the end of November, labor market data looks strong, vaccines hit a record daily total on Thursday (Feb. 4) and could be distributed at CVS and Walgreens within days, and the 5-to-30 year treasury curve was the highest its been since March 2016.
Johnson & Johnson (JNJ) also just applied to the FDA for emergency use authorization for its one-dose vaccine. If approved, it could be game-changing.
Happy days.
My overheating and trading concerns in an overbought market remain, though, and have returned with a vengeance. I liked where many sectors and indices ended last week for potential BUY opportunities. This blazing win streak, though, is teetering on the edge of mania and overvaluation again.
The S&P 500, Nasdaq, and Russell 2000 hit new record closes yet again.
Are we in a bubble? Maybe.
I worry about complacency and overvaluation.
The S&P 500’s forward 12-month P/E ratio is back to nearly 22 and well above the 10-year average of 15.8. The Russell 2000 is also back at a historic high above its 200-day moving average. Tech stock valuations are even approaching dot-com bust levels, once again.
According to a recent Bank of America survey of 194 money managers, bullishness on stocks is at a three-year high, and the average share of cash in portfolios, which is usually a sign of protection from market turmoil, is at the lowest level since May 2013.
The market needed last week’s pullback, but it was nothing but a minor cooldown period thanks to Reddit in the grand scheme of things.
We are long overdue for a correction. Corrections are healthy for markets and more common than most realize. Only twice in the last 38 years have we had years WITHOUT a correction (1995 and 2017).
Well, hello, we haven’t seen one since last March!
A correction could also be an excellent buying opportunity for what should be a great second half of the year.
My goal for these updates is to educate you, give you ideas, and help you manage money like I did when I was pressing the buy and sell buttons for $600+ million in assets. I left that career to pursue one where I could help people who needed help, instead of the ultra-high net worth.
With that said, to sum it up:
While there is long-term optimism, there are short-term concerns. A short-term correction between now and the end of Q1 2021 is possible. I don't think that a decline above ~20%, leading to a bear market will happen.
Hopefully, you find my insights enlightening. I welcome your thoughts and questions and wish you the best of luck.
Four Days in a Row and Counting for the S&P 500...

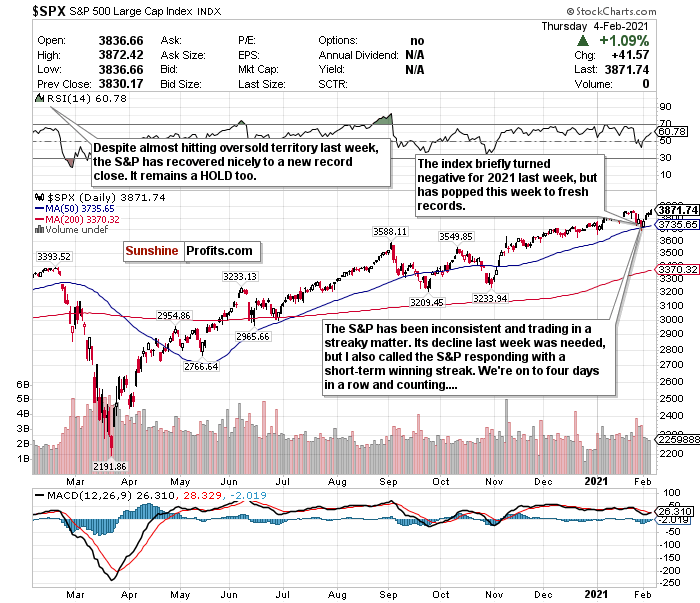
Figure 1- S&P 500 Large Cap Index $SPX
Have you ever rooted so hard for a team that can frustrate and excite you at the same time? Rip off a 4-day winning streak, followed by a slump of losing 5 out of 6 games, then come back with another winning streak? Does it have you questioning if the team is outstanding or a mirage?
If I could compare the S&P 500 to a team, it would probably be the Philadelphia 76ers.
This index looks like a winner and seemingly rips off multiple-day winning streaks weekly. Now and then, though, it can show inconsistency, make you scratch your head, and go on a frustrating losing streak.
Two weeks ago, the S&P was hovering around a record-high. Its forward P/E ratio was the highest since the dot-com bust, and the RSI consistently approached overbought levels.
By the end of last week, it was nearly oversold.
Now, this week? Its RSI is back above 60, we’re at another record high, we’re on a four-day winning streak (which could be five if futures remain in the green), and we’re at a forward 12-month P/E ratio at nearly 22 and well above the 10-year average of 15.8.
I said before that once the S&P approaches a 3600-level, we can start talking about it as a BUY. Well, the index came pretty darn close to it last week, but it wasn’t enough for me. Despite this week’s rally, short-term concerns remain, with long-term optimism.
To me, because of the RSI and how the index has traded, it remains a HOLD. But we’re teet
A short-term correction could inevitably occur by the end of Q1 2021, but for now, I am sticking with the S&P as a HOLD.
For an ETF that attempts to directly correlate with the performance of the S&P, the SPDR S&P ETF (SPY) is a good option.
Thank you for reading today’s free analysis. If you would like to receive daily premium follow-ups, I encourage you to sign up for my Stock Trading Alerts to also benefit from the trading action described - the moment it happens. The full analysis includes more details about current positions and levels to watch before deciding to open any new ones or where to close existing ones.
Thank you.
Matthew Levy, CFA
Stock Trading Strategist -
GameStocks - Fun While It Lasted...
February 3, 2021, 9:18 AMSo how about GameStop (GME) and AMC (AMC)? That Silver short-squeeze? Fighting the man? That was fun while it lasted.
I don't want to lecture anyone or say that I told you so. During one of my newsletters last week, I even said that I tip my hat to anyone who profited from this—all the respect in the world.
Me personally, though, I would never trade like this. Monday (Feb. 1) and Tuesday's market (Feb. 2) was nothing more than a reality check. GameStop's stock has lost nearly half of its value, and other Reddit darlings like AMC, Blackberry (BB), Koss (KOSS), and Silver (SLV) tanked.
Stocks don't go up forever.
Stonks especially don’t.
Who knows, maybe the party's not over. But I think the plummet in the Reddit stocks was bound to happen. Bubbles always eventually pop.
The market seems happy that the earth is back on its axis in stockland. The indices have recovered nearly all of last week's losses already.
I didn't call the GameStop short-squeeze, but I had called last week's downturn for a while. The recovery so far this week wasn't entirely surprising either.
Be that as it may, I remain concerned about complacency in the markets and overstretched valuations, plus the potential return of inflation. But the breather last week was needed and brought the indices to less overbought levels.
Generally, investors and analysts are bullish these days. According to a recent Bank of America survey of 194 money managers, bullishness on stocks is at a three-year high, and the average share of cash in portfolios, which is usually a sign of protection from market turmoil, is at the lowest level since May 2013.
We have still not declined 10% from the record highs- the minimum needed for a correction. Although the market needed last week's downturn, we're once again mostly right where we were several days ago.
I know what you’re thinking. Amazon (AMZN) and Alphabet (GOOGL) are the latest companies to crush their earnings estimates, how could we possibly have a correction?
For one, there are still things to be concerned about from a public health and economic perspective.
We are also long overdue for one. We haven't seen one since last March. Corrections are healthy for markets and more common than most realize. Only twice in the last 38 years have we had years WITHOUT a correction (1995 and 2017).
A correction could also be an excellent buying opportunity for what should be a great second half of the year.
We're no longer as close to those same BUY levels as we were after market close on Friday. But we're not quite at SELL again, and I still think we're a few pullbacks away from making more BUY calls with conviction. In other words, welcome to no man's land.
In my last newsletter, I cautioned against making manic moves and trading with emotions. We saw our worst week since October last week and declined in two of the previous three. Much of that was due to the GameStops and AMCs freaking out Wall Streeters. But I reminded you then, and I'll remind you again. Shares of Eastman Kodak surged by 1,481% in three days last July, and the broader market seems to have done just fine since then.
Do not let the noise deter you from your goals. My goal for these updates is to educate you, give you ideas, and help you manage money like I did when I was pressing the buy and sell buttons for $600+ million in assets. I left that career to pursue one where I could help people who needed help, instead of the ultra-high net worth.
With that said, to sum it up:
While there is long-term optimism, there are short-term concerns. A short-term correction between now and the end of Q1 2021 is possible. I don't think that a decline above ~20%, leading to a bear market will happen.
Hopefully, you find my insights enlightening. I welcome your thoughts and questions and wish you the best of luck.
We're all in this together!
Is It Safe to Buy Tech Again?

Figure 1- Nasdaq Composite Index $COMP
Earnings season for tech stocks hit record numbers last week, and is set to continue this week with Amazon and Alphabet clobbering estimates. Usually, when investors get what they expect, it’s more of a reason to sell rather than buy.
But the Nasdaq so far this week has already recovered almost all of last week’s losses, and then some.
I’m not ready to call this a BUY though, or recommend buying into momentum. There are still concerns. Tech valuations, especially the tech IPO market, terrify me. SPACs don’t help either. The Nasdaq last week declined to a more "normal" level, and in the span of two days, hit an RSI approaching 63 again.
Last week's decline was needed, but there are still echoes of the dot-com bubble 20-years ago. I remain bullish on earnings and tech sectors such as cloud computing, e-commerce, and fintech for 2021, but please monitor the RSI.
The RSI is how I have called the Nasdaq since December. While an overbought or oversold RSI does not automatically mean a trend reversal, it has with the Nasdaq.
The Nasdaq pulled back on December 9 after exceeding an RSI of 70 and briefly pulled back again after passing 70 again around Christmas time. We also exceeded a 70 RSI just before the new year, and what happened on the first trading day of 2021? A decline of 1.47%.
When I changed my Nasdaq call from a HOLD to a SELL on January 11 after the RSI exceeded 70, the Nasdaq declined again by 1.45%.
Before the Nasdaq exceeded an RSI over 73 prior to January 25th, I switched my call back to SELL, and the QQQ promptly declined 4.13% for the week.
The Nasdaq is trading in a precise pattern.
I still like tech and am bullish for 2021. But for now, I'm going to stay conservative and say HOLD.
For an ETF that attempts to directly correlate with the performance of the NASDAQ, the Invesco QQQ ETF (QQQ) is a good option.
Thank you for reading today’s free analysis. If you would like to receive daily premium follow-ups, I encourage you to sign up for my Stock Trading Alerts to also benefit from the trading action described - the moment it happens. The full analysis includes more details about current positions and levels to watch before deciding to open any new ones or where to close existing ones.
Thank you.
Matthew Levy, CFA
Stock Trading Strategist -
Has the “Stock Market Bubble” Started to Pop?
February 1, 2021, 9:17 AMAfter what happened last week with beaten-down stocks such as GameStop (GME) and AMC (AMC), there are indeed signs of a bubble forming. While these stocks don’t necessarily reflect the broader market, I have been calling a downturn for weeks.
Complacency is by far the most significant risk in the markets right now, along with overstretched valuations beyond the GameStop “stonks,” and the possible return of inflation if the Fed lets the GDP run hot like I think they will.
According to a recent Bank of America survey of 194 money managers, bullishness on stocks is at a three-year high, and the average share of cash in portfolios, which is usually a sign of protection from market turmoil, is at the lowest level since May 2013.
Complacency.
I still think we are long overdue for a correction since we haven't seen one since last March. The manic moves of the past week excite me but greatly concern me.
Corrections are healthy for markets and more common than most realize. Only twice in the last 38 years have we had years WITHOUT a correction (1995 and 2017).
Thus far, what has occurred in January could be the potential start of the correction I have been forecasting. A correction could also be an excellent buying opportunity for what should be a great second half of the year.
We could also finally be approaching BUY levels on many of the SELL and HOLD calls I’ve made the last few weeks.
Outside of my BUY call on the iShares MSCI Taiwan ETF (EWT), which has gained 10.12% since I made the call on 12-3, I called the Nasdaq and the Russell both overbought and foresaw last week’s downturn.
I made the SELL call on the QQQ Nasdaq ETF 1-25, and since then, it has declined 4.13%. I made the SELL call on the Russell 2000 IWM ETF 12-16 anticipating this eventual pullback. The Russell is now at its lowest level since the beginning of the year declined 4.30% in the last week.
I also called the Invesco Optimum Yield Diversified Commodity Strategy No K-1 ETF (PDBC) a BUY on 12-3, and it has gained 8.33%.
Meanwhile, I’ve called the Dow Jones a HOLD for the last two months, and since 12-3, it is practically flat and up 0.15%.
I’m not highlighting these calls to brag or toot my own horn. I’m highlighting these calls to remind everyone to please be level headed during these manic times and to please understand that stocks don’t only go up. The market saw its worst week since October last week, and has now declined in two of the last three weeks. More could come in the short-term.
While GameStop and AMC are exciting, understand the risks you’re taking and don’t follow the herd.
On the other hand, do not run and hide from a market decline, and do not let this deter you from chasing your goals. The market has overheated, but it is still not quite a broad sector-specific bubble like it was back in 2000. Yes, there are sectors more overvalued than others. But as we saw last week it’s more stock-specific. People still forget that shares of Eastman Kodak skyrocketed by 1,481% in three days last July. The broader indices seem to have done just fine since then.
My goal for these updates is to educate you, give you ideas, and help you manage money like I did when I was pressing the buy and sell buttons for $600+ million in assets. I left that career to pursue one where I could help people who needed help, instead of the ultra-high net worth.
With that said, Therefore, to sum it up:
While there is long-term optimism, there are short-term concerns. A short-term correction between now and the end of Q1 2021 is possible. I don't think that a decline above ~20%, leading to a bear market will happen.
Hopefully, you find my insights enlightening. I welcome your thoughts and questions, and wish you the best of luck.
We’re all in this together!
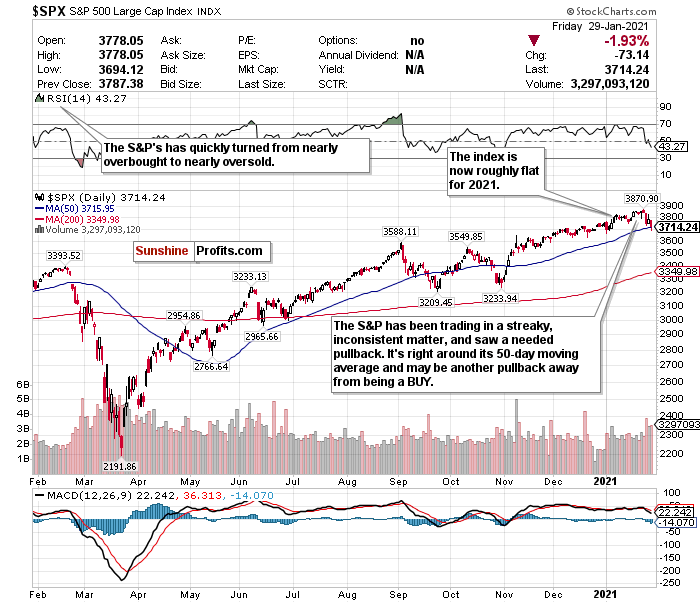
The S&P 500 May Be One More Pullback from a “BUY”

Figure 1- S&P 500 Large Cap Index $SPX
How quickly things change.
Before the start of last week, the S&P was hovering around a record-high. Its forward P/E ratio was the highest it’s been since the dot-com bust, and the RSI consistently approached overbought levels.
Now the question is, how soon before it’s a BUY? The index declined over -3.3% last week and has fallen in two of the previous three weeks. The S&P is also an index that trades in a streaky manner and can rip off multiple-day win streaks and lose streaks.
I said before that once the S&P approaches a 3600-level, that we can start talking about it as a BUY. There are short-term concerns, with long-term optimism. The S&P briefly dipped below 3700 on Friday, and the RSI is sitting around 43.25. To me, this keeps it at a HOLD, with maybe one or two pullbacks away from a BUY.
What does worry me a bit is a week full of more earnings beats did not impress the index. Investors likely anticipated this. Remember- when the market usually gets what it expects, it’s usually a reason to sell more than buy.
A short-term correction could inevitably occur by the end of Q1 2021, but for now, I am sticking with the S&P as a HOLD. You can definitely start “nibbling” though.
For an ETF that attempts to directly correlate with the performance of the S&P, the SPDR S&P ETF (SPY) is a good option.
Thank you for reading today’s free analysis. If you would like to receive daily premium follow-ups, I encourage you to sign up for my Stock Trading Alerts to also benefit from the trading action described - the moment it happens. The full analysis includes more details about current positions and levels to watch before deciding to open any new ones or where to close existing ones.
Thank you.
Matthew Levy, CFA
Stock Trading Strategist -
Stocks Pop as “Stonks" Controversial
January 29, 2021, 9:17 AMIn two weeks, Tom Brady vs. Patrick Mahomes will battle in the Super Bowl as the old guard vs. the new era. What's happening in the market right now is no different.
Think of Tom Brady as the hedge funds. As old Wall Street. As the suits. Think of Patrick Mahomes as the Reddit/Robinhood investor. The young renegade who could change the face of football or the stock market as we know it.
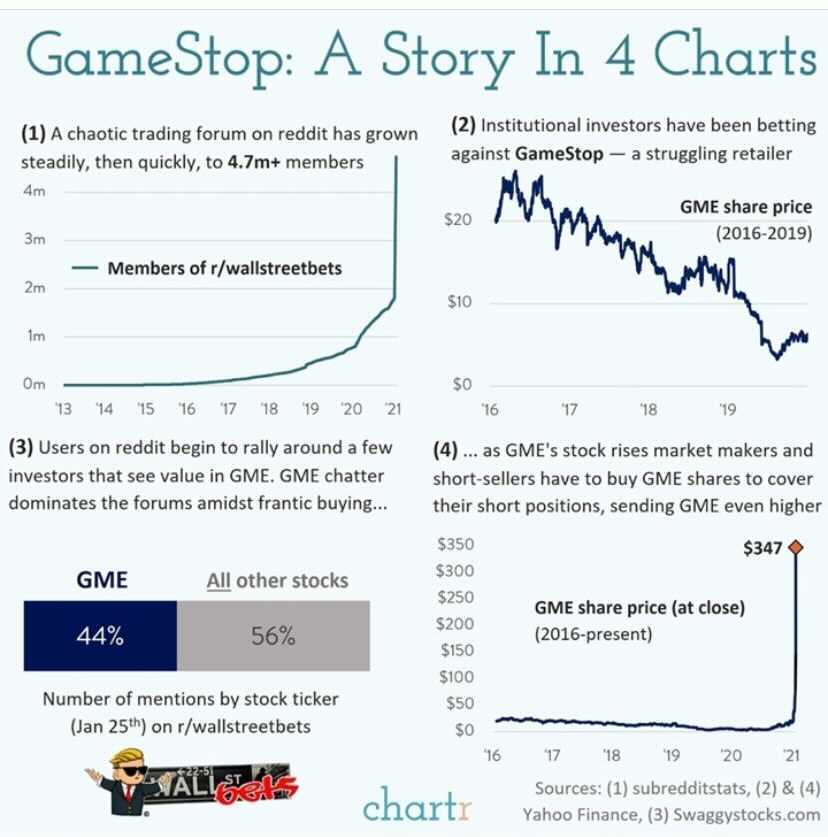
What's happened so far in 2021 is more significant than "stonks." What's happened is deeper than GameStop (GME) and AMC (AMC) surging by an astounding 1914.55% and 890.05%, respectively, year-to-date, thanks to these small-time investors.
We can make all the goofy stonk memes and laugh about how two has-been companies have suddenly become the new world currencies all we want.
But what happened is the potential changing of the guard of who the market-makers are.
I've been talking about a tug of war between good news and bad news and overvalued stocks (and "stonks") for weeks. But we have a new tug of war between the suits at Wall Street hedge funds and Reddit/Robinhood traders. The parallels between Brady vs. Mahomes are palpable.
The suits, aka the Tom Bradys, have been controlling the market for decades, manipulating it at their will.
But recently, a Reddit group called "WallStreetBets," i.e., the Patrick Mahomes traders, caught on to their game. This group made a joke about how poor GameStop's prospects were and how hilarious it was that hedge funds were shorting it en masse. So they banded together, bought enough shares of the stock to send it soaring, then forced the hedge funds to cover their shorts by buying it up some more!
WallStreetBets succeeded so much that they ended up closing a hedge fund’s entire GameStop position!
Mahomes beat Brady in a blowout.

Granted, what happened on Thursday (Jan. 28) when Robinhood and other trading platforms halted all trading of GME, AMC, and other "stonks" of the like is disturbing. People are complaining about censorship on social media, and this is no different. It's a war against the little guy.
But what does this show you? The power is in your hands now.
The suits are officially quaking in their fancy shoes and had to resort to drastic moves like this. These multi-billion dollar hedge funds probably called Robinhood in tears saying to stop the trades. Hedge-fund manager Leon Cooperman said as much when he appeared on CNBC Thursday with a sob story. It's quite similar to someone prominent who demanded to "stop the count" and "stop the steal" a few months ago.
Don't let this deter you from chasing your goals.
Now would I buy these stocks? No. It's not my style and not my philosophy. I think it's detached from reality and a dot-com bust all over again.
GameStop, AMC, Blackberry (BB), and Bed Bath and Beyond (BBBY) had predictable crashes on Thursday (Jan. 28) (partially thanks to the brokerages). Complacency is the most significant near-term risk to stocks by far, and I have been warning about this for weeks. But I tip my hat to all those who profited.
My goal for these updates is to educate you, give you ideas, and help you manage money like I did when I was pressing the buy and sell buttons for $600+ million in assets. I left that career to pursue one where I could help people who needed help, instead of the ultra-high net worth.
With that said, I still think we are long overdue for a correction since we haven't seen one since last March. The manic moves of the past week excite me but concern me greatly.
Corrections are healthy for markets and more common than most realize. Only twice in the last 38 years have we had years WITHOUT a correction (1995 and 2017).
A correction could also be an excellent buying opportunity for what should be a great second half of the year.
Therefore, to sum it up:
While there is long-term optimism, there are short-term concerns. A short-term correction between now and Q1 2021 is possible. I don't think that a decline above ~20%, leading to a bear market will happen.
Hopefully, you find my insights enlightening. I welcome your thoughts and questions, and wish you the best of luck.
We’re all in this together!
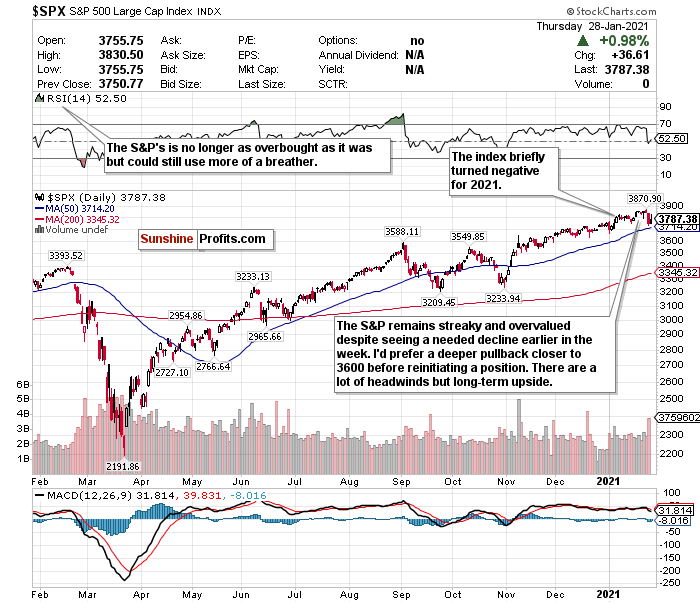
The S&P 500 Recovered After a Needed Breather This Week

Figure 1- S&P 500 Large Cap Index $SPX
The S&P briefly turned negative for 2021 after seeing its worst sell-off in nearly three months on Wednesday (Jan. 27). It saw a reliable recovery Thursday (Jan. 28) and is now up roughly 2.40% for the year.
However, it’s down nearly 1.75% week-to-date. It’s a much needed cool-off period of the S&P, and I feel that there could be more dips to come. The S&P remains around the 3800-level and has not been moved by what has been a week full of quality earnings. Remember- when the market usually gets what it expects, it’s usually a reason to sell more than buy. While they are largely beating estimates, earnings are not beating them to the point of exciting investors.
I also remain concerned about the S&P’s valuations. Although its RSI is not overbought and in hold territory, I’m still worried about the S&P’s forward P/E ratio, which is the highest it’s been since the dot-com bust.
Ned Davis Research also noted that the trailing P/E ratio of the median U.S. stock has never been higher in history, and fewer than ⅓ of S&P 500 stocks are trading under the long-term average 15 P/E.
What intrigues me about this index is that it seems to go on multiple day win streaks and lose streaks. After seeing a similar sell-off to what it saw on Wednesday (Jan. 27) three weeks ago, it went on a four-day win streak and broke past 3800. It went on a three-day losing streak this week before seeing its recovery Thursday (Jan. 28).
I like this decline in the S&P, and if Friday’s (Jan. 29) futures hold-up, it could mean the S&P’s second losing week in three. I would like to see a more profound drop to around 3600 or below before making a BUY call for the long-term.
There is a legitimate upside for the second half of 2021, but I would prefer to maximize it from a lower level. Discount shopping can be fun in the long-term.
A short-term correction could inevitably occur by the end of Q1 2021, but for now, I am sticking with the S&P as a HOLD.
For an ETF that attempts to directly correlate with the performance of the S&P, the SPDR S&P ETF (SPY) is a good option.
Thank you for reading today’s free analysis. If you would like to receive daily premium follow-ups, I encourage you to sign up for my Stock Trading Alerts to also benefit from the trading action described - the moment it happens. The full analysis includes more details about current positions and levels to watch before deciding to open any new ones or where to close existing ones.
Thank you.
Matthew Levy, CFAStock Trading Strategist
Free Gold &
Stock Market Newsletter
with details not available
to 99% investors
+ 7 days of Gold Alerts
Gold Alerts
More-
Status
New 2024 Lows in Miners, New Highs in The USD Index
January 17, 2024, 12:19 PM -
Status
Soaring USD is SO Unsurprising – And SO Full of Implications
January 16, 2024, 8:40 AM -
Status
Rare Opportunity in Rare Earth Minerals?
January 15, 2024, 2:06 PM

