

-
The Yield Harbinger for Stocks
February 22, 2021, 9:08 AMIndices, for the most part, closed fractionally higher to end the week. But a new headwind for stocks could be more concerning - rising bond yields.
That correction I’ve been calling for weeks could have potentially started.
While I don’t foresee a crash like we saw last March and feel that the wheels are in motion for a healthy 2021, I still maintain that some correction before the end of Q1 could happen.
Bank of America also echoed this statement and said last week that “We expect a buyable 5-10% Q1 correction as the big ‘unknowns’ coincide with exuberant positioning, record equity supply, and as good as it gets’ earnings revisions.”
But rather than looking at the past, let’s take a look at what’s on tap this week to get you ready for what could potentially be a volatile week ahead.
This coming week, be on the lookout for the January leading indicator index, durable goods orders, and personal income and spending.
On Tuesday, we will also receive the February Consumer Confidence Index; on Wednesday, the Census Bureau will release upcoming home sales. On Friday, the University of Michigan will release its Consumer Sentiment Index.
Of course, as we’ve seen in weeks past, jobless claims from the previous week will be announced on Thursday too. After outperforming the last few weeks, the jobless claims announced last Thursday (Feb. 18) grossly underperformed and reached their worst levels in nearly a month.
Earnings season has been outstanding but is winding down now. Be on the lookout this week for earnings from Royal Caribbean (RCL) on Monday (Feb. 22), Square (SQ) on Tuesday (Feb. 23), Nvidia (NVDA) on Wednesday (Feb. 24), and Virgin Galactic (SPCE) and Moderna (MRNA) on Thursday (Feb. 25).
We have the makings of a volatile week, and as I mentioned before, a possible correction.
Look. Don’t panic. We have a very market-friendly monetary policy, and corrections are more common than most realize. Corrections are also healthy and normal market behavior, and we are long overdue for one. Only twice in the last 38 years have we had years WITHOUT a correction (1995 and 2017), and we haven’t seen one in a year.
While it won’t happen for sure, I feel like it’s inevitable because of how much we have surged over the last few months.
A correction could also be an excellent buying opportunity for what could be a great second half of the year.
My goal for these updates is to educate you, give you ideas, and help you manage money like I did when I was pressing the buy and sell buttons for $600+ million in assets. I left that career to pursue one to help people who needed help instead of the ultra-high net worth.
With that said, to sum it up:
While there is long-term optimism, there are short-term concerns. A short-term correction between now and the end of Q1 2021 is possible. I don’t think that a decline above ~20%, leading to a bear market, will happen.
Hopefully, you find my insights enlightening. I welcome your thoughts and questions and wish you the best of luck.
Will the Russell 2000 Overheat Again?

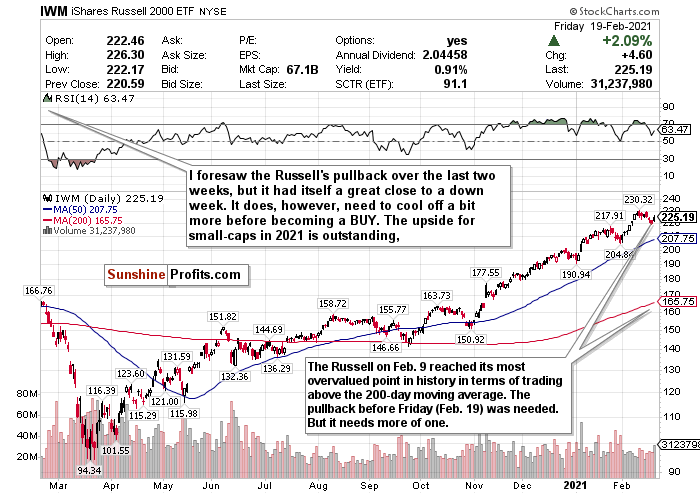
Figure 1- iShares Russell 2000 ETF (IWM)
The Russell 2000 popped on Friday (Feb. 19) after seeing a bit of a pullback since February 9. Between February 9 and the close on February 18, the Russell 2000 lagged behind the other indices after significantly overheating. I switched my call to a SELL then on the 9th, and it promptly declined by 3.40% before Friday’s session.
I foresaw the pullback but cautiously saw a rally and switched to a HOLD call before it popped over 2% on Friday (Feb. 19).
I do love small-caps for 2021, and I liked the decline before Friday. However, I feel like the index needs a minimum decline of 5% from its highs before switching it to a BUY.
As tracked by the iShares Russell 2000 ETF (IWM), small-cap stocks have been on a rampage since November.
Since the market’s close on October 30, the IWM has gained nearly 47.56% and more than doubled ETFs’ returns tracking the larger indices. If you thought that the Nasdaq was red hot and frothy, you have no idea about the Russell 2000.
Not to mention, year-to-date, it’s already up a staggering 16.38%.
It pains me not to recommend you to BUY the Russell just yet. I love this index’s outlook for 2021. Aggressive stimulus, friendly policies, and a reopening world could bode well for small-caps. Consumer spending, especially for small-caps, could be very pent-up as well.
But we just need to hold on and wait for it to cool down just a little bit more for a better entry point.
HOLD. If and when there is a deeper pullback, BUY for the long-term recovery.
For more of my thoughts on the market, such as the streaky S&P, inflation, and emerging market opportunities, sign up for my premium analysis today.
Thank you for reading today’s free analysis. If you would like to receive daily premium follow-ups, I encourage you to sign up for my Stock Trading Alerts to also benefit from the trading action described - the moment it happens. The full analysis includes more details about current positions and levels to watch before deciding to open any new ones or where to close existing ones.
Thank you.
Matthew Levy, CFA
Stock Trading Strategist -
For Stocks, Has the “Rational Bubble” Popped?
February 19, 2021, 9:10 AMThe market has continued to mainly trade sideways this week. However, the correction I’ve been calling for weeks has potentially started.
While I don’t foresee a crash like we saw last March, and feel that the wheels are in motion for a healthy 2021, I still maintain that some correction before the end of Q1 could happen.
Bank of America also echoed this statement and said last week that “We expect a buyable 5-10% Q1 correction as the big ‘unknowns’ coincide with exuberant positioning, record equity supply, and as good as it gets’ earnings revisions.”
Yes, the sentiment is still positive. That won’t change overnight. Vaccines seem more effective than we thought, especially against other variants of the virus. All that extra stimulus money and record low-interest rates could keep pushing stocks to more records and stimulate pent-up consumer spending. It’s not like the Fed is going to switch this policy up anytime soon, either.
They don’t call it a stimulus for nothing.
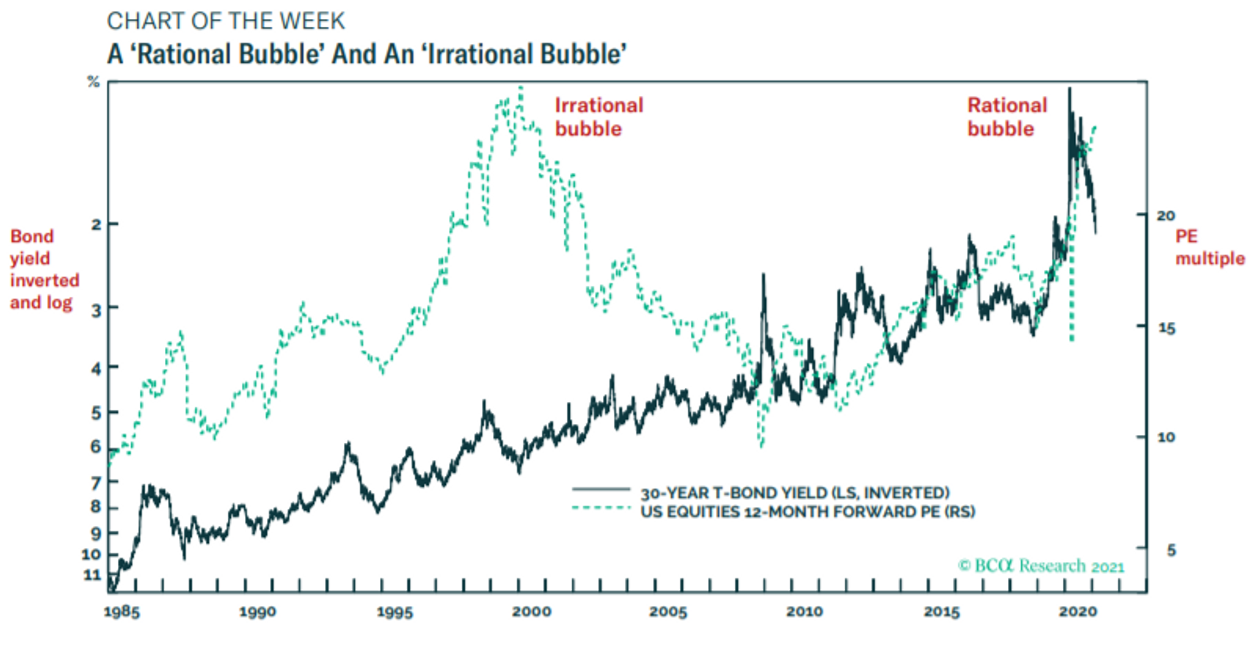
For weeks we’ve likely been in a rational bubble. Dhaval Joshi, the chief European investment strategist for BCA Research, has said that low bond yields meant the rally we’ve seen with stocks made sense.
“Rational, because the nosebleed valuations are justified by a fundamental driver. And not just any fundamental driver, but the most fundamental driver of all – the bond yield.”
Take a look at this chart comparing a “rational bubble” to an “irrational bubble.”

Figure 1
But now? Things have possibly changed. Complacency, valuations, surging bond yields, and inflation concern me.
They’re all connected. But look especially into the 10-year yield. It’s hovering around 1.30% for the first time in over a year.
Why is this concerning?
Rising interest rates=less attractive stocks.
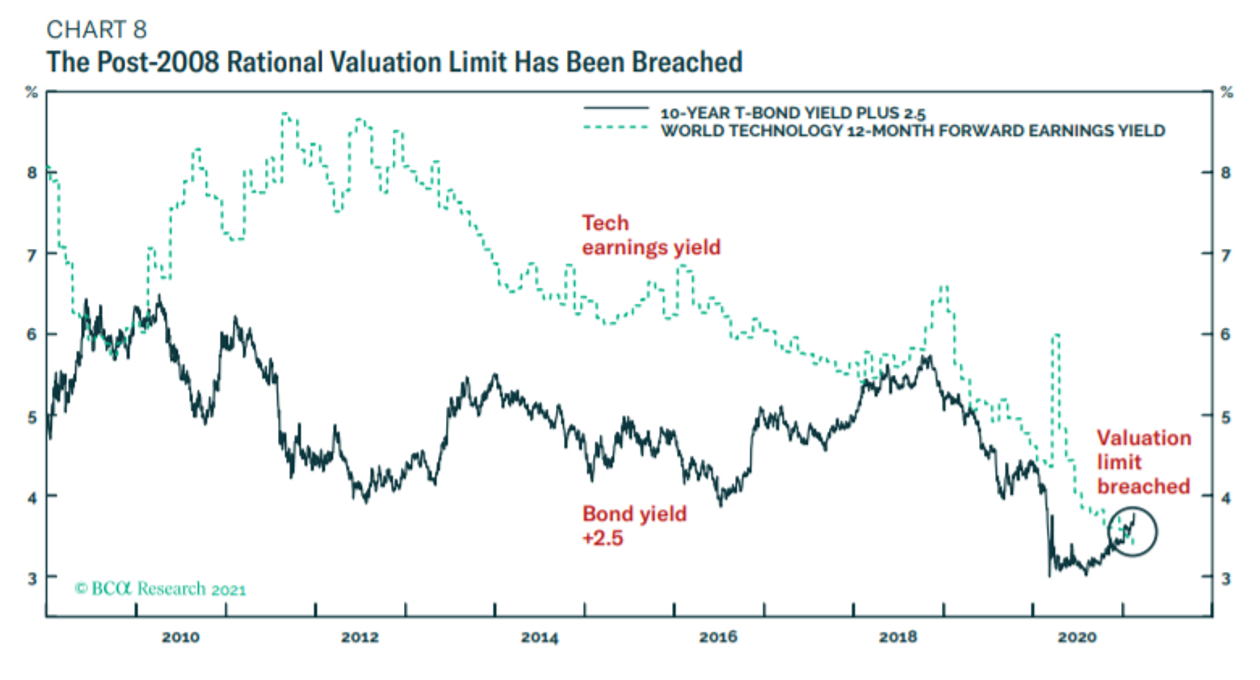
Look at this other chart. Forward P/E ratios are continuing to rise along with bond yields. In high-growth sectors, such as tech, this is especially concerning. The chart shows, in fact, that tech earnings yields have now been surpassed by the bond yield plus a fixed amount.

Figure 2
The only three ways this can be resolved are for stock prices to decline, bond yields to fall, or earnings to rise and improve stock valuations. Considering earnings season is over, only options 1 or 2 seem feasible in the near-term.
You combine this info with the Buffet Indicator (Total US stock market valuation/GDP), and you have a market that could be 228% overvalued.
I’ve already correctly called the Russell 2000’s pullback after how much it’s overheated. Since February 9th, when I switched the call to a sell, it’s declined roughly 3.40%.
More could follow.
Look. Corrections are healthy and normal market behavior, and we are long overdue for one. Only twice in the last 38 years have we had years WITHOUT a correction (1995 and 2017), and we haven’t seen one in a year.
A correction could also be an excellent buying opportunity for what could be a great second half of the year.
My goal for these updates is to educate you, give you ideas, and help you manage money like I did when I was pressing the buy and sell buttons for $600+ million in assets. I left that career to pursue one to help people who needed help instead of the ultra-high net worth.
With that said, to sum it up:
While there is long-term optimism, there are short-term concerns. A short-term correction between now and the end of Q1 2021 is possible. I don’t think that a decline above ~20%, leading to a bear market, will happen.
Hopefully, you find my insights enlightening. I welcome your thoughts and questions and wish you the best of luck.
A Needed Cool Down for the Russell 2000

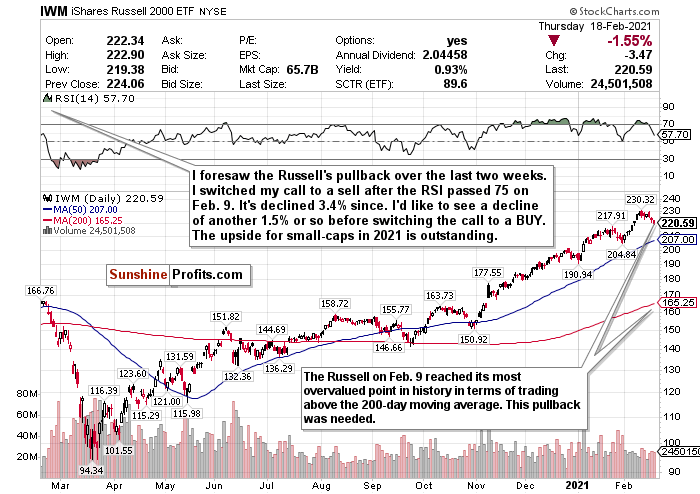
Figure 3
Since February 9, the Russell 2000 small-cap index has lagged behind the other indices after significantly overheating. I switched my call to a SELL then, and it promptly declined by 3.40%.
I do love small-caps for 2021, though, and I really like this decline. If it declines about another 1.50%, I’d feel more confident switching the call to a BUY.
As tracked by the iShares Russell 2000 ETF (IWM), small-cap stocks have been on a rampage since November.
Since the market’s close on October 30, the IWM has gained nearly 44.5% and more than doubled ETFs’ returns tracking the larger indices. If you thought that the Nasdaq was red hot and frothy, you have no idea about the Russell 2000.
Not to mention, year-to-date, it’s already up a staggering 14%.
Judging from these types of returns, the IWM’s decline since February 9 is hardly shocking. But for me, it’s still not enough, outside of switching the call to a HOLD.
It pains me not to recommend you to BUY the Russell just yet. I love this index’s outlook for 2021. Aggressive stimulus, friendly policies, and a reopening world could bode well for small-caps. Consumer spending, especially for small-caps, could be very pent-up as well.
But we need to just hold on and wait for it to cool down just a little bit more for a better entry point.
HOLD. If and when there is a deeper pullback, BUY for the long-term recovery.
For more of my thoughts on the market, such as the streaky S&P, inflation, and emerging market opportunities, sign up for my premium analysis today.
Thank you for reading today’s free analysis. If you would like to receive daily premium follow-ups, I encourage you to sign up for my Stock Trading Alerts to also benefit from the trading action described - the moment it happens. The full analysis includes more details about current positions and levels to watch before deciding to open any new ones or where to close existing ones.
Thank you.
Matthew Levy, CFA
Stock Trading Strategist -
Got Bond Concerns?
February 17, 2021, 9:07 AMThe market largely continued last week’s mixed moves, with the S&P and Nasdaq mildly retreating from record highs and the Dow eking out another record close.
The sentiment remains mostly rosy thanks to earnings that continue to impress, plummeting virus numbers worldwide, indicators that the economic recovery is gaining steam, and imminent stimulus.
But we’re not out of the woods yet, and I still worry about complacency and valuations.
But now, you can add one more concern to the list- rising bond yields.
On Tuesday (Feb. 16), the 10-year Treasury yield jumped 9 basis points to top 1.30% for the first time since February 2020. The 30-year rate also hit its highest level in a year.
Why is this concerning?
Rising interest rates=less attractive stocks.
Sure, the banks benefit. But what do you think this means for growth sectors such as tech that have benefited from low-rates?
You couple that with the fact that according to the Buffet Indicator (Total US stock market valuation/GDP), the market could be 228% overvalued, and tech stocks may be at valuations not seen since the dotcom bubble? Genuine concerns.
A rebound in rates could also put a dent in the economic recovery if both companies and consumers find it increasingly expensive to borrow.
While I don’t foresee a crash like we saw last March and feel that the wheels are in motion for a healthy 2021, I still maintain that some correction before the end of Q1 could happen.
Bank of America also echoed this statement and said last week that “We expect a buyable 5-10% Q1 correction as the big ‘unknowns’ coincide with exuberant positioning, record equity supply, and ‘as good as it gets’ earnings revisions.”
Corrections are healthy and normal market behavior, and we are long overdue for one. They are also way more common than most realize. Only twice in the last 38 years have we had years WITHOUT a correction (1995 and 2017).
A correction could also be an excellent buying opportunity for what could be a great second half of the year.
My goal for these updates is to educate you, give you ideas, and help you manage money like I did when I was pressing the buy and sell buttons for $600+ million in assets. I left that career to pursue one to help people who needed help instead of the ultra-high net worth.
With that said, to sum it up:
While there is long-term optimism, there are short-term concerns. A short-term correction between now and the end of Q1 2021 is possible. I don’t think that a decline above ~20%, leading to a bear market, will happen.
Hopefully, you find my insights enlightening. I welcome your thoughts and questions and wish you the best of luck.
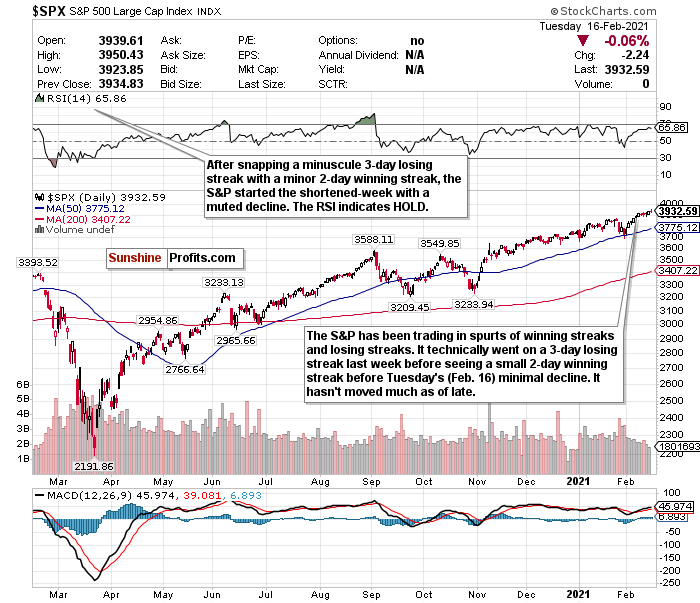
The Streaky S&P Is Back at a Record

Figure 1- S&P 500 Large Cap Index $SPX
The S&P continues to trade as a streaky index. It seemingly rips off multiple-day winning streaks or losing streaks weekly.
Before Tuesday’s (Feb. 16) “decline” (if you can call it that), here’s how the S&P has traded in February. It kicked off the month by ripping off a streak of gains in 6 of 7 days. It then promptly went on a 3-day losing streak, followed by a two-day winning streak and more record closes.
Then it declined a 0.06% to kick off the President’s Day shortened trading week.
More than 80% of S&P stocks that have reported earnings have beaten estimates, which is quite impressive. Yes, the forward P/E ratio is historically high. However, this P/E ratio has coincided with growing earnings.
With the index also up 5.9% month-to-date and a healthy outlook for the second half of the year, we could have some more room to run.
While the S&P’s RSI is still hovering around overbought levels, it’s remained stable at a HOLD level, mainly reflecting its muted moves over the last week and change.
A short-term correction could inevitably occur by the end of Q1 2021, but for now, I am sticking with the S&P as a HOLD.
For an ETF that attempts to directly correlate with the performance of the S&P, the SPDR S&P ETF (SPY) is a good option.
For more of my thoughts on the market, such as red-hot small-caps and emerging market opportunities, sign up for my premium analysis today.
Thank you for reading today’s free analysis. If you would like to receive daily premium follow-ups, I encourage you to sign up for my Stock Trading Alerts to also benefit from the trading action described - the moment it happens. The full analysis includes more details about current positions and levels to watch before deciding to open any new ones or where to close existing ones.
Thank you.
Matthew Levy, CFA
Stock Trading Strategist -
A Sleepy Week for the Indices?
February 12, 2021, 9:13 AMFor once, we have a week in 2021 where the market really didn't move all that much.
Except for weed stocks that whipsawed GameStock-like and Bitcoin and Dogecoin making waves thanks to Lord Elon, it's really been kind of a boring week for the major indices.
The S&P and Nasdaq closed at another record high Thursday (Feb. 11), while the Dow barely retreated from its own record high. The red-hot Russell has lagged this week.
However, it’s all relative. No index has moved upwards or downwards more than about 0.30% week-to-date.
It’s about time we had a week of relative quiet in the market.
The sentiment is indeed still rosy right now. The economic recovery appears to be gaining steam, and the Q1 GDP decline everyone predicted might not be as sharp as we anticipated. We could also be days away from trillions of dollars of much-needed stimulus getting pumped into the economy.
Earnings continue to impress, too, and are on pace to rise by over 20% in 2021. Since 1980, only 12 years have earnings increased by 15% or more. Except for 2018, the market gained an average of 12% in all of those years.
We could also days away from FDA approval of a one-dose vaccine from Johnson and Johnson (JNJ).
The COVID numbers and vaccine trend could truly turn the tide of things. More people in the U.S. have now been vaccinated than total cases, and the week kicked off (Feb. 8) with vaccine doses outnumbering new cases 10-1. Dr. Fauci also claims that vaccines could be available to the general public by April.
But we're not out of the woods yet. Sure this week has been calm.
But it’s almost been “too calm.”
I still worry about complacency, valuations, and the return of inflation.
“You wouldn’t know it from the sedate action in the averages,” but Wall Street is on “a highway to the danger zone,” CNBC’s Jim Cramer said.
“In a frothy market, stocks will have enormous rallies that are totally disconnected from the underlying fundamentals.”
He’s not wrong.
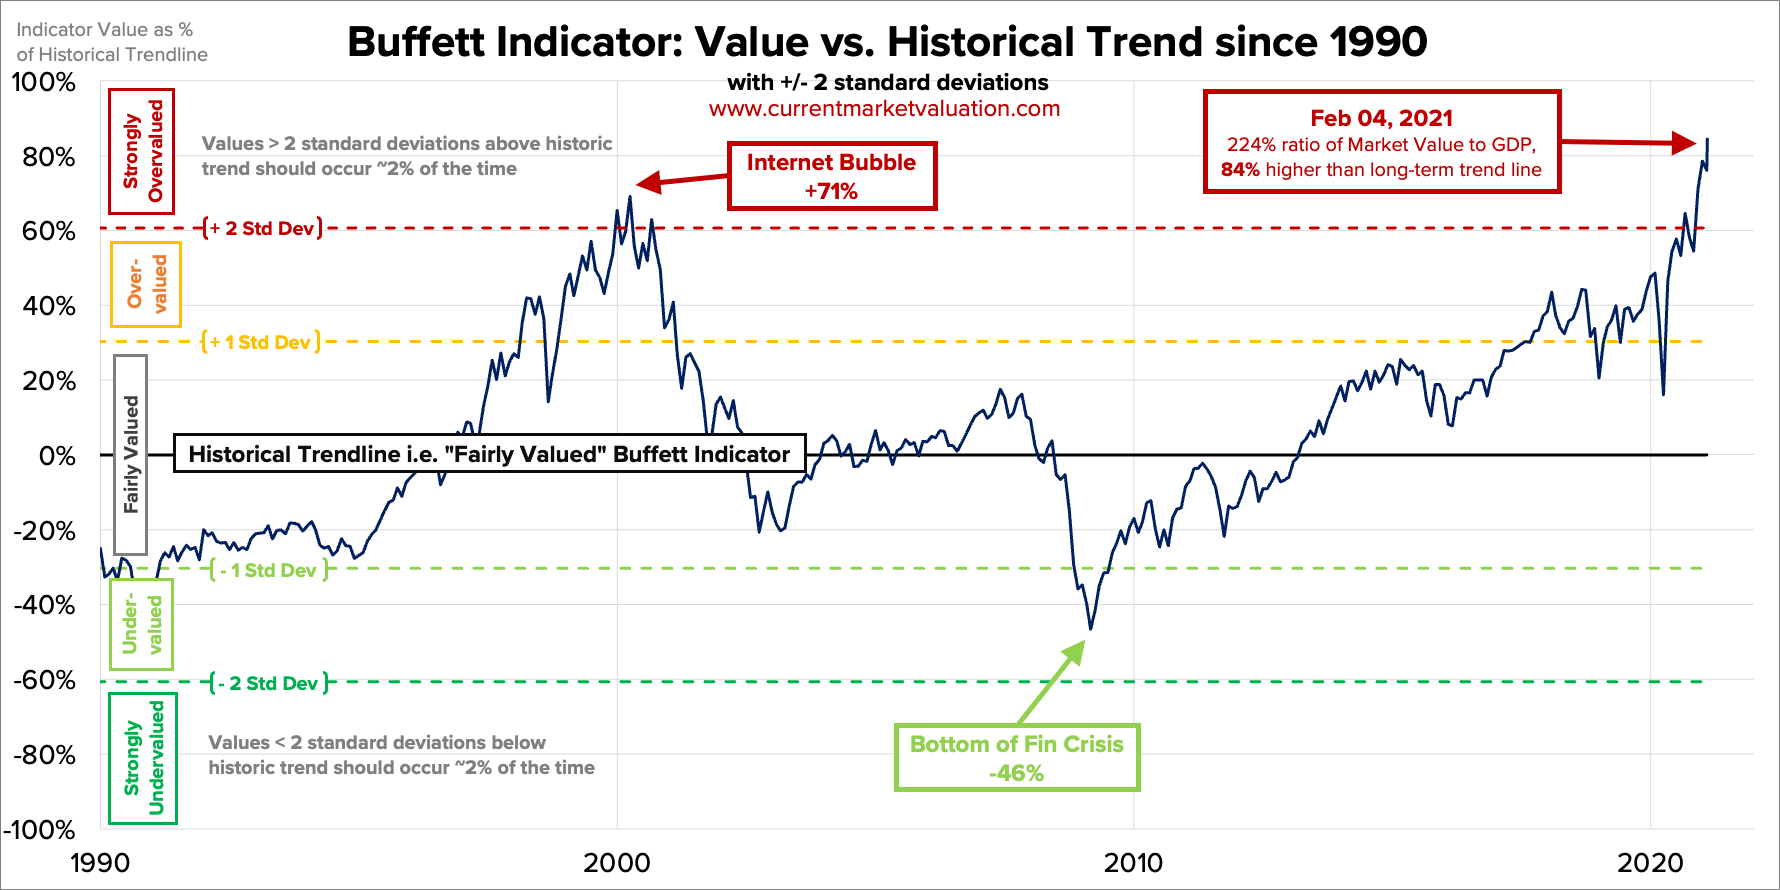
Look at the Buffett Indicator as of February 4. Where I track this indicator usually updates once a week and shows the total U.S. stock market valuation to the GDP.

If you take the US stock market cap of $48.7 trillion and the estimated GDP of $21.7 trillion, we're nearly 224% overvalued and 84% above the historical average. This ratio has not been at a level like this since the dotcom bubble.
Worse? This chart was dated February 4. The market’s only risen since then.
This is what I mean by don’t be fooled by the relative calm of this week.
The S&P 500’s forward 12-month P/E ratio is also well above its 10-year average of 15.8. The Russell 2000 is also back at a historic high above its 200-day moving average. Tech stock valuations are again approaching dotcom bust levels.
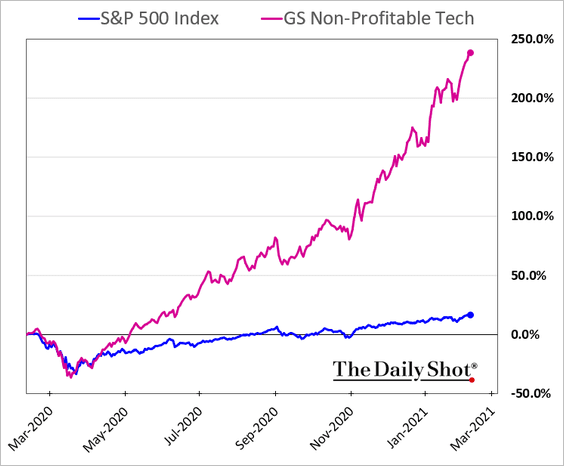
Still not sold? Look at Goldman’s non-profitable tech index. It’s approaching an absurd 250% year-over-year performance.

Bank of America also believes that a market correction could be on the horizon due to signs of overheating.
While I don’t foresee a crash like we saw last March, I still maintain that some correction before the end of Q1 could happen.
Corrections are healthy and normal market behavior, and we are long overdue for one. They are also way more common than most realize. Only twice in the last 38 years have we had years WITHOUT a correction (1995 and 2017).
A correction could also be an excellent buying opportunity for what could be a great second half of the year.
Bank of America also echoed this statement and said that “We expect a buyable 5-10% Q1 correction as the big ‘unknowns’ coincide with exuberant positioning, record equity supply, and ‘as good as it gets’ earnings revisions.”
The key word here- buyable.
My goal for these updates is to educate you, give you ideas, and help you manage money like I did when I was pressing the buy and sell buttons for $600+ million in assets. I left that career to pursue one where I could help people who needed help, instead of the ultra-high net worth.
With that said, to sum it up:
While there is long-term optimism, there are short-term concerns. A short-term correction between now and the end of Q1 2021 is possible. I don't think that a decline above ~20%, leading to a bear market will happen.
Hopefully, you find my insights enlightening. I welcome your thoughts and questions and wish you the best of luck.
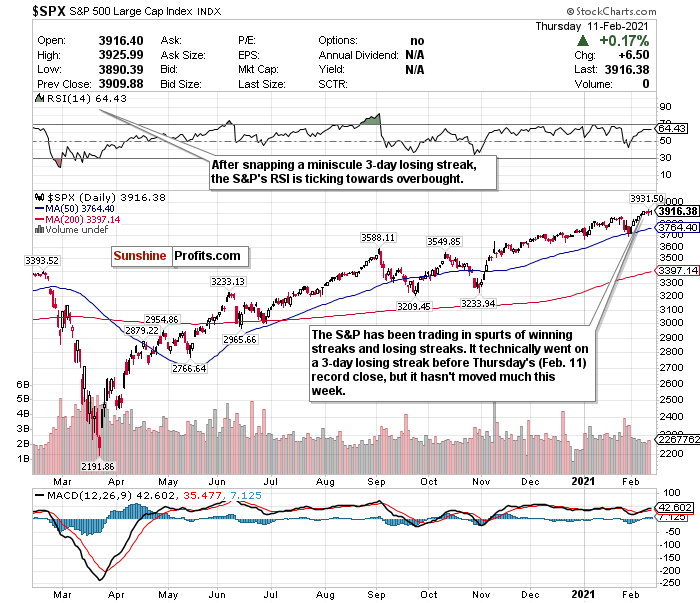
The Streaky S&P Is Back at a Record

Figure 1- S&P 500 Large Cap Index $SPX
The S&P continues to trade as a streaky index. It seemingly rips off multiple-day winning streaks or losing streaks weekly.
After the S&P 500 ripped off a streak of gains in 6 of 7 days, it promptly went on a 3-day losing streak, followed by another record close.
I would hardly call that a 3-day losing streak, though. I’d even say it was a boring week for the S&P 500 with muted moves.
The outlook is healthy, though, especially when you consider earnings. More than 80% of S&P stocks that have reported earnings thus far have beaten estimates.
What could be on tap for next week? Who even knows anymore. But if earnings keep on outperforming, and the sentiment remains stable, it could be another strong week.
The S&P’s RSI is ticking up towards overbought. However, because it’s still below 70, and because of the streaky manner in which the index has traded, it remains a HOLD.
A short-term correction could inevitably occur by the end of Q1 2021, but for now, I am sticking with the S&P as a HOLD.
For an ETF that attempts to directly correlate with the performance of the S&P, the SPDR S&P ETF (SPY) is a good option.
For more of my thoughts on the market, such as red-hot small-caps and emerging market opportunities, sign up for my premium analysis today.
Thank you for reading today’s free analysis. If you would like to receive daily premium follow-ups, I encourage you to sign up for my Stock Trading Alerts to also benefit from the trading action described - the moment it happens. The full analysis includes more details about current positions and levels to watch before deciding to open any new ones or where to close existing ones.
Thank you.
Matthew Levy, CFA
Stock Trading Strategist -
That Wasn’t Much of a Down Day...
February 10, 2021, 9:24 AMTechnically, the Dow and S&P snapped their 7-day winning streak.
Technically.
I hardly consider a decline of 0.03% and 0.11% for the Dow and S&P, respectively, a down day.
Meanwhile, the Nasdaq and Russell saw a record close for who knows how many consecutive days.
Can the market keep this up? Who even knows anymore. Everything seems to defy expectations and logic. Yeah, it's possible. But I'd be surprised if we don't see at least one sharp pullback before the end of the week.
The sentiment is surely rosy right now. The economic recovery appears to be gaining steam, and the Q1 decline everyone predicted might not be as swift as we anticipated- if at all. President Biden's stimulus could officially pass within days as well and provide much-needed relief to struggling businesses and families.
Have you seen the vaccine numbers lately, too? More people in the U.S. have now been vaccinated than total cases. On Monday (Feb. 8), vaccine doses outnumbered new cases 10-1. New daily COVID cases have also reached their lowest levels since October.
With Johnson and Johnson's (JNJ) one dose vaccine candidate seemingly days away from FDA approval, the outlook is certainly more positive at this point than many anticipated.
But we're not out of the woods yet, and three non-pandemic related factors still concern me- complacency, overvaluation, and inflation.
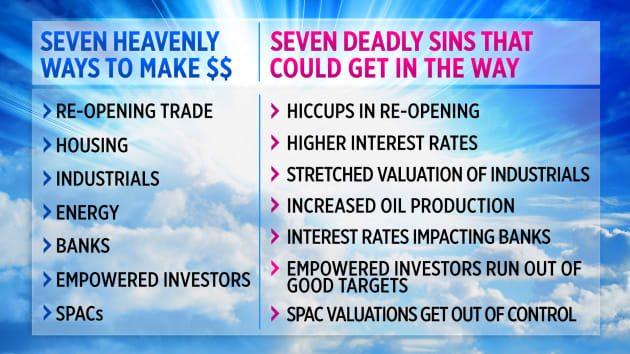
Jim Cramer's "Seven Deadly Sins" from Mad Money Monday night (Feb. 8) reflect many of my concerns too:

Source: CNBC
Yes, I know I keep saying to beware. I also know that earnings are on pace to rise by over 20% in 2021. Since 1980, only 12 years have earnings increased by 15% or more. Except for 2018, the market gained an average of 12% in all of those years.
But consider some valuation metrics that scream “bubble.”
As of February 4, 2021, the Buffett Indicator, or the ratio of the total US stock market valuation to the GDP, was at a level not seen since the dotcom bubble. If you take the US stock market cap of $48.7 trillion and the estimated GDP of $21.7 trillion, we're nearly 224% overvalued and 84% above the historical average.
Keep in mind; this chart was dated February 4. This number has only grown since then. Tuesday (Feb. 9) was hardly a down day. If anything, it was plain dull.
Fears of a bubble are genuine. The S&P 500’s forward 12-month P/E ratio is back to above 22 and well above the 10-year average of 15.8. The Russell 2000 is also back at a historic high above its 200-day moving average. Tech stock valuations are again approaching dot-com bust levels.
Bank of America also believes that a market correction could be on the horizon due to signs of overheating.
While I don’t foresee a crash like we saw last March, I still maintain that some correction before the end of Q1 could happen.
Corrections are healthy and normal market behavior, and we are long overdue for one. They are also way more common than most realize. Only twice in the last 38 years have we had years WITHOUT a correction (1995 and 2017).
A correction could also be an excellent buying opportunity for what could be a great second half of the year.
Bank of America also echoed this statement and said that “We expect a buyable 5-10% Q1 correction as the big ‘unknowns’ coincide with exuberant positioning, record equity supply, and ‘as good as it gets’ earnings revisions.”
The key word here- buyable.
My goal for these updates is to educate you, give you ideas, and help you manage money like I did when I was pressing the buy and sell buttons for $600+ million in assets. I left that career to pursue one where I could help people who needed help, instead of the ultra-high net worth.
With that said, to sum it up:
While there is long-term optimism, there are short-term concerns. A short-term correction between now and the end of Q1 2021 is possible. I don't think that a decline above ~20%, leading to a bear market will happen.
Hopefully, you find my insights enlightening. I welcome your thoughts and questions and wish you the best of luck.
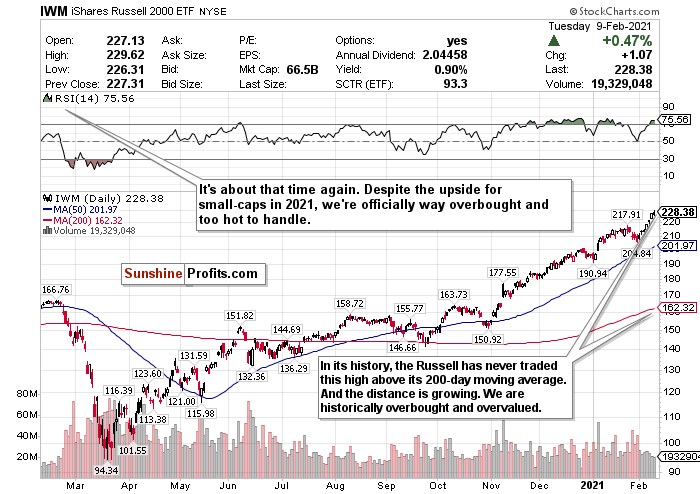
Small-Caps are Officially Overbought

Figure 1- iShares Russell 2000 ETF (IWM)
This pains me to write this because I love Russell 2000 small-cap index in 2021.
But this is getting ridiculous now.
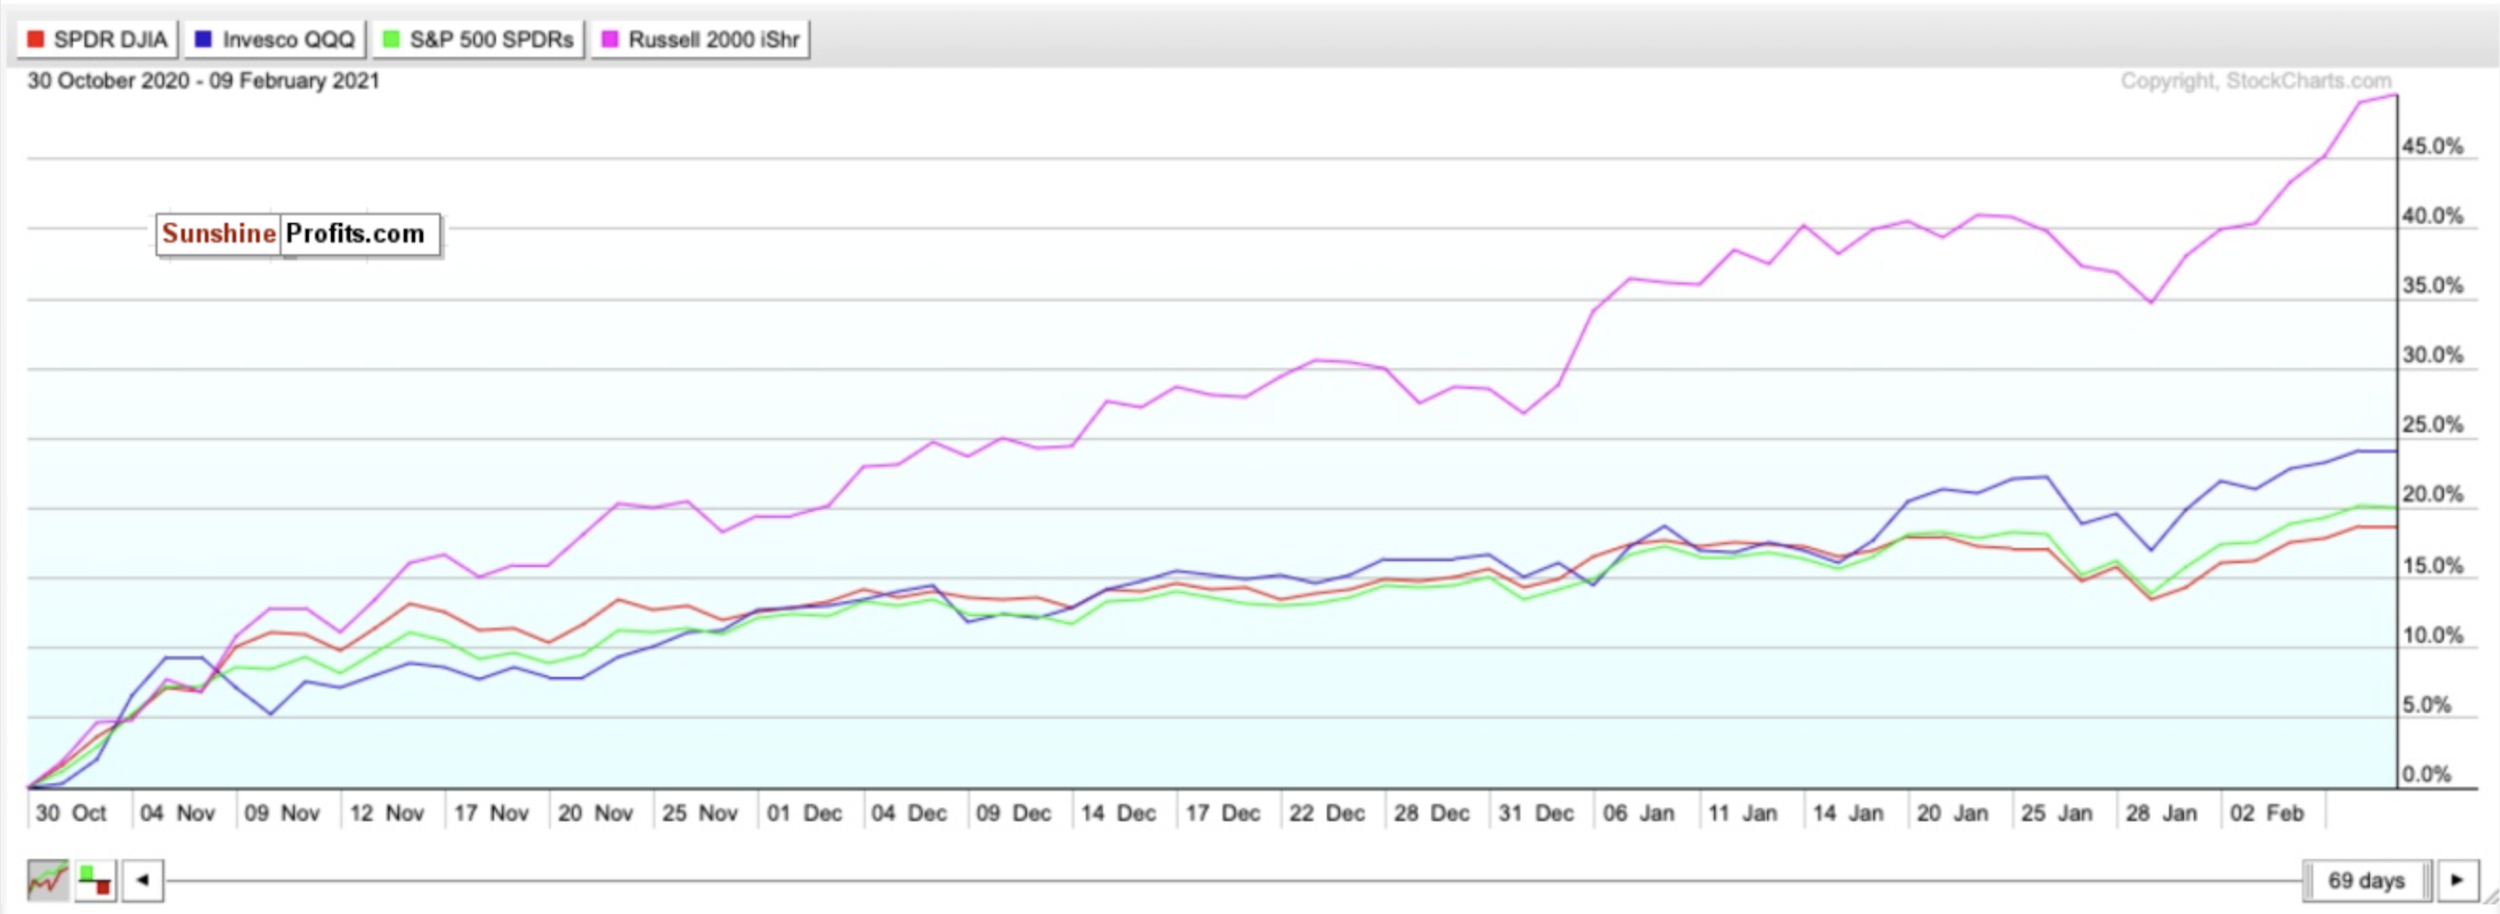
As tracked by the iShares Russell 2000 ETF (IWM), small-cap stocks have been on a rampage since November. Since the close on October 30, the IWM has gained nearly 50% and more than doubled ETFs' returns tracking the larger indices. What happened to the Nasdaq being red hot? This chart makes it look like an igloo.

Since the close on January 29, the Russell has done just about the same again and gained 11.10%. It’s outperformed all the other major indices by a minimum of 5% in that period.
Not to mention, year-to-date, it’s already up a staggering 18%.
Small-caps are funny. They either outperform and underperform and can be swayed easily by the news. I foresaw the pullback two weeks ago coming for over a month, and unfortunately, I see the same thing happening now. But only for the short-term.
I remain bullish due to aggressive stimulus, which could be put in motion this week.
I also love small-cap stocks for the long-term, especially as the world reopens and this Biden agenda gets put in motion. It seems like things are finally trending in the right direction.
For now, though, the index is once again overbought.
The RSI is at a scorching 75, and I can't justify calling this a BUY or HOLD right now. It's an excellent time to take profits.
SELL and take profits. If and when there is a deeper pullback, BUY for the long-term recovery.
Thank you for reading today’s free analysis. If you would like to receive daily premium follow-ups, I encourage you to sign up for my Stock Trading Alerts to also benefit from the trading action described - the moment it happens. The full analysis includes more details about current positions and levels to watch before deciding to open any new ones or where to close existing ones.
Thank you.
Matthew Levy, CFA
Stock Trading Strategist
Free Gold &
Stock Market Newsletter
with details not available
to 99% investors
+ 7 days of Gold Alerts
Gold Alerts
More-
Status
New 2024 Lows in Miners, New Highs in The USD Index
January 17, 2024, 12:19 PM -
Status
Soaring USD is SO Unsurprising – And SO Full of Implications
January 16, 2024, 8:40 AM -
Status
Rare Opportunity in Rare Earth Minerals?
January 15, 2024, 2:06 PM

